

Abstract
Climate models predict a large range of possible future temperatures for a particular scenario of future emissions of greenhouse gases and other anthropogenic forcings of climate. Given that further warming in coming decades could threaten increasing risks of climatic disruption, it is important to determine whether model projections are consistent with temperature changes already observed. This can be achieved by quantifying the extent to which increases in well mixed greenhouse gases and changes in other anthropogenic and natural forcings have already altered temperature patterns around the globe. Here, for the first time, we combine multiple climate models into a single synthesized estimate of future warming rates consistent with past temperature changes. We show that the observed evolution of near-surface temperatures appears to indicate lower ranges (5–95%) for warming (0.35–0.82 K and 0.45–0.93 K by the 2020s (2020–9) relative to 1986–2005 under the RCP4.5 and 8.5 scenarios respectively) than the equivalent ranges projected by the CMIP5 climate models (0.48–1.00 K and 0.51–1.16 K respectively). Our results indicate that for each RCP the upper end of the range of CMIP5 climate model projections is inconsistent with past warming.
Export citation and abstract BibTeX RIS

Content from this work may be used under the terms of the Creative Commons Attribution-NonCommercial-ShareAlike 3.0 licence. Any further distribution of this work must maintain attribution to the author(s) and the title of the work, journal citation and DOI.
1. Introduction
Climate models project a wide range of future warming following a particular scenario of emissions over coming decades, due to their different sensitivities to climate forcings, and the different rates at which models take up heat into the interior of the ocean [1]. Given that higher rates of warming could be associated with greater adaptation challenges and could increase the risks of impacts that are abrupt or irreversible [2], it is important to determine whether some model projections are more likely than others. Observations of past climate changes provide a means of discriminating between climate models, based on how well they capture the anthropogenic fingerprints of change that have already emerged in observations [3–5].
The extent to which models under-or over-estimate the past response to anthropogenic and natural forcings is closely related to the extent to which they under-or over-estimate the future response to these forcings [6]. Therefore observations of past warming may be used to make estimates of the temperature response to future forcings that, to first order, are not biased by model errors in climate feedbacks or in rates of ocean heat uptake [7, 8]. As the signal of climate change strengthens relative to the noise of natural internal variability, the uncertainties in future warming rates are expected to decrease [5], an expectation borne out by subsequent projections that also include 21st century observations [9, 10].
Recently a new multi-model ensemble of climate models, CMIP5, has become available [11], including simulations of future warming rates following the Representative Concentration Pathways (RCPs) of emissions [12]. While CMIP5 provides the most complete exploration of climate model uncertainty yet undertaken with a new generation of climate models that incorporate more sophisticated treatments of forcings such as anthropogenic aerosols and land use changes, it provides an ensemble of opportunity rather than a systematic exploration of modelling uncertainty [13]. Given that higher rates of warming in the coming decades will potentially pose greater challenges to communities seeking to adapt to future climate change, it is important to evaluate whether the range of warming projected across this new ensemble of opportunity is representative of the likely range of future warming consistent with warming already observed. We assess this using detection and attribution techniques to compare observations and models, thereby investigating whether the CMIP5 ensemble of opportunity provides a realistic exploration of future uncertainty in temperatures and whether future warming rates derived from the CMIP5 ensemble could be biased systematically to give too much or too little warming.
2. Data and methods
2.1. CMIP5 simulations
The CMIP5 models we analyse here are those models that have the three types of simulations we require in order to distinguish between errors in models' climate sensitivity and their net forcing which could, when anthropogenic and natural forcings are combined in the same simulations, lead to possible cancellation of errors. These are: simulations including only changes in well mixed greenhouse gases (GHG), simulations including both changes in well mixed greenhouse gases and other anthropogenic forcings including the direct and indirect effects of aerosols, and in many models the effects of tropospheric and stratospheric ozone changes (ANT), and simulations including natural forcings only (NAT). In addition, we require two types of simulations of future change. These are the standard CMIP5 RCP simulations including all the anthropogenic forcings considered, and also additional simulations including changes in well mixed greenhouse gases only following the RCP scenarios but with all other anthropogenic and natural forcings held constant. These are needed in order to account for the effects of errors in a model's transient climate response to forcings separately from the effects of errors in a model's net forcings. By scaling up or down the model's simulation of well mixed greenhouse gases separately from its response to other anthropogenic forcings, the effects of such systematic errors on the model's projections can be corrected.
In this paper, we consider 6 climate models, the CanESM2, CNRM-CM5, CSIRO-Mk3-6-0, HadGEM2-ES, NorESM1-M and IPSL-CM5A-LR models, taking data from the CMIP5 archive [11]. For the historical period, all 6 climate models had at least one GHG simulation. However, very few climate modelling centres have carried out GHG simulations that include future increases in well mixed greenhouse gases only following the RCP scenarios because they were not part of the CMIP5 experimental protocol [11]. The only such climate model runs we analyse here are of the HadGEM2-ES and CanESM2 models [9, 10]. Observationally constrained projections have been shown to have a somewhat lower range of warming when based on CanESM2 [9] than when based on HadGEM2-ES [10], where the former was based on an analysis of the 1851–2010 observational period and the latter was based on the shorter 1911–2010 observational period. However, it is possible to emulate reasonably precisely the global mean temperature response of a model to increasing greenhouse gases without performing transient climate model experiments [14].
2.2. Emulation of future GHG responses
Emulation of a climate model's response to future increasing greenhouse gas concentrations is achieved by scaling the response of the CMIP5 experiment in which CO2 is increased abruptly to four times pre-industrial concentrations and by assuming that the responses to forcing changes combine linearly [14, 15]. This approach has been validated for various climate quantities at both global [14, 15] and regional [16] scales.
An estimate of radiative forcing in climate models is required for the emulation. This is estimated using the method of Forster and Taylor ([17]; denoted FT), using the abrupt 4 × CO2 experiment to estimate feedback parameters [14]. This method requires climate model results for the scenario of interest. However, forcing for one climate model may be estimated using the forcing derived from another, using a linear scaling factor [14]. This method is applicable if at least one climate model has simulated the scenario of interest. It leads to accurate reproduction of CMIP5 RCP projections of global mean temperature and heat uptake [14].
For the historical period, all 6 climate models had at least one GHG simulation, so we estimate historical forcing directly for each GCM (where a GCM has multiple simulations, we used the mean of these). Hence, any committed responses to historical GHG forcings are accurately captured. For the future period, only two GCMs had GHG simulations (HadGEM2-ES and CanESM2; CanESM2 results were reserved for validation). We estimate the future GHG forcing for each climate model as the forcing in HadGEM2-ES multiplied by a constant scaling factor. This scaling factor for each climate model was estimated by linear regression of the GHG forcings over the historical period against the equivalent forcings for HadGEM2-ES. The temperature response to this forcing was then estimated as in [14]. Simulations by this approach are limited by the length of the abrupt 4 × CO2 experiment (140 years), so were initialized at 1910 (the RCP anomaly method, permitting initialization at 2005 in [14], is not applicable here). In principle initializing at 1910 can introduce a cold-start error [18], as it introduces an abrupt change in forcing at 1910 (by ignoring longer-term responses of pre-1910 forcing changes). However, this bias is negligible (figure 1, compare red and black lines). Interannual variability in our emulation comes from variability in the estimated forcing.
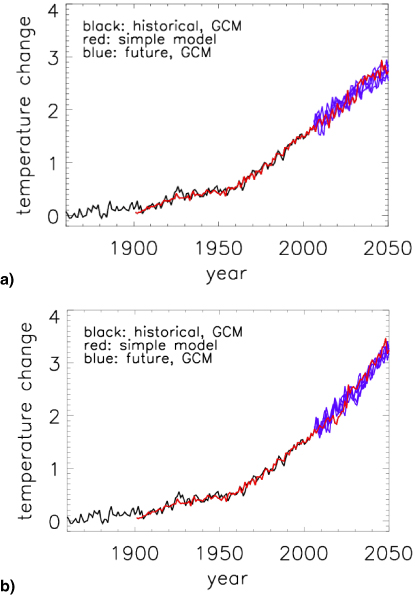
Figure 1. Comparison of model emulation (red) for (a) RCP4.5 and (b) RCP8.5 for the CanESM2 GHG only runs (black: mean over historical period; blue: individual GCM runs for future period).
Download figure:
Standard imageOur model emulation is tested against future GHG simulations from CanESM2 and is found to track the actual GCM results during the historical period (figure 1, red and black lines), and for the future period is within the spread of simulations with different initial conditions (figure 1, red and blue lines). The reason for the difference in variability between the historical and future periods in figure 1 is because the results for the historical period represent means over all available initial value ensemble members (because the simple model forcing is based on the mean over all available CanESM runs for the historical period) whereas for the future period our emulation uses forcing derived from just a single GCM run (projection from HadGEM2-ES). As a result it is appropriate to test the emulation procedure by comparing the emulation (red line) with the spread of individual CanESM2 runs (blue lines).
2.3. Observationally constrained projections
Having obtained the requisite model-based projections of future global mean temperatures following the RCP4.5 and RCP8.5 scenarios, we calculate observationally constrained warming rates based on fingerprints calculated from the six models. We use the results of standard optimal detection analyses [19–22] in which observed temperature changes from HadCRUT4 [23] are regressed against simulated GHG (greenhouse gases), OTH (other anthropogenic) and NAT (natural) responses from the different models. In this way, scaling factors are derived which represent the amount by which the models' responses to the different forcings need to be scaled up or down to be consistent with the observed temperature change. The distributions of scaling factors we use here are taken directly from two previous analyses considering large scale (>5000 km, [24]) decadal mean changes in near-surface temperature over the 1861–2010 and 1951–2010 periods [19, 20]. Further technical details of the optimal detection analyses are contained in the two papers [19, 20]. Importantly, such analyses require an estimate of internal variability. For these analyses, multiple climate models are combined, both from long control runs in which climate forcings are held constant, and by taking differences between simulations of the same climate model with identical forcings but different initial conditions, in order to obtain multiple possible realizations of multi-decadal scale variability in the absence of external forcings. In all cases, the signals of climate change due to external forcings are estimated from averaging multiple simulations of the models with the same forcing factors but different initial conditions. Further details of the models analysed, including the number of single forcing ensemble members averaged, and details of the forcing factors included, are provided in tables 4 and 6 of [20].
To obtain observationally constrained estimates of future warming, distributions of scaling factors for GHG and other anthropogenic forcings (OTH) for a particular climate model are used to scale future projections of global mean temperature response to greenhouse gases (GHG) separately from the response to other anthropogenic forcings (OTH) from the same model. Natural forcings are assumed not to change in future (apart from a repeating constant 11 year solar cycle of solar irradiance). In addition, an estimate of decadal mean internal variability is added to the result to produce the possible range of temperatures in any one decade due to the combination of forced changes and unforced internal variability [5]. The final result therefore takes account both of the uncertainties in predicting the response of the climate system to forcings and the actual trajectory of the climate system around the forced response due to unpredictable internal variability. We also take account of the correlation between uncertainties in scaling factors by considering their joint distributions; for example the upper (lower) percentiles of the distribution of scaling factors on the greenhouse gas contribution may be associated with the upper (lower) percentiles of the scaling factors on the other anthropogenic factors if the joint uncertainties allow large (small) greenhouse warming to be balanced by large (small) aerosol cooling. These joint distributions of scaling factors are then applied to the models' projections of global mean temperature response to greenhouse gases and to other anthropogenic forcings in future following the RCP4.5 and 8.5 scenarios [12] to derive likelihood distributions of future warming consistent with past warming. We apply both the individual model analyses separately for each of the models and also average the models and apply the multi-model scaling factors to the average of the six model projections (see [19, 20] for further details of the optimal detection analyses from which we obtain the relevant scaling factors).
3. Results and discussion
The resultant uncertainty ranges (5%–95%) on future warming according to the RCP4.5 and RCP8.5 scenarios are shown in figures 2 and 3. Estimates obtained from individual models alone (green lines) are shown in each panel for the two observational analysis periods (1861–2010: solid lines; 1951–2010: dashed lines) and compared with the multi-model average based estimates of future warming derived from the 1861–2010 observational analysis period (black lines). The analyses based on individual models alone supports the multi-model average results, with the exception of the CSIRO-based analysis which gives much higher rates of possible warming (within the 5%–95% range) and one of the CanESM2-based analyses which gives much lower rates of possible warming. The CSIRO model was an outlier in the attributable trends estimated for the 1861–2010 period with the other 5 model results considered being much more consistent [19]. Inconsistent uncertainty ranges imply there is an additional source of uncertainty not accounted for in our analysis due for example to errors in modelled patterns of temperature response to forcings. While further work is needed to investigate why the CSIRO model gives much higher attributable near-surface warming due to greenhouse gases than all other models investigated so far, the general degree of agreement between observationally constrained warming ranges estimated from individual model results and from the multi-model average support using the latter as our best estimate of likely future warming rates.

Figure 2. Global mean temperature change following the RCP 4.5 scenario as observed from HadCRUT4 (to 2010: black line), and in each panel as simulated by one of the 6 climate models (red line). The 5 and 95 percentiles of the observationally constrained projections based on the multiple model average are shown as black lines (after 2010) and the 5 and 95 percentiles of the observationally constrained projections based on the individual model are shown as green lines. Results from the analysis based on 1951–2010 [20] are shown as dashed lines and results from the analysis based on 1861–2010 [19] are shown as solid lines. Temperatures are plotted as anomalies relative to the 1986–2005 mean.
Download figure:
Standard image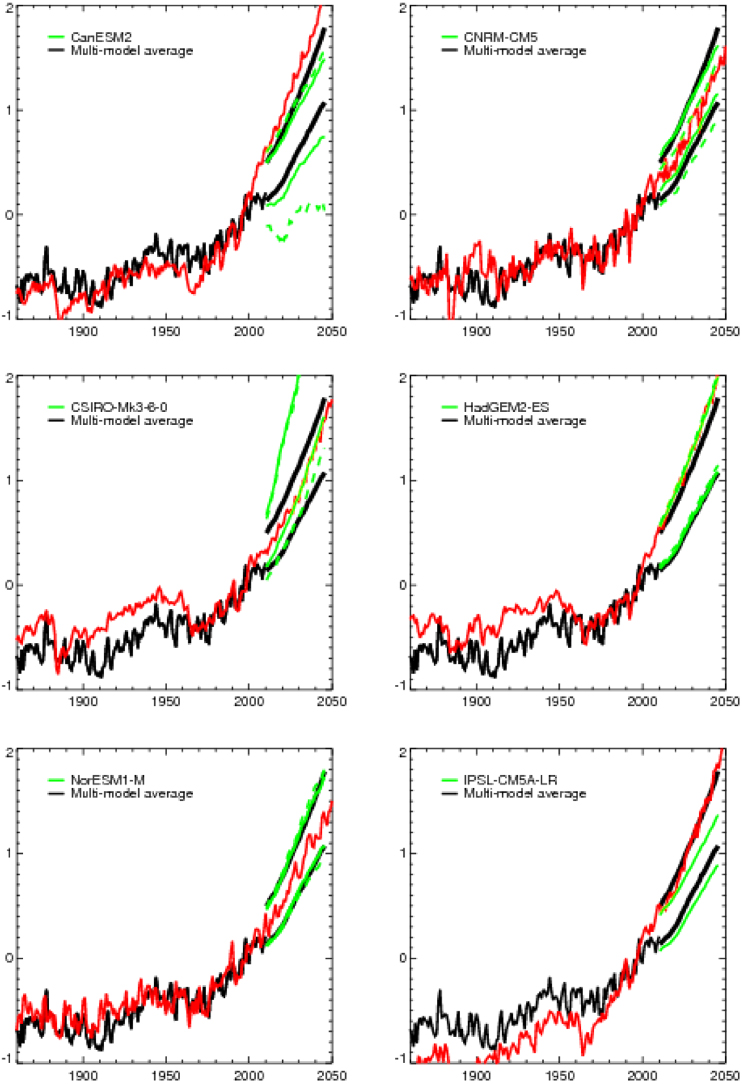
Figure 3. As figure 2 but for the RCP 8.5 scenario.
Download figure:
Standard imageBased on the multi-model average results we find the 5–95 percentile ranges of warming consistent with past observed changes from 1951–2010 to be 0.35–0.82 K and 0.45–0.93 K by the 2020s (2020–9 decadal mean) relative to 1986–2005 according to the RCP4.5 and RCP8.5 scenarios respectively. However, given the two outlier results, there is still the possibility of much lower or higher rates of warming than the 5%–95% uncertainty ranges based on the multi-model average results.
In figure 4 we compare the observationally constrained ranges (5 and 95 percentiles, black solid lines) with the 5–95 percentile range from the full CMIP5 multi-model ensemble (grey shaded area). The 5–95 percentile ranges of warming from the multi-model ensemble (treating each model with equal weight) are 0.48–1.00 K and 0.51–1.16 K by the 2020s (2020–9 decadal mean) relative to 1986–2005 according to the RCP4.5 and RCP8.5 scenarios respectively. Our results show that taking the 95 percentile of the multi-model range substantially over-estimates the 95 percentile of range of uncertainty of future warming consistent with past temperature changes. Thus observations appear to rule out the upper most part of the CMIP5 multi-model ensemble. This is consistent with the uncertainty ranges of scaling factors on the greenhouse gas contribution to past warming from the original detection analyses [19, 20] being systematically less than 1.

Figure 4. Global mean temperature change as observed from HadCRUT4 (black line to 2010), and with 5 and 95 percentiles of the observationally constrained projections based on multiple models (black lines from 2010). Grey shaded area shows 5–95 percentiles of the full range of the CMIP5 model simulations. Projections follow the RCP4.5 scenario (top) and the RCP8.5 scenario (bottom).
Download figure:
Standard imageWhile we have shown these results are supported by a range of models with a range of different climate sensitivities, for two of the models we used (CanESM2 and CSIRO) the results were somewhat different. Our analysis accounts for gross errors in a model's transient climate response and net forcing over the past, but it assumes that an individual model's large-scale pattern (or 'fingerprint') of temperature response to a particular forcing is correct (allowing errors only in its magnitude). By averaging over many models the risk of model pattern error is reduced, as has also been demonstrated for modelled simulation of observed climatology [25]. As a result, using the consensus model average for these fingerprint patterns, scaled by factors which correct for the extent to which such fingerprints are over-or under-estimated, produces a more robust estimate of uncertainty in future global warming than obtainable from the raw model data alone. Nevertheless additional uncertainties remain which have not been quantified and therefore not incorporated in our analysis, including due to errors in climate models' simulation of the patterns of near-surface temperature response to external forcings and errors in their simulation of natural internal variability over multi-decadal timescales. Furthermore, because climate model simulations including future increases in well mixed greenhouse gases only were not available, we applied an emulator to represent the global mean temperature response of a model to increasing greenhouse gases, and any errors in this emulation will provide an additional source of uncertainty in the analysis. As such, while our results are indicative that the upper part of the CMIP5 model range appears inconsistent with past warming, further improvements in models' representation of internal variability and the response of the climate system to external forcings as well as additional model simulations including future increases in well mixed greenhouse gases could provide improved estimates of likely future warming rates.
All the results given here are conditional on a particular evolution of anthropogenic emissions for each RCP. There is therefore an additional source of uncertainty in future warming due to forcing uncertainty, a key source of which is due to uncertainties in future aerosol emissions, with rapid warming possible if global aerosol emissions reduce substantially [26].
By use of more observational data it may be possible to improve such observational constraints on future warming. Simply waiting for another ten years of near-surface temperature data should reduce the uncertainties [3], but use of other observations in addition to near-surface temperatures, for example observed temperatures of the interior of the ocean, may help to improve such constraints sooner and help to identify which aspects of climate model simulations of the past may be in error, be it ocean heat uptake, climate sensitivity or net forcing [27, 28]. While a climate model's temperature response in future does not appear to be related to its simulation of current temperature climatology [13], its future warming does appear to be related to its simulation of past warming attributable to greenhouse gases and other anthropogenic forcings [6]. Such observational constraints indicate that the upper rates of warming simulated by some climate models are less likely than indicated by the CMIP5 ensemble of opportunity.
Acknowledgments
This work was supported by the Joint DECC/Defra Met Office Hadley Centre Climate Programme (GA01101). Support for the International ad-hoc Detection and Attribution Group (IDAG) by the US Department of Energy's Office of Science, Office of Biological and Environmental Research grant DE-SC0004956 and the National Oceanic and Atmospheric Administration's Climate Program Office is acknowledged. EH was funded by the UK Natural Environment Research Council and the National Centre for Atmospheric Science. We wish to thank all the many scientists who participated in the CMIP5 experiments and especially to Karl Taylor of PCMDI for his leadership of CMIP5. Finally we wish to thank the two referees of this paper for their careful and insightful reviews that helped improve the paper.