

Abstract
Agricultural phosphorus (P) use is intricately linked to food security and water quality. Globalization of agricultural systems and changing diets clearly alter these relationships, yet their specific influence on non-renewable P reserves is less certain. We assessed P fertilizer used for production of food crops, livestock and biofuels in the US agricultural system, explicitly comparing the domestic P use required for US food consumption to the P use embodied in the production of US food imports and exports. By far the largest demand for P fertilizer throughout the US agricultural system was for feed and livestock production (56% of total P fertilizer use, including that for traded commodities). As little as 8% of the total mineral P inputs to US domestic agriculture in 2007 (1905 Gg P) was consumed in US diets in the same year, while larger fractions may have been retained in agricultural soils (28%), associated with different post-harvest losses (40%) or with biofuel refining (10%). One quarter of all P fertilizer used in the US was linked to export production, primarily crops, driving a large net P flux out of the country (338 Gg P). However, US meat consumption relied considerably on P fertilizer use in other countries to produce red meat imports. Changes in domestic farm management and consumer waste could together reduce the P fertilizer required for US food consumption by half, which is comparable to the P fertilizer reduction attainable by cutting domestic meat consumption (44%). US export-oriented agriculture, domestic post-harvest P losses and global demand for meat may ultimately have an important influence on the lifespan of US phosphate rock reserves.
Export citation and abstract BibTeX RIS

Content from this work may be used under the terms of the Creative Commons Attribution-NonCommercial-ShareAlike 3.0 licence. Any further distribution of this work must maintain attribution to the author(s) and the title of the work, journal citation and DOI.
1. Introduction
Agricultural phosphorus (P) use has multiple agronomic, environmental and economic dimensions that are central to both agricultural productivity and sustainability [1]. Growth in P fertilizer use has been an important component of improving agricultural production [2], particularly in the US, where yields for many crops are among the highest in the world [3]. However, changes in the agricultural sector, especially more intensive crop and livestock production, have resulted in sustained large P surpluses in many key producing countries [4, 5]. Long-term agricultural P surpluses pose difficulties for regulation of surface water quality [6] that has major economic costs in the US [7]. For example, P runoff from agricultural lands is an important driver of hypoxia in the Gulf of Mexico [8].
Modern agriculture is ultimately dependent on inputs of mineral P, a key plant nutrient derived from finite supplies of phosphate rock that have no substitute [9, 10]. Rising meat consumption, population growth and continued diversion of crops to biofuel use pose additional pressures for managing these reserves [11–13]. At the same time, the food system is subject to large P losses between the farm and consumer [14–16]. These losses of mineral P inputs represent potential waste of an essential non-renewable resource, often with presently limited opportunity for recovery [9]. Together, these issues raise serious concerns about future costs or access to P fertilizers [9], although global depletion rates are subject to considerable uncertainty [13].
Food production is becoming progressively globalized, increasing the distance between locations of food production and consumption [17, 18]. For example, almost 7.5% of total global biomass extracted in 2000 was ultimately exported [19], while 19% of global water use was linked to exported commodities [20]. Agricultural trade can concentrate negative environmental externalities sometimes associated with food production in exporting regions [21]. In turn, nutrients introduced via trade to importing regions can be difficult to recycle, such as in Japan and the Netherlands, where >40% of manure P inputs and associated soil P surpluses are derived from imported feeds [5]. This situation is exacerbated by growing trade in food, feed and animal products. However, previous national P budget studies have typically only given basic treatment to the role of trade on recovery of mineral P inputs from farm to food [22], despite potentially large linkages across national boundaries [5].
Physical movement of P contained in traded agricultural commodities has the potential to vastly alter P fluxes between regions [23, 24] due to limited mobility of P in the biosphere [10]. Yet, the indirect, or 'embodied', component of P fertilizer use needed to produce traded goods may have even greater implications for both the agronomic and environmental dimensions of managing non-renewable P supplies [5, 14]. The importance of incorporating the resource flows embodied in the production of traded commodities has been established for the carbon and nitrogen cycles [25–27], as well as for water footprints of agricultural commodities [20].
Given the role of the US as a leading agricultural producer and consumer globally, explicit consideration of the implications of US agricultural trade for managing domestic supplies of non-renewable P is needed. The US produces and consumes a large share of global agricultural production, is a leading exporter of many staple agricultural commodities [28], and the largest net exporter of biomass globally [18]. The US is also the largest manufacturer and exporter of inorganic P fertilizers [29, 30], and the third largest consumer of P fertilizers with about 10% of the global P fertilizer consumption in 2007 [31]. However, disparities in the locations of remaining phosphate rock reserves globally [1] mean that it is both producing and consuming P fertilizers at a high rate relative to its own reserves.
We investigated P fertilizer use in the US at the interface between trade, biofuel production and diets given the context of limited national phosphate rock reserves and environmental concerns. We consider P fertilizer used for specific commodities throughout major components of the US agricultural system, including domestic or foreign production and consumption, thereby expanding on a more aggregate national P budget model for the US by Suh and Yee [15]. Using detailed commodity-specific national and international data, we examined three questions: (1) how is P use allocated to the production of specific commodities within the US agricultural system? (2) How does this distribution influence the fate of mineral P inputs from agricultural soils to the consumer level? (3) What magnitude of these P flows are linked to international agricultural trade? Finally, we discuss opportunities to mitigate excess P fertilizer use based on quantitative scenarios.
2. Methods
Our model tracks P flows through major components of the US agricultural system domestically and abroad. We compared the magnitude of P flows related to US production for domestic consumption, US production of foreign exports and foreign production of US imports. To do this, we determined: (1) the quantities of more than 50 crops produced domestically or in other countries for use as food, feed or biofuels within the US and countries receiving US exports; (2) the P flows required to produce crops and livestock for domestic consumption or export, as well as the P flows required to produce foreign imports to the US; and (3) the quantity of P consumed in US diets after factoring major domestic losses. The fraction of the total supply of each crop that was imported, exported or used domestically for food, feed or biofuel was determined from US Department of Agriculture (USDA) and United Nations Food and Agriculture Organization (FAO) data for 2007. We also determined how much of each commodity was subject to major forms of processing wherever processed forms were reported or implied by USDA or FAO data (e.g., trimmed meats, milled grains, flour, canned goods, juices, feed meal, gluten and oils). P use for biofuel includes corn ethanol and soybean biodiesel only and incorporates dry distillers grains (a major co-product of ethanol refining). Other by-products were grouped with processed food and feed crops as appropriate. An overview of data sources and methodology is provided in table 1 and details can be found in the supporting information text (SI; available at stacks.iop.org/ERL/7/044024/mmedia).
Table 1. Overview of data sources and methodology.
| Agricultural system component | Primary sources | Methodology |
|---|---|---|
| Crop and livestock inventories | ||
| Crop and forage production | [29, 34] | Used census of agriculture mass and yields for all major crops and FAO data for additional minor US crops or foreign imports |
| Livestock production | [34, 35, 52, 54] | Used census of agriculture inventories (cattle, poultry, sheep, pigs and horses) and breakdowns of US cattle classes from annual surveys. Back-calculated livestock animals associated with foreign imports based on pre-slaughter weights per animal |
| Soil P balances and P inputs/outputs | ||
| Fertilizer use by crop | [31–33, 73, 74] | Based on USDA and IFA reports for corn, wheat, soybean, cotton, rice and sugar. Disaggregated total IFA fertilizer use for major crop groups using circa year 2000 crop-specific application rates. Estimated US hay/silage and pasture totals from USDA data |
| Total manure produced | [36–38, 55] | Multiplied livestock inventories by manure P production coefficients for US livestock types (for domestic production) and by average factors across OECD countries (for imports) |
| Manure application to cropland or pasture | [5, 37] | Estimated based on US national average manure recovery for cropland application (domestic production) and assuming 50% or 75% cropland versus pasture application for either transitional or developed countries, respectively, for imports |
| P removal in harvested crops and forage | [40] | Calculated crop P removal from national crop production and P content of the harvested portion (dry-matter adjusted, per crop). Grazing P removal assumed to equal 22 kg P ha−1 of pasture |
| Livestock P intake and feed sources | [47, 56] | P intake estimated as total annual manure P production, P content of animal bodies and P in milk or eggs produced; rations are from USDA feed:forage (domestic) and Canadian feed:forage (imports) |
| Crop supply, use, and trade | ||
| Food/feed/biofuel uses of crops; level of processing | [29, 47, 50] | Based on USDA supply and use tables or FAO food balance sheets (proportion of national crop supply for each end use). Detailed US estimates obtained from additional USDA sources |
| Crops imported and exported | [29, 47, 50, 51] | Traded fractions of crops were determined from supply and use data, or USDA/FAO trade databases for processed commodities; sourced to major trading partner countries (≥5% of total per crop) |
| Livestock products imported and exported | [51, 52] | Applied a USDA trade database indicating mass traded for each product with additional estimates of major source or destination countries for each trade category (≥5% of trade for each livestock product) |
| Phosphate rock and fertilizer trade | [30] | Used USDA fertilizer trade data with source/destination countries |
| US diets and food nutrient contents | ||
| Supply chain losses and consumer food waste | [44, 50, 54] | USDA total food loss adjustments applied to primary and processed food crops and slaughtered livestock (including primary to retail, retail and consumer waste). Assumed 4% feed crop spoilage |
| Nutritional content of major foods | [57] | Applied USDA phosphorus, kilo-calorie and protein contents of major food commodities multiplied by loss-adjusted production |
2.1. P inputs to domestic agricultural soils and livestock systems
We estimated P inputs and outputs for the production of 6 major crops, each comprising more than 5% of national production, and 47 minor crops for which data were available in order to account for as much of the national P budget as possible. Manure P production data and P outputs associated with feed crops and pasture were used to estimate the P required to produce US livestock and how much of this P was potentially recycled to agricultural lands. We calculated soil P balances for each crop as the difference between P inputs (fertilizer plus manure applied) and P outputs (crop harvest uptake and removal). We also calculated national soil P balances for all agricultural lands, which incorporated manure P deposited on pastures as an additional input, as well as additional outputs related to P uptake by pasture-grazed livestock and P removal in crop residues used as livestock feed.
A single comprehensive source of US fertilizer application to individual crops was unavailable for 2007, so we compiled P fertilizer rate estimates from several sources. National P fertilizer applications were directly available for some crops from the USDA [32] (corn, soybean, cotton and wheat) and from the International Fertilizer Industry Association [31] (rice and sugar crops). Recent national P fertilizer applications for other individual crops were not reported, so we disaggregated total national P fertilizer use for crop groups (i.e., fruits and vegetables, other oilseeds and other cereals) [31] to individual crops within each group using the most recent source of crop-specific P fertilizer rates available [33]. A detailed description of data and assumptions regarding P fertilizer application to silage corn, hay, and pasture is provided in the SI text (available at stacks.iop.org/ERL/7/044024/mmedia).
Manure P use was estimated based on detailed livestock inventories [34, 35] and national manure management data. Manure P production was calculated using inventories for 14 livestock classes multiplied by annual manure P excretion factors for US livestock [36–38]. Manure collected on farms for cropland application was estimated using livestock-specific fractions for manure recovery from housed animals, including subsequent 15% losses on farms following the estimate of Kellogg et al [37]. We assumed that the remaining manure was deposited on pastures (for ruminants) or lost elsewhere on farms (poultry and pigs). Manure application to specific crops was then estimated using national farm survey estimates [39] reported for 8 major field crops (72% of the total applications), hay crops (26%), and distributed among remaining crops weighted by P uptake (1.7%). To determine P uptake and removal for each crop nationally, we multiplied the typical dry-matter P content for the harvested portions [40] by crop-specific production data [34].
In order to determine how much P was required to produce US livestock and how this relates to national soil P balances, we estimated the relative quantities of different feeds consumed by each major livestock class. First, total P intake by livestock class was estimated as manure P excreted plus the amount of P stored in livestock bodies and yielded in products [41], which we determined from average lifetime weights [42] and annual egg or milk production per animal [43]. We assumed that all feed crops, silage and hay were fed to livestock in the US, but subtracted 4% from the total to account for crop spoilage [44] and adjusted feed supplies to account for imports and exports if necessary. P intake from alternative sources was estimated based on industry data for mineral feed P supplement use [45], estimates of dry distillers grain ethanol co-product feed use [46], reported use of animal by-product protein feeds [47], and approximate crop residue availability from 17 major US feedstocks for which widespread residue collection was plausible [48, 49] (detailed in the SI text available at stacks.iop.org/ERL/7/044024/mmedia). Remaining P intake was assumed to be met by pasture grazing. Finally, to distinguish how much of the total P intake for different livestock products was associated with fertilizer use for pasture versus feed or other forages, we used data on the fraction of grain or roughage in diets for seven livestock classes [47]. We then used the ratio of P available nationally from forage crops (hay and silage feeds) to P from pasture grazing to further break down the P fertilizer use associated with roughage intake by livestock class.
2.2. Cross-border P flux in traded products
We calculated the flux of P into and out of the US in imported and exported crops based on traded quantities of whole crops or major processed crop commodities (e.g., wheat grain or wheat flour) [47, 50, 51] and product specific P contents. Imports and exports of live animals, meat and dairy were obtained from USDA trade data, with imports adjusted for re-export (i.e., subsequent export of imported commodities, possibly after processing) [51, 52]. Fertilizer trade statistics were used to calculate the P contained in traded phosphate rock and fertilizers, assuming standard phosphate contents of fertilizer mixtures [30] and that phosphate rock contains 14% elemental P [53].
2.3. P flows embodied in US export production for foreign consumption
We determined the magnitude of domestic P flows attributable to US agricultural export production by calculating the overall fraction of each crop or livestock category exported based on production and trade data (table 1). For livestock, we used these fractions to estimate the net fertilizer, manure and crop P uptake required nationally to produce the overall quantity of livestock products exported. To associate exported crops with overall fertilizer use for either food, feed or biofuel production, we calculated the fraction of each crop used for each of these purposes for all countries receiving ≥5% of the exported mass of a given crop based on FAO [29] trade totals.
2.4. Foreign P flows embodied in production of US imports
We calculated the P fertilizer used abroad and the P balances associated with production of each crop product imported to the US for domestic consumption. For each crop and each major source country, we determined how much P fertilizer was applied based on crop yields [29], P fertilizer application rates for individual crops [33] and crop P contents. These calculations were weighted according to the share of imports originating from each country accounting for ≥5% of the US imports of a given crop.
To estimate how much P fertilizer was applied to grow feeds consumed by livestock for animal products imported to the US, we first calculated the number of live animals required to produce the mass of imported products using conversion factors [52, 54], as well as the approximate sources of feed intake for these animals. Annual manure P production and P intake were estimated following the same method as US livestock, but using average manure P excretion and live animal weights for OECD countries to determine how much P was stored in animal bodies [54, 55]. To relate the feed consumed by imported livestock to foreign fertilizer use, we used data from Statistics Canada [56] indicating the relative fraction of intake from grains, forages and non-grain feeds, as Canada was by far the greatest source of livestock product imports to the US (i.e., the largest single source of cattle products and the origin of >75% of all pig, poultry and sheep imports). P fertilizer applied to these feed sources was then estimated, as above, for each source country accounting for ≥5% of livestock imports for each product. Application of manure P to either cropland or pasture by animals associated with imported livestock products was estimated following the basic method of Schipanski and Bennett [5] (as described in the SI text available at stacks.iop.org/ERL/7/044024/mmedia).
To assess the influence of embodied P use for traded commodities on soil balances within the US and trading partner countries, we calculated soil P use efficiencies for exported crops (PUE; crop P removed per unit of P input [5], expressed as a percentage) and soil P balances for traded commodities (net P inputs minus net P outputs associated with imports or exports).
2.5. P fertilizer requirements for US food and alternative scenarios for 2007
After estimating how much P fertilizer was used to produce different commodities within the US or in import source countries, we determined how much P was ultimately consumed in domestic diets after losses. As an alternative metric, we also estimated US consumption of kilo-calories and protein in each food crop and livestock product using standard USDA food nutrient contents [57] (additional sources in the SI text available at stacks.iop.org/ERL/7/044024/mmedia). Meat available for consumption was estimated from national livestock slaughter inventories [58], accounting for livestock exports. Because processing (e.g., de-hulling, milling or canning of crops, and trimming of livestock) could alter the nutrients available from the primary commodity (harvested crops or livestock on farms) [59], we estimated apparent processing losses as the difference in weights and P contents between the root commodity and its associated processed commodities reported from food supply data [50, 54]. Finally, food loss estimates at the retail to consumer level from the USDA [50] for individual food crop and animal products (or product groups) were applied to determine total nutrient consumption in foods within the US domestic supply.
We examined three dimensions of P fertilizer used to produce food (kg of P fertilizer per unit of consumption) in terms of kg of dietary P, million kilo-calories and kg of protein consumed after losses. These estimates exclude P fertilizer used to feed breeding animals. Because beef cows, sheep and goats typically require multiple years of feed prior to being consumed as meat, we included conservative adjustments for the fertilizer used during the life-cycle of these animals equivalent to ∼2 yr (detailed in the SI text available at stacks.iop.org/ERL/7/044024/mmedia).
Finally, we used our model to compare the relative amount of P fertilizer used for domestic consumption (including that embodied in imports but excluding export production) under a series of hypothetical alternative scenarios for 2007. These scenarios illustrate opportunities to reduce P fertilizer use based on supply-side (farm level) or demand-side (consumer level) changes and also serve to indicate the sensitivity of our results to changes in underlying factors.
3. Results
Our results show that only 8% of the total mineral P fertilizer and livestock feed supplements used in the US was consumed in food domestically during 2007 (figure 1). Much of the remaining P may have accumulated in agricultural soils (28%), been lost on farms as unused manure or through feed spoilage (13%), or potentially lost off farms through processing and food waste (27%). A further 10% of the total P inputs were embedded in grains used for biofuels, while 21% were contained in US agricultural exports shipped to other countries. However, the quantity of P fertilizer consumed in US diets (9 kg P kg−1) is sensitive to changes in crop-specific P fertilization, the degree of manure recycling on farms and consumer food waste (table 2).
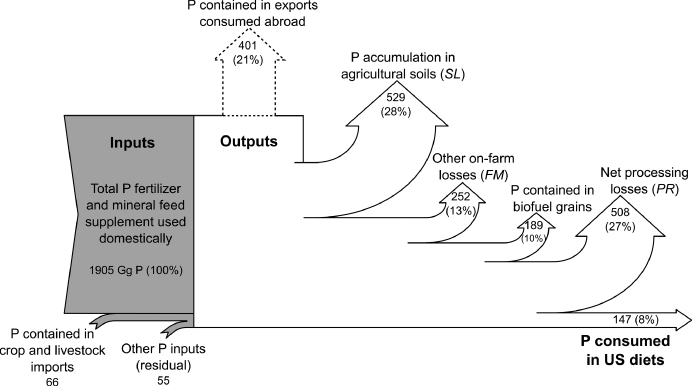
Figure 1. The fate of domestic mineral P inputs (fertilizer and feed supplements) in the US agricultural system in 2007. Some P outputs within the US domestic system could be recycled, such as uptake of accumulated P in future crop harvests or use of biofuel co-products as livestock feed (see figure 2).
Download figure:
Standard imageTable 2. Hypothetical scenarios illustrating the effects of different changes on overall P fertilizer application to food and feed crops consumed in the US in 2007. The fertilizer use changes (+/− Gg P) include those embodied in imports as well as US domestic use, but exclude the fraction of P fertilizer applied to US exports. The total mineral P fertilizer ultimately recovered in diets (kg P fertilizer used/kg P consumed in food) is indicated for the 2007 baseline and each alternative scenario holding all other variables constant.
| Scenario | Food crop P fertilizer applied | Feed crop P fertilizer applied | P fertilizer consumed in food (kg P kg−1) | Description |
|---|---|---|---|---|
| 2007 baseline | 489 | 897 | 9.4 | |
| Scenario 1 (S1) —Balanced P nationally | −146 | −173 | 7.2 | National P fertilizer application is reduced for crops with overall surpluses and increased for crops with deficits until all crops have net zero P balances; assumption of no change in manure P |
| Scenario 2 (S2) —Complete recycling of manure | −28 | −124 | 8.6 | 100% capture of manure on farms and no losses during transportation. Additional manure P is applied to feed and food crops in proportion with 2007 applications, with a matching reduction in P fertilizer use based on assumption of equivalent P fertilizer value to inorganic fertilizers |
| Scenario 3 (S3) —Substantial reduction in food waste | −53 | −225 | 7.5 | Total per capita demand for food is reduced via 20% reduction in food crop waste (no change in kilo-calories consumed) and 32% reduction in livestock product waste (no change in protein consumed). These are common USDA total consumer level food loss estimates for grains and meats |
| Scenario 4 (S4) —More poultry, less beef | No change | −65 | 9.0 | 20% of beef protein is replaced by poultry protein [72]. Change in mineral P feed supplements not included (if included, an additional ∼14 Gg mineral P use would be needed for added poultry) |
| Scenario 5 (S5) —Lacto-ovo diets | +126 | −742 | 5.2 | All meat consumption replaced with protein from mix of grain, dairy, eggs, legumes/nuts, fruits and vegetables; protein replacement is proportional to current per capita protein sources (USDA) from these foods. Accounts for conservative life-cycle fertilizer use for beef, but assumes no net P fertilizer loss to food crops due to a decrease in manure applications of ∼520 Gg P yr−1 |
3.1. P inputs to domestic agricultural soils and livestock systems
More than half of the mineral P used in the US was devoted to feed and livestock production, largely to produce meat for domestic consumption and corn or soybean exports (figure 2). Overall fertilizer application to feed crops (859 Gg P) was 42% greater than that applied to food crops (605 Gg P) as a result of the large allocation of crops to livestock production. Feed crops and pasture also received considerably more manure P inputs than other croplands (87% of the 1466 Gg P total) and had the greatest overall P uptake via crop harvest and grazing. Domestic P fertilizer application for biofuels was almost entirely destined to produce corn ethanol (196 Gg) and was comparable to the magnitude of mineral P used as livestock feed supplements (193 Gg). However, much of the P used to grow corn for ethanol was ultimately consumed by livestock in dry distillers grain co-product feeds (115 Gg P).
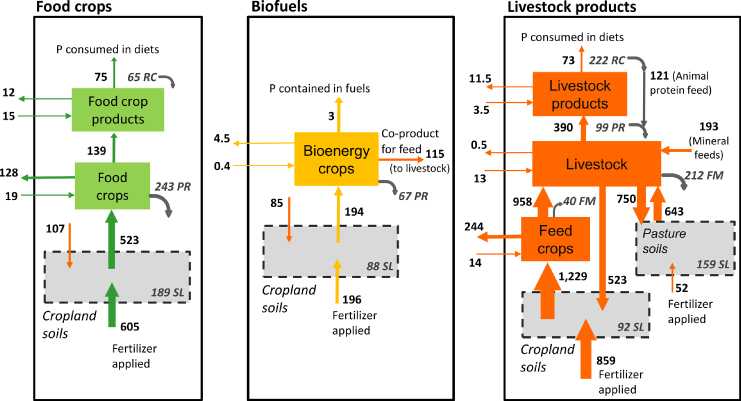
Figure 2. Detailed breakdown of all P inputs, outputs, losses and cross-border P fluxes (Gg of P) associated with US domestic agricultural production and trade in 2007. Arrows crossing the solid rectangles represent the P contained in foreign trade. Apparent losses at each stage (shown in gray italics) include soil P balances (SL), other on-farm losses (FM), apparent processing losses (PR) and retail to consumer food waste estimates (RC). Feed crop P removal from soils includes estimates of crop residues used as livestock forage (∼60 Gg P) [48].
Download figure:
Standard imageUS agricultural soils had an overall P surplus (529 Gg across croplands and pasture). The cropland P balance was on average 3.5 kg P ha−1 nationally when weighted according to the harvested area of each crop, but varied greatly among crops (simple average of 18.0 kg P ha−1 with a standard deviation of 25.0 kg P ha−1: see table S1 (available at stacks.iop.org/ERL/7/044024/mmedia) for a detailed breakdown). Three major crops disproportionately affected the national soil P balance: corn (surplus of 437 Gg P) and soybean (deficit of 219 Gg P) for feeds and biofuels, and wheat (surplus of 84 Gg P) for food crops.
The P available for human consumption nationally was greatly reduced as a result of various losses, including spoilage of feed crops (40 Gg P), uncollected manure on farms (212 Gg P) and by-product losses from food crop processing (243 Gg P). Two-fifths of the P lost during livestock slaughter and at the retail level was returned to livestock as by-product animal protein feed (121 Gg). Although actual biofuels contained little P (at most ∼3 Gg), the P embedded in crops used for fuel refining further limited the amount of P consumed in human diets even after accounting for major co-products. However, omitting consumer level or overall retail to consumer food waste (287 Gg P), ∼13–27% of total mineral P inputs were available for human consumption in the US, respectively, highlighting the sensitivity of dietary P intake to uncertainties about food waste.
3.2. Cross-border P flux in traded products
Phosphate rock and fertilizer trade drove a large P flux directly between the US and other countries. A total of 540 Gg P was imported to the US in fertilizers, approximately half of which was phosphate rock from Morocco; 1589 Gg P was exported, of which 98% was in processed mineral fertilizes. Most of this fertilizer was destined for India (41%).
The largest share of the P contained in traded agricultural commodities moving into and out of the US was associated with crop exports (128 and 244 Gg for food and feed, respectively). Food crop exports were dominated by wheat destined for Japan, Egypt, Nigeria, Mexico and several other countries. Feed crops exports were dominated by corn (40% of which went to Japan and Mexico) and soybean (47% of which went to China). Livestock product imports to the US (mostly live animals) contained only 17 Gg P, while 12 Gg P was exported (mostly in meat products).
3.3. P flows embodied in US export production for foreign consumption
One quarter (25%) of US domestic P fertilizer use was allocated to the production of exports (figure 3). This P use was predominantly linked to the production of US crop exports, which comprised 85% of the export P fertilizer use, split among food (167 Gg P) and feed crops (126 Gg P). US livestock exports required 62 Gg of P fertilizer (14% of the total use for exports), while use for biofuel exports was unsubstantial (<1%). Poultry required the largest share of P fertilizer use for livestock exports (43% of embodied P use for livestock), destined mostly for consumption in Russia, Mexico, and China (52%). P fertilizer use embodied in pork exports accounted for 24% of the total (largely for Japan and Mexico), while beef accounted for the remaining 19% (for Mexico, Canada and Japan).
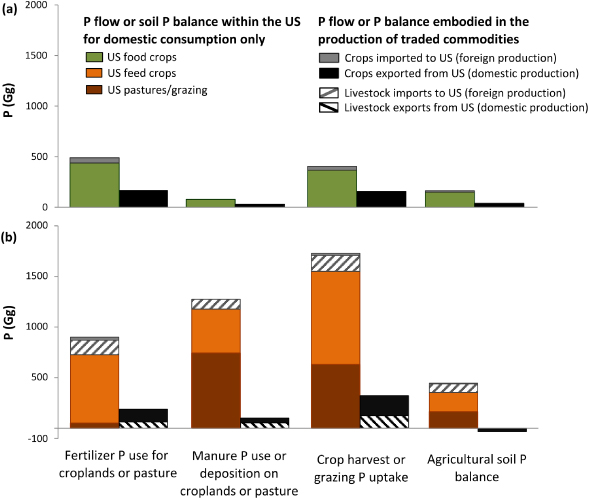
Figure 3. Comparison of the P flows associated with production of food crops (a), feeds and livestock commodities (b) in the US agricultural system. The bars to the left of each term show the P flows required for US consumption (domestic production plus those associated with foreign imports); the bars to the right show P flows required for production of US exports consumed abroad. P flows embodied in production of imports and exports are shown in gray and black boxes, respectively.
Download figure:
Standard image3.4. Foreign P flows embodied in production of US imports
Of the total P fertilizer used to produce food consumed in the US in 2007 (≈1386 Gg), 16% was applied in other countries to produce various commodities imported to the US (figure 3). About 10% of total P fertilizer use required for US domestic food consumption was associated with imported livestock (144 Gg), representing one-sixth of the 897 Gg of P fertilizer required for US consumption of livestock products. Pig and beef imports accounted for 82% of the embodied P fertilizer use in foreign countries to produce these livestock imports, predominantly Canada and Australia (73%).
3.5. Relative contribution of trade versus domestic P flows
The US was a substantial net exporter of mineral P in 2007 (figure 5). The total P required to produce traded crop and livestock products was roughly 40% greater for US exports than for US imports (table 3), but the P subsequently contained in shipped products was roughly 85% greater for US exports. Direct export of P fertilizers exceeded all other trade-related flows combined. The P flux in exported fertilizer was even slightly greater than the entire mineral P used in the US for domestic consumption.
Table 3. Comparison of P fertilizer use associated with different locations of production and consumption of agricultural commodities within the US agricultural system. Breakdowns for US domestic P fertilizer contribution by crop exclude P fertilizer use for feeds to avoid possible double counting (e.g., corn fed to beef cows).
| System component | Gg of P fertilizer used (2007) | % of total P fertilizer use | Largest overall contributors (% of row total) |
|---|---|---|---|
| US production for US consumption (domestic only) | 1355 | 70 | Beef (30%), corn (22%), poultry (15%) and wheat (11%) |
| US production for foreign consumption (exports) | 358 | 18 | Corn (30%), wheat (25%), soybean (16%) and poultry (9%) |
| Foreign production for US consumption (imports) | 228 | 12 | Beef (29%), pork (23%), wheat/corn/canola (18%) and poultry (6%) |
| Total US agricultural system (domestic consumption, exports, and imports) | 1941 | 100 |
Agricultural soil P balances associated with US import and export production differed considerably (figure 3). Of the total cropland P surplus in the entire US agricultural system, 16% occurred in countries producing US imports (predominantly due to red meat production, i.e., beef, pork and other ruminants), while 84% occurred domestically (figure S1 available at stacks.iop.org/ERL/7/044024/mmedia). The net P surplus in the US due to export production was a relatively smaller fraction of the domestic P surplus (∼5%) due to underlying differences in the P balance of exported food crops (surplus of 39 Gg P) relative to livestock and feed exports (deficit of 10 Gg P) (table S2 available at stacks.iop.org/ERL/7/044024/mmedia). This disparity relates to vast differences in the PUEs of exported crops and their relative allocation to food or feed uses (e.g., wheat versus soybean) (figure 4; table S1 available at stacks.iop.org/ERL/7/044024/mmedia).
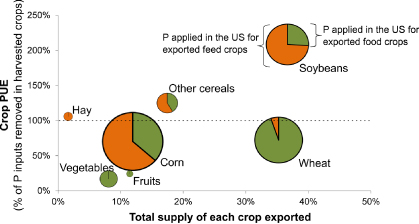
Figure 4. Soil phosphorus use efficiencies (PUEs) for food and feed crops produced in the US relative to the total supply of each crop exported in 2007. PUE is expressed as the per cent of total P fertilizer and manure applied that was removed from cropland soils during crop harvest. The size of the bubbles indicates the relative amount of P fertilizer and manure applied to each exported crop, with colors representing the fraction of each crop used for food or feed in major destination countries. Note that including embodied feed use for livestock exports increases the export fractions from 5 to 10% depending on the crop.
Download figure:
Standard image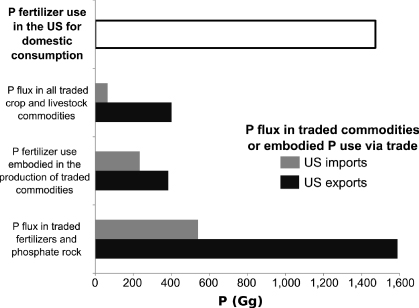
Figure 5. Comparison of the overall magnitude of P flows associated with different components of international trade for the US agricultural system in 2007. The embodied P and domestic P fertilizer use totals include the contribution of mineral P supplements fed to livestock.
Download figure:
Standard image3.6. P fertilizer requirements for US food consumption
The quantity of P fertilizer used domestically or abroad to produce food consumed in the US differed greatly among commodities (figure 6). About 56% of the P fertilizer requirement for US food was for livestock products, with the greatest share for red meat that also had much higher reliance on embodied P fertilizer use abroad to produce imports (37%). Poultry had relatively lower P demands per unit of protein consumed despite comparable caloric returns to beef, as well as a much lower reliance on foreign P fertilizer use for imports (7%). Fruit and other cereals had relatively low contributions to total P fertilizer use, but higher reliance on embodied P fertilizer imports (24–28%).
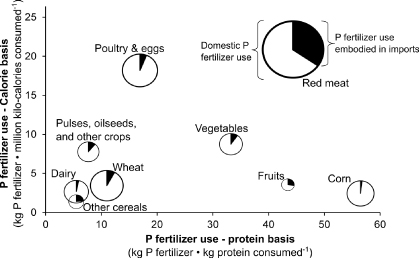
Figure 6. P fertilizer use associated with different foods consumed in the US expressed per unit nutritional returns (protein versus kilo-calories). The relative share of the total P fertilizer use embodied in foreign imports is indicated in black, with the US domestic share indicated in white (including life-cycle estimates for cattle and other ruminants). The size of the bubbles depicts the total P fertilizer used to produce each commodity. See table S3 (available at stacks.iop.org/ERL/7/044024/mmedia) for P fertilizer use expressed in terms of the P eventually consumed in human diets.
Download figure:
Standard imageThe P fertilizer used per unit of P consumed in different foods reveals strong differences in food system P losses among major food crops in the US (table S3 available at stacks.iop.org/ERL/7/044024/mmedia). For example, corn products had dietary P requirements comparable to poultry (>20 kg P/kg P consumed) and much higher than wheat (6 kg P/kg P consumed). This reflects the products derived from corn (e.g., high-fructose corn syrup) and the larger domestic P surplus for corn (12 kg P ha−1) versus wheat (4 kg P ha−1).
3.7. Scenarios of national fertilizer reduction
Major reductions in national P fertilizer use could be achieved via changes to farm management, food waste mitigation, or domestic dietary shifts (table 2). Balancing P inputs and outputs on a crop-by-crop basis nationally (scenario 1; S1) would result in a 23% decrease in P fertilizer use, largely from reducing fertilizer P for corn, wheat, cotton and potato. Similarly, a 20% decrease in P fertilizer use could be achieved if consumer food waste was dramatically reduced (S3), and, as a result, overall food demand was lowered. Improved recycling of manure P as an organic fertilizer source could reduce P fertilizer use by a further 11% (S2). These management changes could therefore together reduce P fertilizer applications in the US agricultural system by as much as half. In comparison, a shift to lacto-ovo vegetarian diets would reduce P fertilizer use by 44% (S5) despite increased P fertilizer use for food crops to provide equivalent protein availability (∼126 Gg P). A less dramatic change, where 20% of beef protein is replaced with poultry protein (S4), would reduce P fertilizer use by ∼5%.
4. Discussion
Agricultural P use and the magnitude of P losses within the US agricultural system are tightly linked to domestic meat consumption and the export-oriented nature of US crop production. In 2007, mineral P use throughout the agricultural system was disproportionately allocated to production of a relatively small number of commodities, specifically beef, corn, poultry, wheat and soybean (table 3). US meat consumption had substantially higher P fertilizer requirements both domestically and via foreign imports, with considerably greater P losses per kilo-calorie consumed compared to all other foods (e.g., [3]). Allocation of domestic mineral P fertilizer to produce corn ethanol in 2007 considerably exceeded the 2% allocation of P fertilizers for first-generation biofuels globally [11], as well as the P fertilizer used to produce any major food crop except wheat. Collectively, production of US imports and exports entailed 30% of the total system-wide P fertilizer use (table 3), underlining the influence of trade on national P budgets [14].
4.1. Accounting for trade
Total P fertilizer use embodied in US export production was 37% greater than that required to produce US imports, which augmented the role of the US as a major net exporter of mineral P to other countries. A sizable fraction of the total P fertilizer applied to grow crops in the US was ultimately shipped in traded products going to other countries. This was particularly due to the high PUE of soybean and moderate PUE of wheat, as 35–37% of the supply of these crops was exported (figure 4). The US was a net importer of P fertilizer embodied in foreign production of several minor crops ultimately consumed in the US (e.g., canola, oats and grapes); yet, P flows associated with US foreign imports were overwhelmingly driven by cattle and pigs, which are P-intensive during production but contain relatively little P as finished products [5]. The US can therefore be seen as specializing in the export of major high-yielding crops (e.g., corn, wheat and soybeans) that consume a considerable amount of domestic P fertilizer and ultimately transfer this mineral P abroad. The effect of exporting large quantities of a few major crops on depletion of domestic phosphate rock reserves may not yet be internalized in the economic cost of these commodities. At the same time, some potential P losses associated with domestic red meat consumption may be externalized to other countries as a result of livestock product imports. Our study does not consider P use for some tropical products, such as coffee, which may slightly underestimate the P fertilizer embodied in US imports.
Agricultural trade could help to increase the efficiency of mineral P use among linked national agricultural systems but can also create a barrier for domestic P recycling. For example, Schipanski and Bennett [5] found that countries tend to import crops from trading partners with higher PUE, meaning that trade has the potential to increase P use efficiency globally. This tendency toward trade in P-efficient commodities may be apparent to some degree in our results. For example, US specialization in exports of high-PUE soybean, and the relative degree to which poultry with lower P requirements are exported from the US and beef with higher P requirements are imported, could be viewed as advantageous from a P-efficiency perspective. While export of P contained in traded crops could reduce soil P surpluses, it may also exacerbate the difficulty of P recycling on farms domestically and possibly contributes to P losses in importing countries due to limited ability to recycle manure P from imported feed [5] or waste from human populations [60]. On the other hand, direct export of P fertilizers from the US bypasses domestic agriculture altogether and limits the possibility to recuperate this P for future use. Greater emphasis on export of a more diverse mix of crops or reducing exports of relatively higher P-content crops such as soybean could therefore help to mitigate P flux out of the US domestic system. Because production subsidies may encourage export growth for some major crops (e.g., corn), Grote et al [24] propose that reducing agricultural subsidies could help to lessen the disproportionate allocation of nutrient use to producing traded commodities by decreasing export demand.
4.2. Leveraging P use in US agriculture
Reducing domestic food waste may be of equal importance to mitigating excess P use as farm-level nutrient management. Our finding that just 8% of mineral P inputs were consumed in US diets is explained by high meat consumption, P loss during processing and potential consumer food waste typical of some developed countries [59, 60]. These factors mean that roughly as much P may enter waste streams post-harvest as that which accumulates in agricultural soils domestically (figure 1). Parfitt et al [59] found that 61–82% of total consumer level food waste in the UK is potentially avoidable, with factors such as better meal planning and improved consumer education about food waste being important elements for shifting consumer behavior. Alternatively, household food losses could be recycled to agricultural lands as an organic fertilizer source in greater quantities, which is currently done for ∼2.5% of US household waste [15]. While our calculations include by-products from major crops used as animal feed [47], other national by-product uses of crops are more uncertain (e.g., some P-containing effluent from biofuel refining may be recycled [61]). Accounting for these waste stream P flows will be important for understanding the potential for new technologies to recuperate P losses for reuse in the food system [22].
P imbalances within certain sub-regions [8, 62] may have a substantial cumulative effect nationally. Cropland P surpluses for corn and wheat strongly influenced the domestic P balance, particularly due to disproportionate manure recycling to corn. Some recuperation of this surplus P in future crop harvests is likely as corn–soybean rotations common to the US Corn Belt [63] facilitate inter-annual coordination in fertilization of crops, which may also compensate for the soybean P deficit nationally in 2007 [32, 39]. Nonetheless, addressing these P surpluses will help to reduce mineral P use while mitigating environmental risk [6, 8]. Improving manure recycling to croplands located at greater distances from concentrated animal production facilities would aid in reducing the effect of sub-regional P imbalances nationally given the magnitude of manure P produced by US livestock [37, 62]. Technologies such as anaerobic manure digestion and mechanical dewatering are viewed as plausible large-scale solutions to help recycle manure more effectively [64, 65].
The quantity of P fertilizer used for ethanol links US energy policy to consumption of non-renewable phosphate rock [11]. Assuming constant 2007 P fertilizer use efficiency in our model, P fertilizer use for ethanol could increase to as much as 377 Gg P under 2020 projections for corn ethanol production [70]. Co-products from the distilling process for ethanol are increasingly used as livestock feed, comprising roughly 115 Gg P of livestock feed P intake in 2007 [46]. Because these co-product feeds typically contain more than double the P concentration of corn grain (0.8–0.9% compared to 0.3–0.4% P), elevated P concentrations in manure could increase soil P levels if manure distribution or feed rations are unchanged [12]. Wider adoption of more P-efficient biofuel crops (e.g., soybean biodiesel) [66] and further livestock feed modification to minimize local manure P imbalances [38] could help to offset or avoid these increases.
5. Conclusions
Our findings confirm that meat consumption, trade, and diversion of corn to ethanol act as overarching drivers of P use in the US agricultural system. While the US was the third largest phosphate rock producer globally and the leading exporter of phosphate fertilizers (∼25% of the global total) in 2010 [67], current forecasts suggest that depletion of domestic phosphate rock reserves could occur within decades if driving factors remain constant [1, 68, 69]. Achieving more efficient use of mineral P may partly depend on underlying demand for meat and corn ethanol. The USDA projects that US livestock production will increase due to export growth (despite stabilizing per capita meat consumption), while corn used for ethanol doubled from 2007 to 2010 (2.3 to 5.1 million bushels) and is projected to rise slowly until 2020 [70]. Opportunities to reduce national P fertilizer use using strategies highlighted here could help to slow the pace of domestic phosphate rock depletion while maintaining export-oriented agriculture.
Agricultural trade has clear implications for the lifespan of US phosphate reserves because the US exports more raw mineral P fertilizers than it uses for domestic consumption, as well as crops that contain relatively large amounts of P. The export-oriented nature of US crop production could pose additional challenges for ensuring future domestic P availability. Focusing on more efficient domestic management of P and shifting production to a more diverse set of agricultural commodities could therefore vastly reduce total P fertilizer use while simultaneously helping to mitigate the effect of export crop production on mineral P reserves. At the same time, although the US imports various crops, the greatest embodied P fertilizer requirement for imports is associated with P-intensive red meat productions that may shift P losses abroad. Better accounting of these production- and consumption-side dimensions of P fertilizer use, as highlighted in our study (and for carbon emission offsets [26, 71]), could contribute to more coordinated P fertilizer use among the US and its trading partners.
Our quantitative scenarios illustrate great potential to reduce mineral P use nationally from both supply-side (farm level) and demand-side (consumer level) approaches. Various strategies could help to better integrate crop and livestock production on farms, for example decreasing the P content of livestock feeds or applying technologies such as anaerobic digestion to enable more effective manure management [17, 38, 64, 65]. Demand-side initiatives could inform consumers of the environmental implications of food waste and health issues surrounding meat consumption, while prices and subsidies of commodities that are exported or used for bioenergy could be adjusted to decrease P demand [12, 15, 66, 72]. Practical challenges of recycling manure and effectively using P in wastes may become viable if domestic P supplies are depleted while demand for P fertilizer grows [1]. Greater attention to full-system accounting of mineral P use both within and among nations will be essential as P reserves in some countries become scarcer amidst growing global economic integration.
Acknowledgments
We thank Geneviève Metson and Meagan Schipanski for helpful comments and discussions on various aspects of this research. Feedback from two anonymous reviewers improved this manuscript. The University of Wisconsin–Madison Center for Limnology hosted GKM as a visiting researcher during the early stages of this work. Funding was provided by the Natural Sciences and Engineering Research Council of Canada (NSERC) and the Fonds québécois de la recherche sur la nature et les technologies (FQRNT) to EMB and GKM and National Science Foundation (NSF) grants (NTL-LTER and WSC) to SRC.