
Abstract
The oil released during the Deepwater Horizon (DWH) oil spill may have both short- and long-time impacts on the northern Gulf of Mexico ecosystems. An understanding of how the composition and concentration of the oil are altered by weathering, including chemical, physical and biological processes, is needed to evaluate the oil toxicity and impact on the ecosystem in the northern Gulf of Mexico. This study examined petroleum hydrocarbons in oil mousse collected from the sea surface and salt marshes, and in oil deposited in sediments adjacent to the wellhead after the DWH oil spill. Oil mousses were collected at two stations (OSS and CT, located 130 and 85 km away from the wellhead, respectively) in May 2010, and two sediment samples from stations SG and SC, within 6 km of the wellhead, in May 2011. We also collected oil mousse from salt marshes at Marsh Point (MP), Mississippi, 186 km away from the wellhead in July 2010. In these samples, n-alkanes, polycyclic aromatic hydrocarbons (PAHs), alkylated PAHs, BTEX (collective name of benzene, toluene, ethylbenzene and p-, m-, and o-xylenes), C3-benzenes and trace metals were measured to examine how the oil was altered chemically. The chemical analysis indicates that the oil mousses underwent different degrees of weathering with the pattern of OSS < CT < MP. This pattern is consistent with the projected oil mousse movement from the accident site to salt marshes. Also, the contents of trace metals Al, V, Cr, Fe, Mn, Ni, Co, Cu, As and Pb in the oil mousse generally increased along the way to the salt marshes, indicating that these trace metals were perhaps aggregated into the oil mousse during the transport. Petroleum hydrocarbon data reveal that the oil deposited in sediments underwent only light to moderate degradation one year after the DWH oil spill, as supported by the presence of short-chained n-alkanes (C10–C 15), BTEX and C 3-benzenes. The weathering of oil in sediment may result from biological degradation and dissolution, evidenced by the preferential loss of mid-chained n-alkanes C16–C 27, lower ratios of n-C 17/Pr and n-C 18/Ph , and preferential loss of PAHs relative to alkylated PAHs.
Export citation and abstract BibTeX RIS

Content from this work may be used under the terms of the Creative Commons Attribution-NonCommercial-ShareAlike 3.0 licence. Any further distribution of this work must maintain attribution to the author(s) and the title of the work, journal citation and DOI.
1. Introduction
The Deepwater Horizon (DWH) oil spill occurred approximately 50 miles offshore from Louisiana, and released approximately 4.9 million barrels of oil from the Macondo well at a depth of 1500 m during the period from 20 April to 15 July 2010. Two million gallons of chemical dispersants were applied to the Gulf waters in response to the spill (Kujawinski et al 2011, Crone and Tolstoy 2010, Leifer 2010). The DWH oil spill exceeded the 1989 Exxon Valdez spill in Alaska in volume and was the second most severe marine oil disaster in history, trailing only the Persian Gulf spill during the Gulf War in 1991. The National Incident Command's Flow Rate Technical Group estimated that 25% of the oil was skimmed, burned or captured, 24% was either naturally or chemically dispersed, 25% was evaporated or dissolved, and 26% remained in the water by 4 August 2010 (Operational Science Advisory Team 2010). The oil and chemical dispersant released during the DWH spill may have both short- and long-term impacts on the northern Gulf of Mexico ecosystems.
To date, chemical and physical studies of the DWH oil spill have focused primarily on the underwater oil plume (Camilli et al 2010, Hazen et al 2010, Joye et al 2011, Kessler et al 2011) and dispersant (Kujawinski et al 2011), the evaporated atmospheric hydrocarbons (Ryerson et al 2011), the composition, distribution and mass flow rate of the hydrocarbon mixture during the initial stage of spill (Ryerson et al 2011, 2012), and the surface oil sheen, slick and mousse (Reddy et al 2011). The weathering of the oil has not been emphasized, despite its importance in providing insight for predicting and further mitigating the oil contamination after an oil spill. The toxicity of oil washed to salt marshes or deposited in sediments depends on the weathering process, which can significantly change the chemical composition of the oil.
Many literature reports document the weathering of oil in marine environments particularly after several large marine oil spills, such as Exxon Valdez in Alaska, Amoco Cadiz in Brittany and Ixtoc I in the Bay of Campeche in the Gulf of Mexico. The important weathering processes include evaporation, dissolution, biodegradation and photoxidation (e.g., Hunt 1996, Fingas 1999; Plata et al 2008). However, there are several unique aspects in the DWH oil spill. First, as typical light Louisiana crude oil, the DWH oil contained saturated n-alkanes, polycyclic aromatic hydrocarbons (PAHs) and their alkylated homologues (alkylated PAHs), with over 50% as low-molecular-weight (LMW) hydrocarbons (methane and C2–C11) (Ryerson et al 2011). The composition of light crude may result in rapid weathering in marine environments, as weathering processes such as evaporation, dissolution and biodegradation favor LMW compounds (Atlas 1995, Leahy and Colwell 1990, Stout and Wang 2007). Second, the long vertical transport of the oil during the 1500 m rise to the sea surface from the bottom site, combined with the application of dispersant, might have allowed preferential dissolution of soluble aromatic hydrocarbons in the deep waters. For example, the deepwater oil plume contained high concentrations of light aromatic hydrocarbons and n-alkanes dominated by C7–C13 n-alkanes (Gonzalez et al 2006, Diercks et al 2010, Hazen et al 2010). Third, the natural seeps in the Gulf of Mexico may make this marine system adaptable to oil degradation due to indigenous oil-degrading bacterial strains (Kniemeyer et al 2007, Joye et al 2010). Furthermore, the high water temperatures and strong solar irradiance at the sea surface in the northern Gulf may enhance oil degradation. For example, sea surface temperature in the northern Gulf of Mexico ranged from 25 to 30 °C during our cruises in May and August 2010. These unique aspects of the DWH oil spill highlight the importance of understanding how the oil was weathered after the spill in the northern Gulf of Mexico. The results should provide insights on oil toxicity, the need for mitigation in the impacted coastal areas, and the impact of the oil spill on subtropical or tropical ecosystems.
To evaluate the impact of weathering on the chemical composition of oil, we collected oil mousse from the sea surface and salt marshes, as well as oil deposited on sediments in the northern Gulf of Mexico, in 2010 and 2011. Using Macondo 252 crude oil as the reference, we measured the chemical components of these different oil samples. The components measured included n-alkanes, pristane, phytane, PAHs, BTEX and C3-benzenes. Trace metals in the oil, including Fe, Al, Mn, Co, Ni, Cu, Zn, Cr, V, As and Pb, were also measured to examine changes of metal concentrations during the oil weathering. The abundance of trace metals in crude oil provides information about oil origin and migration (All et al 1983). Terrestrial clay minerals and/or the complexes of dissolved metals may be aggregated into oil mousse during the transport from off coast to the coast. Our main objectives in this study were to: (1) examine compositional changes of oil mousse during the inshore transport; (2) evaluate the distribution and composition of oil in the deepwater sediments adjacent to the wellhead one year after the oil spill; and (3) interpret these results in terms of the degradation pattern of the oil in coastal regions after the spill.
2. Materials and methods
2.1. Materials
Chromatographic grade solvents for the analyses were purchased from either Fisher Scientific or Sigma-Aldrich (USA). Chemicals for standard calibration including n-alkane standards from C8 to C40, pristine (Pr), phytane (Ph), PAH-3 (collective name of 16 EPA priority PAHs), BTEX and alkylbenzenes with the alkyl groups ranging from C1 to C3 were purchased from Sigma-Aldrich, except for the alkylated PAH standard (SRM 1491a) which was obtained from the National Institute of Standards and Technology (NIST). Silica gel (100–200 mesh) for purification and fractionation was purchased from Fisher Scientific. The surrogate standards hexadecane-d34,fluorene-d10,benzo(e)pyrene-d12 and ethylbenzene-d10 were purchased from Sigma-Aldrich.
2.2. Sample collection
2.2.1. Oil mousse.
In May 2010, sea surface oil mousses, as oil emulsified with water, were collected at stations OSS and CT on board R/V Pelican (figure 1) using an acid-cleaned bucket. The oil mousse was scooped into acid-cleaned polyethylene bottles, sealed in Ziploc bags and frozen immediately at −20 °C until analysis. Stations OSS and CT are located 130 and 85 km away from the accident site, respectively. At station CT, brownish oil mousse was observed in a patchy distribution, while at OSS, the mousse was more extensive with a darker brown color and stronger odor (figure S1 available at stacks.iop.org/ERL/7/035302/mmedia).

Figure 1. Sampling stations in the northern Gulf of Mexico. Oil mousse from the sea surface was collected at station OSS (oil spill site) and CT (control), and from salt marshes at station MP (Marsh Point, MS). One possible movement of the oil mousse on the sea surface was from OSS, CT, and to MP, as shown in the arrows. This movement projection is consistent with weathering degrees derived from chemical compositions of the oil mousse. Sediments were also collected from stations SG (station grab) and SC (station core).
Download figure:
Standard imageThe brownish oil mousse washing onto salt marshes with tropical systems (Hurricane Alex, TS Bonnie and Tropical Depression #5) was collected at Marsh Point (MP) in Davis Bayou (30.375°N, 88.790°W), Mississippi, on 21 July 2010, about two weeks after the crude oil first came onshore at this location (figure S1 available at stacks.iop.org/ERL/7/035302/mmedia). The marsh plants (Spartina alterniflora) with oil mousse were cut in situ, preserved in glass jars at 4 °C in a cooler and transported to the laboratory immediately. Oil attached heavily to Spartina alterniflora stalks was scraped carefully into a glass vial using a Teflon knife and frozen at −20 °C until analysis. The MC252 reference oil was requested from BP (through Dr Guo). All of the samples were sealed tightly and stored in a freezer (−20 °C).
The mass of total solvent-extractable materials (TSEM) was obtained from an aliquot of the oil mousse. Briefly, about 0.5 g of the oil mousse was weighed and extracted with dichloromethane (DCM), and the extract was evaporated gently with a nitrogen stream. The residue was defined as TSEM (Wang et al 2004). The petroleum hydrocarbons reported in the oil mousse samples were normalized to the TSEM values (as mg g−1 TSEM). The TSEM values were 652, 683 and 750 mg g−1 for OSS, CT and MP mousse, respectively. The water contents of the OSS and CT mousse were quantified gravimetrically. Briefly, about 1 g of oil mousse was dissolved in 20 ml DCM, filtered through a column of anhydrous sodium sulfate, and the DCM was evaporated in the oven at 50 °C overnight. The water contents of the oil mousse at stations OSS and CT were 39% and 41%, respectively. The water contents may have been overestimated considering that volatile hydrocarbons can be lost in the oven.
2.2.2. Oil in sediment.
In May 2011, sediments were collected at stations SG and SC, 2 and 6 km away from the wellhead, respectively (figure 1). At SG, surface sediment was collected using a Ponar grab sampler. Surface sediment from the grab sampler was removed using a stainless steel spoon and transferred into pre-combusted glass jars and frozen at −20 °C until analysis. At SC, intact sediment was collected with a 'HYPOX' corer (Gardner et al 2009). The surface layer (0–2 cm), with clear contamination by brown-reddish oil (figure S1 available at stacks.iop.org/ERL/7/035302/mmedia), was sectioned and stored in pre-combusted glass jars at −20 °C until analysis. To differentiate from the 'oil mousse' on the sea surface, the term 'oil' is used here to describe sediment contamination.
2.3. Sample preparation
2.3.1. Sample preparation for alkane and PAH analysis.
For OSS, CT or MP oil mousse, about 1 g of sample was weighed, spiked with deuterated hexadecane-d34, fluorene-d10 and benzo(e)pyrene-d12, and extracted five times successively with 20 ml of DCM for 10 min each time using sonication. The extracts were combined and filtered through a chromatographic glass column packed with 12 g anhydrous sodium sulfate. The DCM extracts were concentrated by a Rotovap and exchanged with hexane to a final volume of ∼ 10 ml, with 0.1–0.4 ml of the concentrated extracts taken for clean-up and fractionation. The freeze-dried sediments ( ∼ 2 g) were spiked with deuterated hexadecane-d34, fluorene-d10 and benzo(e)pyrene-d12, and extracted with 160 ml of hexane in Soxhlet extractors for 24 h (Short and Harris 1996). The extracts were then filtered through 12 g anhydrous sodium sulfate and concentrated by Rotovap to a final volume of 0.5 ml for clean-up and fractionation.
The sample clean-up and fractionation procedure followed the protocol of Wang et al (2004). Briefly, concentrated extracts were transferred into silica gel chromatographic columns, dry-packed with 3 g of activated silica gel and topped with 3–5 g of anhydrous granular sodium sulfate ( ∼ 1 cm). The columns were conditioned with 20 ml of hexane, and the concentrated extracts were loaded into the column just prior to exposure of the sodium sulfate layer to air. The saturated hydrocarbons and aromatic hydrocarbons were eluted with 12 ml of hexane and 15 ml of benzene in hexane (50% v/v), respectively. For each sample, the total GC-detectable saturated n-alkanes were analyzed with one half of the hexane fraction (F1). The alkylate PAHs and other PAHs were analyzed with one half of the benzene in the hexane fraction (F2). These fractions were concentrated by a Rotovap to a final volume of 200 μl for GC-FID and GC-MS analyses, respectively.
For MC252 oil, 12 μl of crude oil was diluted with hexane to 1 ml and passed through a 1 g sodium sulfate column. The final volume of the concentrated solution in hexane was 2.5 ml. The procedures for clean-up and fractionation were the same as for the oil mousse samples.
2.3.2. Sample preparation for BTEX and C3-benzene analysis.
The protocol of Wang et al (1995) was applied for analysis of volatile BTEX and alkyl-substituted benzenes in oil, using GC-MS in selected ion monitoring mode (SIM). Briefly, all of the samples including the reference crude oil, oil mousses and sediments (wet without freeze-dried process) were weighed directly and dissolved into n-pentane to an approximate concentration of 2 mg ml−1, to avoid possible loss of volatile BTEX and C3-benzenes (Wang et al 1995). Sediment samples and oil mousse samples were spiked respectively with 100 μl and 500 μl of ethylbenzene-d10 containing 20 ng μl−1. Details of the column chromatographic fractionation procedure are the same as described above, except that n-pentane and DCM replaced the hexane and benzene (Wang et al 1995). The recovery of ethylbenzene-d10 was 70.9 ± 13.0%.
2.3.3. Sample preparation for trace metal analysis.
The oil mousse and the crude oil were prepared for trace metal analysis using acid digestion. All plastic bottles and PTFE beakers for sample preparation were soaked in 4 M HNO3 solution for 2 d and rinsed with Milli-Q water before use. Each subsample of oil mousse was weighed into a 100 ml PTFE beaker, and 5 ml of concentrated HNO3 (trace metal grade) and 3 ml of perchloric acid (trace metal grade) were added. The beakers were covered with PTFE watch glass and placed on a hotplate (Thermo) at 120 °C for 2 d to decompose the oil completely. After the digestion solution became clear, the PTFE watch glass was removed and the acid solution was evaporated gently to near dryness at 100 °C. The residue was dissolved into 10 ml of 10% HNO3 acid, and the final digestion solution was filtered through a Whatman glass microfiber filter (934-AH) to remove clay or sand particles. The digestion solution was diluted 10 times with 2% HNO3 solution for trace metal measurement.
2.4. Hydrocarbon and trace metal analysis
Analysis for n-alkanes (C8–C40), Pr and Ph was performed on a GC-FID (Shimadzu GC 2014), with a JW scientific DB5 column (30 m × 0.25 mm,0.25 μm film thickness). The injection volume was 1 μl with a split ratio of 20. The temperature of the column was ramped from 40 to 280 °C at a rate of 8 °C min−1, and held at 280 °C for 40 min. Quantification was based on the internal standard hexadecane-d34 and external standards of n-alkanes. Analysis of triplicate samples from the OSS mousse agreed within ±9%.
Sixteen PAHs, 18 alkylated PAH compounds including six alkylated homologues, and BTEX and C3-benzenes were analyzed with GC-MS (Shimadzu QP2010 plus), with a Restek DB5 column (20 m × 0.18 mm,0.18 m film thickness). The injection volume was 1 μl. The temperature of the column was ramped from 40 to 280 °C at a rate of 8 °C min−1 and held at 280 °C for 40 min. The samples were analyzed by GC-MS with a split ratio of 20 in SIM. Table S1 (available at stacks.iop.org/ERL/7/035302/mmedia) lists the selected characteristic ions used for analysis of target PAHs, alkylated PAH homologues, BTEX and C3-benzenes.
Trace metal analysis was carried on an ICP-MS (Element 2 Finnigan MAT, Thermo) equipped with a PTFE spray chamber as the sample introduction system. Instrument tuning and mass calibration were performed prior to the analysis. The trace metals Mg, Al, V, Cr, Mn, Fe, Ni, Co, Cu, Zn, As and Pb were measured with a standard calibration method with medium resolution.
2.5. Quality assurance and quality control
Relative response factors for each compound were calculated relative to internal standards. Samples were quantified with deuterated hexadecane-d34, fluorene-d10, benzo(e)pyrene-d12 and ethylbenzene-d10. An instrument blank (GC-FID and GC-MS) and standard solutions, which included authentic n-alkanes with Pr and Ph, or target PAHs, or BTEX and C3-benzenes, were analyzed before each sample batch to monitor accuracy and precision. The recoveries of hexadecane-d34, fluorene-d10 and benzo(e)pyrene-d12, for alkane and PAH analysis, were 77.1 ± 11.0%, 91.3 ± 8.9% and 93.2 ± 12.1% respectively.
3. Results
3.1. Saturated hydrocarbon in oil mousse and sediments
The GC-FID chromatograms of three oil mousse samples (F1 fraction) showed similar distribution patterns for resolved peaks and unresolved complex mixture (UCM) (figure S2 available at stacks.iop.org/ERL/7/035302/mmedia), suggesting that they originated from the same MC252 oil source. The three oil mousse samples had resolved n-alkanes in the range of C14–C38, while the MC252 oil had a typical wide range (from C9 to C38) of crude oil distribution (figure S2 available at stacks.iop.org/ERL/7/035302/mmedia). Note that n-alkanes less than C9 were not resolved in our GC-FID protocol, even though these LMW volatile compounds represented a major fraction of the crude oil (Ryerson et al 2011).
The concentrations of individual n-alkanes in OSS mousse ranged from 0.0005 to 2.8 mg g−1 TSEM, with a total 29.3 mg g−1 TSEM; in CT mousse 0.0006–0.58 mg g−1 TSEM, with a total 6.9 mg g−1 TSEM; and in MP mousse 0.001–1.3 mg g−1 TSEM, with a total 14.3 mg g−1 TSEM. The n-alkanes C16–C32 represented about 90% of the total alkanes by mass for the three oil mousse samples. In contrast, the total concentration of individual n-alkanes in MC252 oil was 68.09 mg ml−1, and the n-alkanes C16–C32 constituted 45% of the total alkanes, without considering n-alkanes less than C9. The loss of low molecular weight n-alkanes in the oil mousse was apparent relative to the crude oil. Concentrations of n-alkanes from C9 to C15 represented only 0.3%–1.6% of the oil mousse, as compared to 53% in MC252 oil (figure 2). Pristane (Pr) and phytane (Ph) are common isoprenoids in crude oils. The Pr/Ph ratios were 0.94–1.09 for the oil mousse, similar to that of MC252 oil (0.94) (table 1). The carbon preference index (CPI) represents the ratio of relative abundance of odd-numbered n-alkanes to that of even-numbered n-alkanes (Ehrhardt and Petrick 1993). As expected, the CPI is 1 for all of the oil mousse samples, which corresponds to the normal criteria for petroleum hydrocarbons (Requejo and Boehm 1985, Kennicutt et al 1991).
Table 1. Ratios of hydrocarbons for the oil spill samples and the MC232 crude reference oil. Oil mousse was collected from the sea surface at the stations OSS and CT, and salt marshes at station MP. Oil deposited in sediment was collected at stations SG and SC (see figure 1 for the locations).
| MC252 | OSS | CT | MP | SG | SC | |
|---|---|---|---|---|---|---|
| n-C17/pristane | 1.6 | 2.2 | 1.6 | 1.6 | 1.4 | 1.3 |
| n-C18/phytane | 1.6 | 3.1 | 2.9 | 3.6 | 2.5 | 2.4 |
| Pristane/phytane | 0.9 | 1.1 | 0.9 | 1.0 | 0.8 | 1.0 |
| CPIa | 1.0 | 1.0 | 1.0 | 1.0 | 1.0 | 1.2 |
| Alkanes/PAHsb | 70.3 | 127.6 | 245.8 | 1409.3 | 2581.8 | 12.6 |
| Alkylated PAHs/PAHs | 6.2 | 40.8 | 154.2 | 411.0 | 1680.4 | 112.6 |
| Alkanes/alkylated PAHs | 11.3 | 5.1 | 2.7 | 3.4 | 1.5 | 0.1 |
aCPI: carbon preference index. CPI was calculated from all n-alkanes (C9–C38). bRatios among alkanes, PAHs and alkylated PAHs were calculated from their total concentrations.

Figure 2. Concentrations of n-alkanes (C9–C38), pristane (Pr) and phytane (Ph) in MC252 reference oil, mousse from stations OSS, CT and MP, and sediment oil from stations SC and SG. The alkane concentrations in oil mousse were normalized to total solvent-extractable materials (TSEM), and in sediments normalized to dried sediment weight.
Download figure:
Standard imageThe individual n-alkane levels in SC sediment were low, ranging from 2.35 × 10⁻⁵ to 2.94 × 10⁻⁴ mg g−1 dry weight, with a total of 3.63 × 10⁻³ mg g−1. In contrast, concentrations of n-alkanes in SG sediment were much higher, ranging from 0.003 to 0.22 mg g−1 per component, yielding a total of 2.56 mg g−1 (figure 2). This pattern was expected, as station SC (6 km) is further away from the wellhead than station SG (2 km). Consistently, a clear UCM hump was observed in the GC chromatogram of the SG sediment, but not in the SC sediment (figure S3 available at stacks.iop.org/ERL/7/035302/mmedia). However, both of the chromatograms had resolved n-alkanes from C11 to C37. The ratios of n-C17/pristine and n-C18/phytane were 1.31 and 2.44 for SC sediment, and 1.38 and 2.52 for SG sediment, respectively. The CPIs were also different, with 1.0 and 1.2 for the SG and SC sediments, respectively (table 1).
3.2. PAHs and alkylated PAH homologues in oil mousse and sediments
The total concentration of 16 PAHs was 0.23 mg g−1 TSEM in the OSS mouse, 8 times higher than that in the CT mousse (0.03 mg g−1) (figure 3). The MP mousse had the lowest concentration, only 0.01 mg g−1 TSEM. All these concentrations in oil mousse were much lower than the 1.15 mg g−1 (assuming a density of 0.84 g ml−1 for the crude) in the MC252 crude. Naphthalene was the dominant PAH in the crude oil, accounting for 64% of the total PAHs, followed by phenanthrene and fluorene, while chrysene and other PAHs occurred as minor components. In contrast, the naphthalene content in oil mousse decreased greatly, ranging from 3% to 9%. Chrysene represented only 2% of the total PAHs in the crude oil, while it became the dominant PAH in oil mousse, accounting for 38% for the OSS, and 53%–56% for the CT and MP. Phenanthrene is a major PAH in the crude oil (17%), and its percentage increased in the OSS mousse (39%), driven mainly by the loss of naphthalene. The percentage of phenanthrene decreased greatly from OSS (39%), to CT (16%), to MP mousse (4%). Other PAHs were minor and had similar distributions in the oil mousse.

Figure 3. Concentrations of PAHs in MC252 reference oil, mousse from stations OSS, CT and MP, and sediment oil from stations SC and SG. The PAHs measured include naphthalene (Naph), acenaphthylene (Acl), acenaphthene (Ace), fluorene (Fluo), phenanthrene (Phen), anthracene (An), fluoranthene (Fl), pyrene (Py), benzo[a]anthracene (BaA), chrysene (Chry), benzo[b]fluoranthene (BbF), benzo[k, j]fluoranthene (BkF), benzo[a]pyrene (BaP), indeno[1, 2, 3]pyrene (IP), dibenzo[a, h]anthracene (DA) and benzo[ghi]perylene (BgP).
Download figure:
Standard imageThe concentrations of alkylated PAH homologous series in the crude oil and oil mousse were higher than their corresponding PAHs (figure 4), in consistency with other studies (Wang et al 1994, 2004). For example, the concentrations of 1- and 2-methylnaphthalene in the crude oil were 2–3 times higher than that of naphthalene, as were the phenanthrene and chrysene series. The total concentration of alkylated PAHs in the oil mousse ranged from 2.6 to 9.4 mg g−1 TSEM, with OSS the highest. This concentration level is similar to that of the crude oil (7.2 mg g−1), suggesting that these components are relatively stable. The distribution of alkylated PAHs in the mousse resembled their parent PAH patterns. Alkylated naphthalenes in the oil mousse became minor components relative to other alkylated PAHs, as did naphthalenes relative to the PAHs. Alkylated phenanthrenes were dominant components in the OSS mousse, but their concentrations decreased gradually from CT to MP mousse. Three-methylchrysene became the dominant component of the alkylated PAHs in the three mousses.
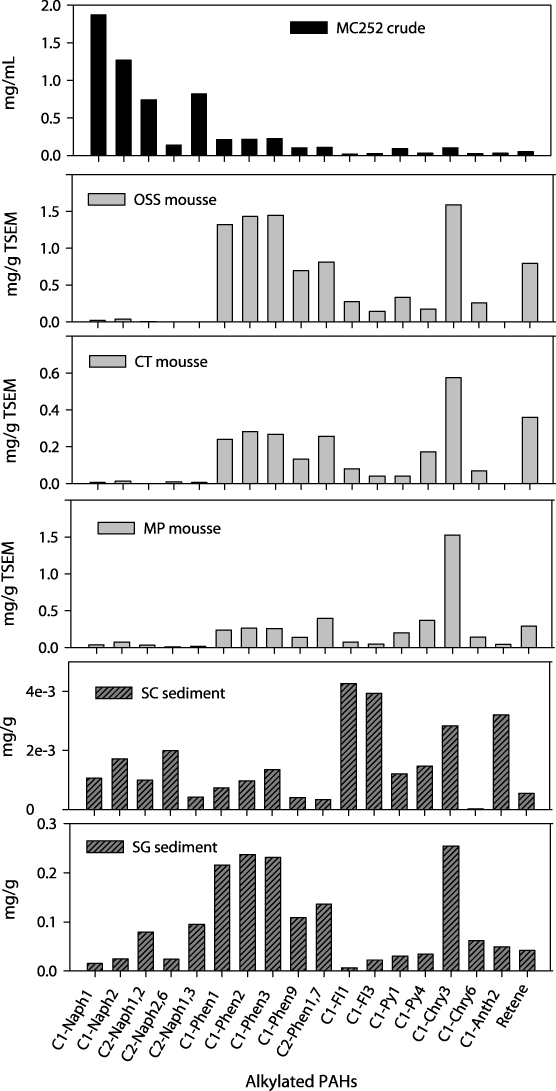
Figure 4. Concentrations of alkylated PAHs in MC252 reference oil, mousse from stations OSS, CT and MP, and sediment oil from stations SC and SG. These alkylated PAHs include 1-methylnaphthalene (C1-Naph1), 2-methylnaphthalene (C1-Naph2), 1,2-dimethylnaphthalene (C2-Naph1, 2), 1, 6-dimethylnaphthalene (C2-Naph1, 6), 2, 6-dimethylnaphthalene (C2-Naph2, 6), 1-methylphenanthrene (C1-Phen1), 2-methylphenanthrene (C1-Phen2), 3-methylphenanthrene (C1-Phen3), 9-methylphenanthrene (C1-Phen9), 1, 7-dimethylphenanthrene (C2-Phen1, 7), 1-methylfluoranthene (C1-Fl1), 3-methylfluoranthene (C1-Fl3), 1-methylpyrene (C1-Py1), 4-methylpyrene (C1-Py4), 3-methylchrysene (C1-Chry3), 6-methylchrysene (C1-Chry6) and 2-methylanthracene (C1-Anth2).
Download figure:
Standard imageConcentrations of total PAHs were 3 times higher in SG sediment (1 μg g−1) than in SC sediment (0.3 μg g−1), consistent with their respective distances to the wellhead. The compositions of the PAHs in the two sediments were similar, becoming enriched with PAHs containing a higher number of rings, such as phenanthrene and chrysene. Consistent with the PAHs, alkylated PAH homologues were much higher in SG sediment (1.7 mg g−1) than in SC sediment (0.03 mg g−1). The concentrations of alkylated PAHs were much higher than their corresponding PAHs in both sediments. For example, concentrations of alkylated phenanthrenes in SG sediment ranged from 0.1 to 0.2 mg g−1, whereas that of phenanthrene was about 0.1 μg g−1. In contrast, concentrations of alkylated phenanthrenes (0.1–0.2 mg ml−1) resembled phenanthrene (0.16 mg ml−1) in the crude oil.
3.3. BTEX and C3-benzenes in mousse and sediments
BTEX and C3-benzenes are important parameters in determining the weathering degrees of oil due to their high volatility and solubility (Wang and Fingas 1995). As expected, the concentrations of BTEX and C3-benzenes in OSS and CT oil mousses were 105 and 75 μg g−1 TSEM for C3-benzenes, 449 and 359 μg g−1 TSEM for BTEX, respectively, about one order of magnitude lower than those of the crude oil (figure 5 and table 2). The BTEX and C3-benzenes were not measured in the MP mousse. For the SG and SC sediments, the concentrations of BTEX and C3-benzenes were 0.6, 1.8 and 0.2, 0.6 μg g−1 wet weight, respectively (figure 5).
Table 2. Concentrations of BTEX and C3-benzenes in MC252 crude oil (μg g−1), oil mousse from stations OSS and CT (μg g−1 TSEM), and sediment oil (μg g−1, wet weight) at stations SC and SG.
| Name | MC252 (μg g−1) | OSS (μg g−1 TSEM) | CT (μg g −1 TSEM ) | SC (μg g −1) | SG (μg g −1) |
|---|---|---|---|---|---|
| Toluene | 861 | 28.6 | 27.4 | 0.04 | 0.08 |
| Ethylbenzene | 289 | 62.4 | 53.9 | 0.10 | 0.29 |
| m-xylene + p-xylene | 862 | 209 | 159 | 0.28 | 0.86 |
| o-xylene | 623 | 150 | 119 | 0.18 | 0.58 |
| Isopropylbenzene | 21.5 | 3.5 | 1.2 | 0.03 | 0.24 |
| n-propylbenzene | 71.3 | 6.7 | 7.0 | 0.01 | 0.03 |
| 1, 3, 5-trimethylbenzene | 188 | 18.8 | 14.6 | 0.02 | 0.06 |
| 1, 2, 4-trimethylbenzene | 575 | 76.2 | 51.9 | 0.09 | 0.30 |
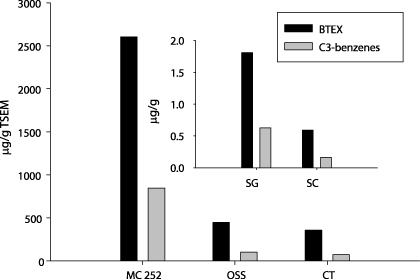
Figure 5. Concentrations of BTEX and C3-benzenes in crude oil and mousse collected at stations OSS and CT (normalized to TSEM). The MC252 crude oil was normalized to gram assuming a density of 0.84 g ml−1. The inset refers to BTEX and C3-benzenes in sediments collected at stations SG and SC (2 and 6 km away from the wellhead).
Download figure:
Standard image3.4. Trace metals in oil mousse
The concentration of Mg was 6.4 μg g−1 in the crude oil, but was elevated to 2170 and 2899 μg g−1 TSEM in OSS and CT mousse, respectively (figure 6 and table 3). Concentrations of terrestrial metals such as Al, Mn and Fe in CT and MP oil mousses were significantly higher than those in the crude oil and OSS mousse. The levels of Al were 14 μg g−1 in the crude and 72 μg g−1 TSEM in the OSS mousse, but increased to 432 and 738 μg g−1 TSEM in the CT and MP mousse, respectively. Similarly, Fe concentrations were 8 μg g−1 in the crude oil, 50 μg g−1 TSEM in the OSS mousse, and increased to 603 and 955 μg g−1 TSEM in the CT and MP mousse; the Mn concentration followed the same trend, from 0 (non-detectable) in crude and 4 μg g−1 TSEM in the OSS mousse to 52 and 39 μg g−1 TSEM in the CT and MP mousse, respectively. The concentrations of the other transition metals V, Ni, Co, Cu, As and Pb in the oil mousse followed similar distribution patterns. From the crude, OSS, CT to MP mousse, V concentrations were 0.2 μg g−1, 1.0, 1.5 and 1.7 μg g−1 TSEM; Ni concentrations were 1.5 μg g−1, 4.2, 7.7 and 7.3 μg g−1 TSEM; Co concentrations were 0.2 μg g−1, 0.2, 0.4 and 0.7 μg g−1 TSEM; Cu concentrations were 0.5 μg g−1, 1.7, 4.0 and 3.3 μg g−1 TSEM; Pb concentrations were 0.3 μg g−1, non detectable, 0.6 and 1.5 μg g−1 TSEM; and Zn concentrations were 18 μg g−1, 18.7, 51.8 and 13.3 μg g−1 TSEM, respectively.
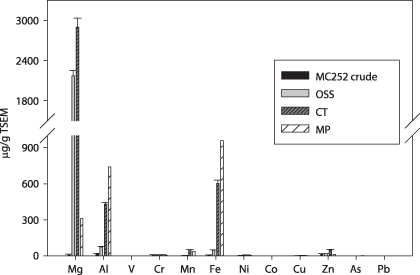
Figure 6. Trace metals in MC252 crude oil, and oil mousse from stations OSS, CT and MP. Trace metal concentrations were normalized to TSEM.
Download figure:
Standard imageTable 3. Trace metal concentrations in MC252 crude oil (μg g−1), oil mousses (μg g−1 TSEM) collected at stations OSS and CT, and oil mousse collected from salt marshes at Mash Point (MP), Mississippi. ND: non detectable.
| Metal | MC252 crude | OSS | CT | MP |
|---|---|---|---|---|
| Mg | 6.4 | 2170 | 2899 | 309 |
| Al | 14.0 | 72 | 432 | 738 |
| V | 0.2 | 1.0 | 1.5 | 1.7 |
| Cr | 9.4 | 7.8 | 9.4 | 7.4 |
| Mn | ND | 4.2 | 51.6 | 38.7 |
| Fe | 7.9 | 49.9 | 603 | 955 |
| Ni | 1.5 | 4.2 | 7.7 | 7.3 |
| Co | 0.2 | 0.2 | 0.4 | 0.7 |
| Cu | 0.5 | 1.7 | 4.0 | 3.3 |
| Zn | 18.0 | 18.7 | 51.8 | 13.3 |
| As | ND | ND | ND | 3.5 |
| Pb | 0.3 | ND | 0.6 | 1.5 |
4. Discussion
4.1. The weathering of oil mousse from the sea surface to salt marshes
Chemical analysis of the mousse revealed that the surface oil was subjected to moderate evaporation after rising to the sea surface. Total n-alkane concentrations in the oil mousse (7–30 mg g−1 TSEM) were lower than those found typically in crude oils including MC252 (80 mg g−1), but consistent with oil collected in environments after oil spills in aquatic environments (Wang et al 2004). Low-molecular-weight (LMW) n-alkanes ( < C14) were lost in the oil mousse relative to the crude oil (figure 2), indicating that evaporation was the main weathering processes on the surface oil. These LMW hydrocarbons can be evaporated within 2–3 h after rising to the sea surface (Stiver and Mackay 1984, Fingas 1999, Ryerson et al 2011), while the time scale of evaporation for higher carbon numbered hydrocarbons (C14–C16) is estimated at 10–100 h (de Gouw et al 2011). Similarly, two-ring aromatics, mainly naphthalene and alkylated naphthalene, were lost preferentially ( > 99%) in the oil mousse relative to the crude oil (figures 3 and 4). Acenaphthylene and fluorene were also significantly lost in the oil mousse. Even though the loss of LWM aromatics may indicate evaporation, dissolution during the rise of oil to the sea surface may have also contributed to the loss, considering that the oil rose through a long water column (1500 m) and these LMW aromatics are more soluble than alkanes. For example, the solubility of naphthalene in water is approximately 30 mg l−1. However, the proportional naphthalene content relative to other volatiles detected in the atmosphere above the DWH site (Ryerson et al 2011, 2012) suggested that evaporation on the sea surface might be the main weathering process to these LWM aromatics.
Our chemical analyses suggested that among the three oil mousses, the MP mousse was the most weathered, followed by the CT and OSS mousses. The percentages of LWM alkanes ( < C19) in total alkanes were 25% in OSS, 13% in CT and 7% in MP, indicating an increased weathering degree driven mostly by evaporation (Wang et al 1995). The 16 PAHs measured were dominated by chrysene, accounting for 48%–53% of the total, indicating that the four-ring chrysene is exceptionally resistant to weathering (Wang et al 1994). Percentages of the three-ring phenanthrene, however, showed a clear decrease from OSS (39%), CT (16%), to MP (4%). The ratios of phenanthrene to chrysene were 1.0, 0.3 and 0.1 in OSS, CT and MP mousse, respectively, consistent with the order of weathering degrees derived from n-alkanes. A decreasing ratio of phenanthrene to chrysene indicates weathering processes of oil degradation in aquatic environments (Pastor et al 2001), including biological degradation (Zhou et al 2012). The alkylated phenanthrenes and chrysenes also supported this pattern, as all of the alkylated phenanthrenes decreased from OSS to CT and MP relative to 3-methylchrysene, which was the most resistant of all of the measured hydrocarbons.
Phenanthrene and its alkylated homologues had different time scales of weathering compared to LWM aromatics including naphthalene, acenaphthylene and fluorene. Based on the predicted n-alkane patterns of surface oil with time (Ryerson et al 2012), the OSS mousse was subjected to evaporation for more than 2 d after it rose to the sea surface. If this time scale is right, LMW aromatics were almost completely evaporated within three days as expected, but phenanthrene and its alkylated homologues continued to weather for days to weeks when the oil mousse reached salt marshes at Marsh Point, Mississippi in July 2010. Among the three groups of compounds, PAHs were the most weathered as suggested by the increased ratios of alkanes/PAHs and alkylated PAHs/PAHs from MC252 crude, OSS, CT to MP (table 1). Alkylated PAHs seem to be the most stable, as ratios of alkanes/alkylated PAHs decreased from 11.3 in the crude oil to 5.1 in OSS, 2.7 in CT and 3.4 in MP. The rapid decrease of PAHs relative to alkylated PAHs could be due to dissolution and/or evaporation, because PAHs tend to have higher solubilities and lower boiling points than their corresponding alkylated homologues (Havenga and Rohwer 2002). Photooxidation may not have played a major role, because alkylation tends to increase photooxidation rates (Prince et al 2003).
Many microorganisms can degrade petroleum components. For instance, n-alkanes are readily biodegraded aerobically in marine environments, and in particular n-alkanes with medium chain length (10–22 carbons) can be degraded preferentially (van Beilen et al 1994, Stout and Wang 2007). However, clear signs of biological degradation were not apparent from the oil mousse. For example, the distribution patterns of n-alkanes in the oil mousse relative to crude oil reflected typical evaporation from the progressive loss of LMW n-alkanes (Stout and Wang 2007). The ratios of n-C 17/Pr and n-C 18/Ph can indicate biodegradation (Pritchard and Costa 1991, de Jonge et al 1997). These ratios were generally higher in the oil mousse than in the crude oil (table 1), suggesting that biodegradation was not important in oil weathering. However, it is not clear why these ratios were higher in the oil mousse than in the reference crude oil. As mentioned above, the decrease in phenanthrene/chrysene ratio from OSS, CT to MP mousse could indicate some biodegradation (Pastor et al 2001, Zhou et al 2012). However, alkylated phenanthrenes in the oil mousse decreased at similar rates, suggesting that the weathering was not controlled by biodegradation, as the biodegradation rate decreases with the number of alkyl groups on the PAH nucleus (Prince 2002). Alternatively, alkylated phenanthrenes might be as labile as phenanthrene in the Gulf waters. Further laboratory research is needed to clarify this observation.
The weathering pattern of OSS < CT < MP is consistent with the surface water trajectory model (Liu et al 2011), showing that the surface oil first moved westward (OSS), then northeastward (CT), and finally reached salt marshes. This conclusion is supported further by a satellite image of the Mississippi River Delta, which shows the general path of the oil slicks on the sea surface during the time period when our oil mousse was collected (figure S4 available at stacks.iop.org/ERL/7/035302/mmedia). The oil color becomes lighter with emulsion in seawater (Jordan and Payne 1980), so the color difference between the two mousses suggests that the oil collected at station OSS (dark brown) was less weathered than that at station CT (light brown) (figure S1 available at stacks.iop.org/ERL/7/035302/mmedia). Our underlying assumption is that these oil samples had the same MC252 oil origin. This assumption is reasonable, considering that these samples were collected during the DWH oil spill, and that the sampling stations were contaminated by this oil spill (figure S4 available at stacks.iop.org/ERL/7/035302/mmedia). For example, the arrival and evolvement of the oil at MP after the DWH oil spill were well documented (Biber et al 2012, Wu et al 2012). Typical biomarkers were not applied to verify that these mousses originated from the MC252 well (Carmichael et al 2012), but their similar but gradually evolving hydrocarbon compositions (figures 2–4), such as the dominance of chrysene and 3-methylchrysene, suggest the same origin for these mousses.
The trace metals V, Cr, Fe, Ni, Cu, Zn and Pb are typical constituents of crude oil (Gohlke et al 2011, Osuji and Onojake 2004), but their levels in oil may change with weathering as oil can absorb metal ions from seawater and the oil mass, relative to metal content, may decrease with oil degradation. Our results showed that concentrations of V, Ni, Co, Cu, As and Pb increased from the crude oil to the MP mousse (table 3 and figure 6), and this pattern is consistent with the intensifying weathering of oil mousse from off shore to coastal salt marshes. Further analysis demonstrated that the concentrations of trace metals correlated inversely with the levels of short-chain alkanes (n < 19) and PAHs from the crude oil to the oil mousse along the projected transport route (figure 7). These correlations may indicate that trace metals were accumulated into the oil mousse at different rates during the loss of LMW components, as suggested by their different slopes of the regression curves. Metal ions might preferentially bind to high-molecular-weight oil components that may possess more chelating functional groups such as carboxyls and/or hydroxyls (Wells 2002). Trace metals in seawater are generally complexed with organic ligands of dissolved or particulate organic matter (Hirose 2006, 2007, Varspir and Butler 2009), which makes incorporation of metals to oil mousse easier by adsorption and/or hydrophobic interactions. Another possible explanation for the metal accumulation is that the trace metals simply became more concentrated as LMW oil components were degraded. However, if this was the case, the same slopes on the regression lines (figure 7) for the different metals would be expected.

Figure 7. Linear correlations between concentrations of trace metals and (A) short-chain alkane (n < 19) percentages in total n-alkanes, and (B) concentrations of PAHs (logarithm) in the oil mousse from stations OSS, CT and MP, and MC252 crude.
Download figure:
Standard imageOf the trace metals measured, the concentrations of Al, Fe and Mn in the oil mousse increased significantly from the crude oil, OSS, CT to MP mousse (figure 6). We propose that clay minerals, presumably abundant in the sampling area due to the impact of the Mississippi River, were aggregated into the oil mousse during the transport from the accident site to the salt marshes. Even though clay minerals were not digested during our analytical procedure for trace metals, the leaching of Al, Fe and Mn from clay minerals during the digestion could occur. Concentrations of Mg were also much higher in OSS and CT mousse than that in the crude oil. This trend can be attributed to the water contained in oil mousse due to the oil emulsion, since Mg is one major element in seawater with a concentration of 52.8 mM. The water contents in the mousse were 0.4 g g−1 for the OSS and CT mousses, and 0.25 g g−1 for the MP mousse. The Mg in the mousse water itself can account for the total Mg in the MP mousse, but only about 30% of the Mg contents in the OSS and CT mousses, suggesting that the oil mousse did accumulate Mg, as discussed above.
4.2. Oil in sediments adjacent to the wellhead one year after the DWH oil spill
Previous reports showed that among 120 sites within a 2.7 km range of the wellhead, 29% of the sediment cores exhibited evidence of oil contamination (Operational Science Advisory Team 2010). The results from two sediments (within 6 km from the wellhead) indicate that both sites were contaminated by the DWH oil spill, based on the enhanced hydrocarbon levels, presence of BTEX and C3 benzenes, UCM in the GC chromatograms, and visual observation of the cores (figure S1 available at stacks.iop.org/ERL/7/035302/mmedia). However, the oil level decreased significantly from station SG (2 km) to SC (6 km). For example, the concentration of total n-alkanes was more than two orders of magnitude higher in SG than in SC.
The sedimentation of oil is caused mainly by physical interactions between suspended particulate matter and oil (Muschenheim and Lee 2002, Shen and Jaffe 2000). About 20%–30% of the total spill oil can reach sediments in coastal regions with high concentrations of suspended particulate matter (Payne et al 2003). Oil may persist much longer in sediment than at the sea surface (Harayama et al 1999). Two factors may contribute to the slow oil degradation in sediment. Hydrocarbons can be absorbed strongly into minerals and/or sedimentary organic matter. Also, oil on the sediment surface can inhibit the penetration of dissolved oxygen into the sediment, and labile hydrocarbon can stimulate the consumption of dissolved oxygen by bacteria. These two mechanisms can quickly result in oxygen depletion and retard further aerobic degradation of the deposited oil.
Our results showed a clear loss of LMW compounds including C9–C13 n-alkanes, naphthalene and alkylated naphthalenes in oil deposited in sediments, relative to the crude oil. Most of this weathering can be attributed to dissolution and biodegradation. The LMW compounds tend to have higher solubilities in water. For example, the solubility of naphthalene in water is 30 mg l−1 and that of 1-methylnaphthalene is 26 mg l−1, whereas the solubilities of phenanthrene and 1-methylphenanthrene are 1.6 and 0.26 mg l−1, respectively (Shiu et al 1988). As a result, PAHs with more than three rings were enriched in sediments (figure 3), showing different distribution patterns from those of oil mousse, which was dominated by chrysene. Relative to oil mousse, the n-alkanes C12–C15 and alkylated naphthalenes were enriched in the sediments, further suggesting that evaporation was the main mechanism in losing C12–C15 in the oil mousse on the sea surface.
Biodegradation was expected to modify the chemical composition of the oil that had been deposited in sediment for one year, even though the degradation might be slow due to the low temperature (4 °C) and limitation of available dissolved oxygen (Ward et al 1980). Indeed, relatively high abundance of type I methanotrophic bacteria in SG and SC sediments and overlying waters (unpublished data) indicated the existence of methane oxidation (Hanson and Hanson 1996). In addition, some evidence of biodegradation was apparent. The n-alkanes C16–C27 in the SC sediment and C16–C23 in the SG sediment were lost preferentially (figure 2). This result is consistent with observations from other oil spill studies, where medium chain n-alkanes (∼C10–C22) were biodegraded most rapidly (Stout and Wang 2007). This distribution pattern is more evident in the SC sediment than in the SG sediment, suggesting that the oil in SC was more degraded. Likewise the slightly lower ratios of n-C17/Pr and n-C 18/Ph in SC (1.3 and 2.4) than in SG (1.4 and 2.5) lead to similar conclusions, since such ratio patterns can indicate biodegradation (Christensen and Larsen 1993, Wang et al 1994, 1999). Note that the odd-numbered n-alkanes C 29,C 31 and C33 were enhanced in the SC sediment with a CPI of 1.2, indicating a biogenic input from terrestrial sources (Goni et al 1998). The ratio of n-alkanes/alkylated PAHs was used to compare the relative loss of n-alkanes by biodegradation in sediments because the alkylated PAHs are more resistant to microbial degradation than n-alkanes and PAHs (Fedorak and Westlake 1981, Wang and Fingas 1995). The ratio n-alkanes/alkylated PAHs was more than one order of magnitude smaller at SC (0.1) than that at SG (1.5), suggesting that biodegradation was more intensive at SC. The significantly lower amount of oil contamination may have led to rapid degradation due to substrate availability. The distribution of alkylated PAHs in SG was similar to that of crude oil, dominated by phenanthrene homologues, without considering naphthalene homologues. However, the phenanthrene homologues were more degraded at SC than SG, and, as a result, fluoranthene and pyrene homologues became the dominant ones. This pattern cannot be explained by dissolution, because it would cause lower naphthalene homologues that have much higher solubilities. Phenanthrene is often more biologically labile than chrysene (Wang and Fingas 2003, Prince and Walters 2007, Zhou et al 2012). One possible explanation is that the phenanthrene homologues were labile under the low temperature and low DO concentration in the deep sea sediment. A rapid decrease of alkylated phenanthrenes was also observed in oil mousse from OSS to MP (figure 4).
Even though clear signs of biodegradation were observed for the oil deposited in the sediment adjacent to the wellhead, oil degradation in sediments was quite slow, considering that high concentrations of labile n-alkanes were observed after one year at stations SG and SC. The presence of BTEX and C3-benzenes also suggests that the oil was subjected to a light to moderate degree of weathering ( < 25%) (Wang and Fingas 1995).
5. Conclusions
Compositional changes of n-alkanes, PAHs and alkylated PAHs, BTEX, C3-benzenes and trace metals were evaluated in oil mousse collected from the sea surface, salt marshes and surface sediments near the wellhead. Our results showed that the oil mousses were weathered moderately by evaporation, with clear losses of low-molecular-weight compounds including n-alkanes (n < 16), naphthalene and its homologues relative to the reference crude oil. The weathering degree became more intensive on the oil mousse collected from OSS, CT to MP, as evidenced by compositional changes of n-alkane, PAHs and alkylated PAHs. Consistently, amounts of total alkanes relative to total alkylated PAHs, a group of relatively stable compounds, decreased from OSS, CT to MP mousse, as did total PAHs, but with a greater degree of loss. The observed weathering pattern is consistent with a projected trajectory movement of oil mousse from accident sites to the salt marsh. Among the petroleum compounds monitored, 3-methylchrysene seems to be the one most stable to weathering on the sea surface, indicating that this compound can serve as a reference for this oil spill. Furthermore, contents of trace metals, particularly Al, Fe and Mn, increased significantly from crude oil, OSS, CT to MP, suggesting that clay minerals and dissolved metals were aggregated during the oil weathering and mousse transportation.
Our chemical analysis also revealed that the weathering processes to the oil deposited in sediments adjacent to the wellhead were slow one year after the spill. The weathering was more intense at station SC with less oil contamination than at station SG with more oil contamination, supported by the decreasing ratios of n-C17/Pr,n-C18/Ph and total n-alkanes/total alkylated PAHs from station SG to SC. The weathering in sediments was attributed to biological degradation and dissolution. However, the weathering in sediments is slow and light, as reflected by appreciable amounts of low-molecular-weight compounds such as short-chained n-alkanes (C10–C15), naphthalene and its homologues, BTEX and C3 benzenes. This slow weathering might be caused by the low temperature, low oxygen concentration, and less microbial activity.
Even though we only collected a limited number of samples due to logistical constraints, our data provide insights into how the oil on the sea surface and in sediment was altered by weathering processes in the northern Gulf of Mexico. The composition and concentrations of hydrocarbons may help evaluate the toxicity of the oil and the impact of the oil spill on coastal ecosystems.
Acknowledgments
We thank the crew of the R/V Pelican and X Lin and Y Tan for assistance in collecting samples. We also thank BP for providing the reference MC252 surrogate oil (through L Guo), and P Biber for collecting the marsh oil. Wayne S Gardner generously shared his ship time (NOAA grant # NA07NOS4780225) and the HYPOX corer. We are grateful to three anonymous reviewers for their constructive comments. This work was funded mainly by the National Science Foundation Chemical Oceanography Program (OCE-1042908 to ZL) and OTIC (OCE-0752105 to QZ), Gulf Research Initiative (DROPPS Consortium), and partially through a Research Grant from The University of Texas at Austin.