
Abstract
Life cycle analysis methods were employed to model the greenhouse gas emissions and fossil energy consumption associated with geothermal power production when supercritical carbon dioxide (scCO2) is used instead of saline geofluids to recover heat from below ground. Since a significant amount of scCO2 is sequestered below ground in the process, a constant supply is required. We therefore combined the scCO2 geothermal power plant with an upstream coal power plant that captured a portion of its CO2 emissions, compressed it to scCO2, and transported the scCO2 by pipeline to the geothermal power plant. Emissions and energy consumption from all operations spanning coal mining and plant construction through power production were considered, including increases in coal use to meet steam demand for the carbon capture. The results indicated that the electricity produced by the geothermal plant more than balanced the increase in energy use resulting from carbon capture at the coal power plant. The effective heat rate (BTU coal per total kW h of electricity generated, coal plus geothermal) was comparable to that of traditional coal, but the ratio of life cycle emissions from the combined system to that of traditional coal was 15% when 90% carbon capture efficiency was assumed and when leakage from the surface was neglected. Contributions from surface leakage were estimated with a simple model for several hypothetical surface leakage rates.
Export citation and abstract BibTeX RIS

Content from this work may be used under the terms of the Creative Commons Attribution-NonCommercial-ShareAlike 3.0 licence. Any further distribution of this work must maintain attribution to the author(s) and the title of the work, journal citation and DOI.
1. Introduction
Geothermal technologies are renewable energy technologies that avoid fossil fuel consumption by exchanging heat with geological formations. Examples include geothermal heat pumps, baths, space heating, greenhouse heating, industrial heat provisioning and electrical power generation (Lund et al 2005). Electrical power generation with fossil energy sources is recognized as a principal source of greenhouse gas emissions, yet it is one of the most versatile forms of energy and is essential to many industrial and everyday activities (IEA 2009). New sources of renewable electricity are therefore sought, including new ways of producing electricity from geothermal resources.
Existing geothermal electricity generation is almost entirely from geothermal resources where water and steam present in hot permeable rock are brought to the surface for power generation, but relatively few geothermal sites have hot rock perfused with water. Enhanced geothermal systems (EGS) inject water from nearby sources into dry geological structures and recover hot water to drive turbines, coupled through a secondary fluid with a low boiling point. EGS expands the potential for geothermal power, but adequate water must be available to deploy it (Tester et al 2006).
Brown proposed using supercritical carbon dioxide (scCO2) instead of water to recover heat for EGS (Brown 2000). Electricity production from fossil fuels, especially from coal, produces CO2 that could be captured, compressed to scCO2. If this scCO2 were available near a geothermal resource, it might be utilized for power production; moreover, while water loss below ground is a problem, scCO2 consumption below ground provides the benefit of geological carbon storage.
Supercritical CO2 requires energy to produce and transport so, although scCO2-EGS is an appealing idea for increasing geothermal power production, there are questions about net energy consumption when all activities ranging from scCO2 production and transportation through power delivery are considered. The goal of this work was to examine the energy consumption and emissions incurred when coal-fired electricity is used to produce scCO2 and when that scCO2 is subsequently transported by pipeline to a geothermal site and utilized for power production. The scope of the study includes greenhouse gas (GHG) emissions and energy consumption associated with producing 1 MWh of total electricity before transmission. Activities related to procuring and using fuels (fuel cycle) and activities related to plant construction (plant cycle) are included. The fuel cycle includes the production and transportation of scCO2. GHG emissions consider the global warming potentials of CO2,CH4 and N2O.
2. System description
There are advantages and challenges from using scCO2 compared to using water for geothermal heat recovery. Supercritical CO2 has gas-like properties when propagating through rock and has viscosity 40% that of water (Brown 2000). For certain conditions, these properties enable scCO2 to permeate rock more easily than water. Further, scCO2 density decreases enough when heated below ground that the buoyancy of hot scCO2 can produce a thermal siphon effect that reduces pumping requirements. The low heat capacity of scCO2 relative to water (roughly 40%) potentially offsets these advantages, but the low viscosity and thermal siphon effect can result in higher circulation rates so that, when considered on the basis of required pumping energy, estimated net heat production for scCO2 is comparable to that of water (Brown 2000).
The scCO2 consumption (storage) rate affects the system concept. Some researchers estimate scCO2 consumption from experience with water-EGS. This approach estimates scCO2 consumption to be 5% of the scCO2 flow rate (Pruess and Azaroual 2006, Pruess 2007). In one scenario, each MW of scCO2-EGS power would require 3 MW of coal-fired power to supply adequate scCO2 to meet the scCO2-EGS consumption rate (Pruess 2007). If consumption rates were this high, the geothermal system would require an scCO2 pipeline to meet the scCO2 demand. In this scenario, the scCO2-EGS system serves as a sequestration mechanism for the (upstream) fossil-based power plant that, in addition, generates renewable electrical power as a by-product of the sequestration process.
A contrasting scenario estimates much lower scCO2 consumption (Dunn 2010, Mobley 2011). The scenario considered by these authors utilizes deep impermeable rock as the heat source. Carbon trapping can occur by one of four mechanisms: hydrodynamic trapping in pores of a porous rock capped by impermeable rock; solubility trapping in water or other liquids such as crude oil within porous rock; adsorption trapping on organic matter in coal seams and shale; and mineral trapping from reactions with silicates resulting in immobilized carbonates (Nelson et al 2005). In the stimulated (fractured) impermeable rock model of Dunn and Mobley, only mineral trapping is possible resulting in low consumption rates (Dunn 2010). In one of their scenarios, consumption was only 0.1% of flow. In this scenario, the scCO2 consumption can be met with a moderately sized on-site generator, no pipeline is required and almost 75% of the total power output derives from geothermal energy (Mobley 2011).
3. Methods
3.1. Life cycle analysis, system boundary and functional unit
Life cycle analysis (LCA) is a technique for comparing the environmental burdens incurred by alternative choices for carrying out an activity. In this study, greenhouse gas (GHG) emissions and energy consumption are compared for electrical power production from scCO2-EGS versus electrical power production from conventional coal-fired power plants. Life cycle analysis determines the environmental burdens for all operations required to fairly compare the study scenario (scCO2-EGS) and the reference scenario (conventional coal). The ensemble of operations required for accurate comparison is called the system boundary. Here, the system boundary includes coal mining, coal transportation to the power plant and all operations at the power plant. For the scCO2-EGS, the system boundary also includes CO2 capture, compression to scCO2, transportation to the scCO2-EGS site and power production. The activities just described are called the 'fuel cycle' in this report. Energy and emissions for constructing the power plant infrastructure is called the 'plant cycle' and is also included. We exclude all aspects of power transmission to the consumer under the assumption that energy consumption (loss) for transmission will be the same for both the study scenario and the reference scenario.
The LCA methodology computes results per unit of product or activity in the study, called the functional unit for the LCA. Since the geothermal power cannot be produced without a supply of scCO2 from an associated fossil power plant, we analyze the combined system, scCO2-EGS plus fossil power plant, and compute the total emissions and energy demand from both power plants when producing one MWh of electricity (figure 1). The functional unit for this study, one MWh electricity, is the sum of the scCO2 electrical energy plus the coal-fired electricity.

Figure 1. System diagram for scCO2-EGS power. A fossil power plant supplies the scCO2 feedstock that is consumed (sequestered) during scCO2-EGS power generation. The functional unit, 1 MWh of electricity before transmission, includes power from both coal and scCO2-EGS power plants.
Download figure:
Standard imageThis study employed the GREET (Greenhouse gases, Regulated Emissions and Energy use in Transportation) model developed at Argonne National Laboratory with support from the US Department of Energy's (DOE's) Office of Energy Efficiency and Renewable Energy. GREET is a publicly available LCA tool that investigates numerous fuel and vehicle cycles (Wang 1999a, 1999b, GREET 2011). GREET computes fossil, petroleum and total energy use (including renewable energy in biomass), emissions of greenhouse gases (CO2, CH4 and N2O) and emissions of six combustion pollutants: carbon monoxide (CO), volatile organic compounds (VOCs), nitrogen oxides (NOx), sulfur oxides (SOx), particulate matter with a diameter below 10 μm (PM10) and particulate matter with a diameter below 2.5 μm (PM2.5). GREET includes electrical power generation from fossil fuels, nuclear fuels, and from renewable energy sources including solar and geothermal power production with hydrothermal and water-EGS technologies. Through this study, the GREET model was expanded to include scCO2-EGS system.
The analysis presented in this work focused on the high-consumption scenario but examined a wide range of scCO2 consumption rates. In the high-consumption scenario, an scCO2 pipeline interconnects a fossil power plant and the scCO2 geothermal power plant. The infrastructure materials for the scCO2 pipeline interconnecting the fossil and scCO2 plants and the energy consumption for its operation are also included.
4. Model
4.1. Reservoir development, size and lifetime
Brown (2000) considers a reservoir in Precambrian crystalline rock developed by hydraulic fracturing with scCO2. The pore fluid is dissolved in the scCO2 and removed over a few weeks. We accounted for energy and emissions associated with plant material production, plant construction, well construction, well field stimulation and plant to well piping (Sullivan et al 2010).
Turaga et al (2011) modeled thermal drawdown as a function of circulation given the thermal conductivity, density, specific heat capacity, and thermal diffusivity of rock, water and scCO2 at 200 °C. They concluded that circulation rates must be restricted to below 100 kg s−1 in a reservoir volume of 0.125 km3 and fraction spacing must be less than 100 m for reservoir lifetime to reach 30 yr. Remoroza et al (2011) reached similar conclusions regarding drawdown based upon a 3D simulation. Brown (2000) assumes a 20 yr reservoir lifetime and Dunn (2010) assumes 30 yr. In this analysis, we assume 30 yr lifetime for both the plant and the field.
4.2. Carbon capture
Ciferno (2006) reviewed amine-based CO2 capture for retrofits to existing coal power plants. CO2 capture reduces CO2 emissions but decreases plant efficiency because heat is diverted from power generation to regeneration of the amine absorber. This change increases the energy consumption per net produced power, also known as the heat rate, expressed in BTU/kW h. Table 1 displays the heat rate from Ciferno for several capture efficiencies and demonstrates a substantial increase in heat rate associated with carbon capture. The heat rate listed includes parasitic losses to CO2 compression, 0.12 kW h/kg-CO2.
Table 1. Summary of amine-based carbon capture in a coal power plant retrofit. The heat rate is from Ciferno (2006). The last two columns are computed from GREET (2011) as described in the text.
| Capture rate (%) | Heat rate, LHV BTU/kW h | CO2 emissions g-CO2/kW h | CO2 captured g-CO2/kW h |
|---|---|---|---|
| 90 | 13 425 | 155 | 1399 |
| 70 | 12 210 | 424 | 990 |
| 50 | 11 203 | 649 | 649 |
| 30 | 10 364 | 840 | 360 |
| 0 | 9 359 | 1084 | 0 |
Emissions for power generation with carbon capture is modeled in this study from the emissions for a coal-fired power plant in GREET (2011). It is assumed that carbon capture will require sulfur removal upstream and that particulates will be removed in the overall process. Therefore, PM10,PM2.5 and SOx emissions are set to zero. Energy required for SOx and particulate control is negligible (Doctor 2011). All other fuel-cycle emissions and energy consumptions are computed by scaling the GREET (2011) values by the heat rate in table 1 relative to the GREET heat rate without carbon capture. Carbon dioxide emissions are obtained by multiplying the carbon capture efficiency and the scaled up CO2 emissions. The results are shown in the last two columns of table 1.
4.3. scCO2 consumption
Brown (2000) used experience from water-EGS field testing at Fenton Hill to predict 3 kg s−1 of scCO2 consumption for a 10 MW power system (1080 kg scCO2 MWh−1) while Pruess (2007) estimates consumption from 5% consumption of 22 kg s−1 scCO2 flow per MW (3960 kg scCO2 MWh−1). The average, 2520 kg scCO2 MWh−1 is used in this study.
The shares of coal and geothermal electrical energy adding up to the 1 MWh functional unit depend upon the CO2 capture rate at the fossil plant and the scCO2 consumption rate. We begin by holding the scCO2 consumption rate fixed at 2520 kg scCO2 MWh−1 and varying the capture rate. Later, we will explore the effect of changing the consumption rate. The scCO2 consumption rate can be combined with energy use data in table 1 to match the coal and scCO2-EGS power generation so as to balance scCO2 production and consumption rates. See table 2. For example, in table 2, 1.80 MWh of coal-fired electricity are required to supply the scCO2 required for 1 MWh of scCO2-EGS power when the carbon capture efficiency is 90%. Therefore, coal-fired generation contributes 64% and scCO2-EGS generation contributes 36% of the 1 MWh functional unit of total delivered electricity when the carbon capture efficiency is 90%.
Table 2. Coal electricity required to produce enough CO2 for 1 MWh of scCO2-EGS electricity assuming 2520 kg-scCO2/MWh-EGS.
| Capture rate (%)a | Coal electricity MWh/MWh-EGSb | Total electricity MWhc | Effective heat rate BTU/kW hd |
|---|---|---|---|
| 90 | 1.80 | 2.80 | 8631 |
| 70 | 2.55 | 3.55 | 8766 |
| 50 | 3.88 | 4.88 | 8909 |
| 30 | 7.00 | 8.00 | 9068 |
| 0 | 9359 |
aFraction of CO2 captured at the coal power plant. The balance is emitted to the air. bCoal electricity generated while capturing enough CO2 to meet demand for 1 MWh scCO2-EGS. cTotal electricity generated, coal plus scCO2-EGS. dBTU of coal per total electricity generated.
Table 2 also permits the computation of fossil energy per total power produced, here called the 'effective heat rate', and shown in column 4. This value is obtained by scaling the coal heat rate in table 1 by the coal electricity, divided by the total electricity. Using the first row as an example, at 90% CO2 capture efficiency, 1.80 MWh of coal electricity requiring 13 425 BTU kW h−1 (table 1) consumes 24 165 BTU. A total of 2.8 MWh is produced (1.8 MWh coal, 1.0 MWh scCO2-EGS). The effective heat rate is, 24 165 BTU/2.8 MWh = 8631 BTU kW h −1. The effective heat rate is the coal consumed per total electricity (coal plus scCO2-EGS) produced.
4.4. Pipeline requirements
4.4.1. Materials.
Pipelines for scCO2 delivery require materials for construction (plant cycle LCA) and require power for operation (fuel cycle LCA). Both of these depend upon the transportation distance. Two references (Dooley et al 2009, ICF 2009) discuss pipeline requirements in the US for carbon capture and sequestration (CCS). Dooley et al (2009) estimates tens of miles between source and sink. ICF (2009) considers scCO2 pipeline infrastructure requirements that would be required to meet putative US CO2 reduction mandates; therefore, the ICF analysis required estimation of pipeline distances to connect CO2 sources to geological sequestration sites. They estimated an average distance of 50 miles per power plant if a common network infrastructure were built.
The ICF (2009) estimate is difficult to carry into the scCO2-EGS analysis because the ICF analysis attempted to minimize pipeline costs to achieve a net US sequestration target. Therefore, they selected power plants proximal to sequestration sites without regard to whether the sequestration site was also a suitable geothermal resource. Indeed, most of the power plants are in the East and Midwest. Also, in these regions, power plants are more closely spaced than in the West where most US geothermal resources are found. Since the power plant areal density is considerably less in the West (reducing opportunities for shared pipeline infrastructure), 50 miles seems too low for estimating transportation distances for scCO2-EGS. A full analysis of the distance from source to geothermal sink is beyond the scope of this analysis and a distance of 100 km (62 miles) is assumed. It will be seen that this parameter has little effect on scCO2-EGS LCA.
Supercritical CO2 pipelines require API 5L grade X65 or X70 pipeline carbon steel, if dry, but, if moisture were present, then stainless steel would be required. Economic flow velocities range between 1.5 and 2 m s−1 (Element Energy Limited 2010). Typical pressures are approximately 15 MPa (ICF 2009).
Analysis of scCO2 pipeline configurations (ICF 2009) demonstrated that the pipeline steel use (kg steel m−1) per flow of scCO2 (kg scCO2 s−1) is independent of pipeline diameter: pipeline steel use increases with pipeline diameter, but so too does the pipeline flow and the two effects cancel. Therefore, if steel is the overwhelming infrastructure material for the pipeline, then the pipeline configuration details will not affect the present analysis. The pipeline configurations in ICF International 2009 required 0.74 kg steel m−1 for each kg s−1 of scCO2 flow when the scCO2 velocity was 1.5 m s−1. As an example, a 16'' outside diameter trunk pipeline (0.42'' wall thickness) uses 104 kg steel m−1 and, when operating with 1.5 m s−1 velocity flow across its 0.385 m inside diameter, transports 140 kg scCO2 s−1 which would support 200 MW of scCO2 power generation consuming 2520 kg scCO2 MWh−1.
Gurgenci (2009) comment that pipeline, transmission lines and power generation plant must be relocated every 15 yr (presumably because of thermal drawdown). Assuming each deployment shifts the system 5 km, then the pipeline requirements will be the main trunk (100 km) amortized over the carbon flow accrued over the assumed 30 yr lifetime plus an additional 5 km of pipeline every 15 yr. We neglect this additional 5 km.
4.4.2. Pipeline pumping.
Pumping power is tabulated in ICF (2009) for several scenarios corresponding to several sequestered masses. If these powers support the average 50 mile transport distance studied in ICF (2009), then the average pumping power from that reference is 3.83 × 10⁻⁵ kW h kg−1 km−1. The default value in GREET (2011) is 3.18 × 10⁻⁵ kW h kg−1 km−1. This analysis uses the default GREET value to facilitate comparison with other GREET analyses.
4.5. scCO2 infrastructure materials on site
Table 2a in Sullivan et al (2010) displays the material masses used to construct EGS wells and shows the materials for surface piping between well and plant. The surface piping is only 1.7%, 4.1% and 1.7% of the cement, diesel and steel for well construction. Therefore, differences in well spacing between scCO2 and the EGS-50 case in Sullivan et al will have little effect on the materials analysis for scCO2 compared to water-EGS. We make the approximation that the scCO2 well casing diameters and properties are the same for scCO2-EGS wells and for water-EGS wells of equal depth. For these reasons, this analysis uses the infrastructure materials for the EGS-50 case in Sullivan et al (2010) for the scCO2 case. Energy and emissions from infrastructure materials were extracted from GREET 2.7 for the EGS scenario with 6 km wells with 3 liners. The steel requirements were increased to account for the 100 km scCO2 pipeline. The result is in table 3. As in other analyses, we neglect infrastructure materials to connect the scCO2-EGS system to the grid even though it may be remote (Gurgenci 2009). While infrastructure related emissions determine the life cycle emissions for water-EGS, it will be seen below that scCO2-EGS emissions are dominated by the fuel cycle at the coal power plant. Therefore, further sensitivity analysis was not considered for the scCO2-EGS infrastructure.
Table 3. Life cycle energy use and emissions for power plant infrastructure computed by adding 100 km of scCO2 pipeline to values for water-EGS in Sullivan et al (2010). Despite the 100 km length, the pipeline has a minor effect on power plant infrastructure related emissions and energy use.
| Water-EGS | scCO2-EGS | |
|---|---|---|
| Energy use: BTU per MMBTU electricity | ||
| Total energy | 50 834 | 51 840 |
| Fossil fuels | 46 473 | 47 417 |
| Coal | 15 178 | 15 469 |
| Natural gas | 17 995 | 18 634 |
| Petroleum | 13 300 | 13 314 |
| Total emissions: grams per MMBTU | ||
| VOC | 0.409 | 0.416 |
| CO | 2.379 | 2.399 |
| NOx | 6.991 | 7.063 |
| PM10 | 4.786 | 4.844 |
| PM2.5 | 1.778 | 1.796 |
| SOx | 6.942 | 7.036 |
| CH4 | 6.131 | 6.283 |
| N2O | 0.036 | 0.037 |
| CO2 | 4873 | 4935 |
| CO2(w/C in VOC and CO) | 4876 | 4938 |
| GHGs | 5040 | 5106 |
5. Results
Figure 2 shows the fossil energy consumption involved in scCO2-EGS power production before transmission. In the figure, total electricity refers to the sum of the electricity from the upstream coal power plant and the electricity from the scCO2-EGS power plant. Fossil energy for coal-based electricity (with and without carbon capture) is shown for comparison. In figure 2, the scCO2-EGS share is the fraction of the total electricity that was produced by the geothermal plant. Note that fossil fuel use from infrastructure materials (0.047 MWh MWh−1) contributes less than 2% to the total fossil energy use in figure 2, illustrating that infrastructure material related energy use is a minor effect for scCO2-EGS.
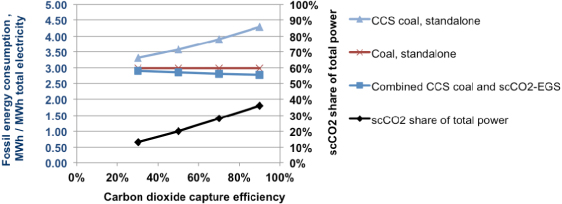
Figure 2. Fossil energy consumption per total electricity produced. Carbon capture (CCS) increases fossil energy consumption for a standalone coal power plant (triangles). The electricity generated with the captured CO2 by the scCO2-EGS increases the total electricity generated reducing the net fossil energy consumed per total electricity generated (squares) to that of stand alone coal (red crosses).
Download figure:
Standard imageFigure 3 shows the GHG emissions for the system, fuel cycle plus plant cycle. GHG emissions are reported as grams CO2 equivalent (gCO2e) by combining CO2,CH4 and N2O scaled by their global warming potentials (IPCC 2007). The CO2 emissions include CO2 from degradation of CO and degradation of volatile organic compounds, both of which have short lifetimes in air. The plant-cycle emissions are broken out in figure 3 and are seen to be minor. At 90% carbon capture efficiency, plant-cycle emissions are 11% of the total GHG emissions. This falls to 5% for 70% carbon capture efficiency.
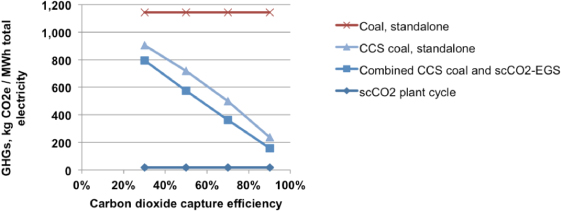
Figure 3. GHG emissions before transmission for scCO2-EGS power. All curves include plant cycle (infrastructure construction) emissions of 17 kg CO2e MWh−1 (5106 gCO2e/MMBTU). The plant cycle curve shows that infrastructure associated emissions are a minor contribution to the total.
Download figure:
Standard imageFigure 4 explores the effect of the scCO2 consumption rate since this is a key parameter that is poorly known. The scCO2 consumption rate affects the proportion of coal power to scCO2-EGS power and therefore affects the total fossil energy and emissions for the combined system. Figure 4 examines the specific case of 90% carbon capture efficiency. At 3100 kg-scCO2 consumed per MWh of total electrical energy produced, the fossil energy consumption is equal to conventional coal power although the GHG emissions are only 15% of conventional coal-fired electricity production. As mentioned above, the shares of coal and geothermal electrical energy adding up to the 1 MWh functional unit depend upon the CO2 capture rate at the fossil plant and the scCO2 consumption rate. Figure 5 displays the dependence upon both variables via a contour plot.
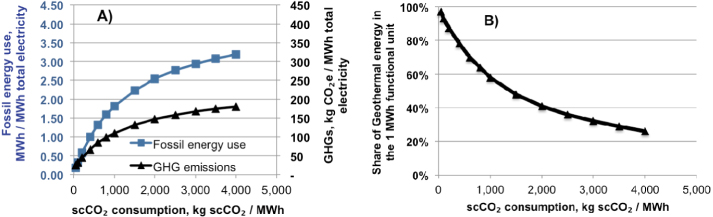
Figure 4. (A) Effect of scCO2 consumption rate on fossil energy consumption and GHG emissions assuming 90% carbon capture efficiency for producing the scCO2. (B) The fraction of the 1 MWh functional unit arising from geothermal energy as a function of the scCO2 consumption rate. The fossil energy share is 1 minus the geothermal share. Figure 4(A) can be fit with a cubic polynomial, GHGs = 22 + 0.12m − 3.6 × 10⁻⁵m2 + 4.0 × 10⁻⁹m3 where m is the scCO2 consumption rate in kg scCO2 MWh−1.
Download figure:
Standard image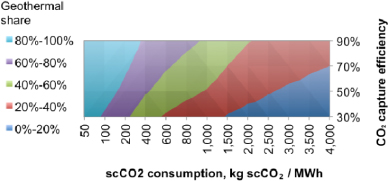
Figure 5. Fraction of the 1 MWh functional unit arising from geothermal energy (geothermal share) as a function of the scCO2 consumption rate and CO2 capture efficiency.
Download figure:
Standard image6. Discussion
The purpose of this study was to identify and explore the key parameters affecting the life cycle energy use and GHG emissions associated with producing geothermal electricity when scCO2 is used as the thermal fluid. The technology has not yet been demonstrated and, thus, is largely theoretical. Therefore, we have used high-level parameters like the CO2 capture efficiency at the coal power plant and the scCO2 consumption rate at the geothermal site as the study parameters rather than mechanism level parameters like flow rates, mineralization rates, scCO2 pressure and depth, etc, to describe the scCO2-EGS system operating in steady state after the reservoir is fully charged. Had we attempted a mechanistic model, many parameters would have been introduced, like circulation rates and scCO2 density, which would be speculative at this time, yet they have little direct bearing on an LCA analysis. Our approach expands the applicability of the study because by articulating the essential parameters from which life cycle results may be calculated, any particular mechanistic model, perhaps for a specific site, can estimate LCA results by computing the essential parameters described in our study. On the other hand, had we started from a mechanistic model, it would not have been clear how to apply the results to other circumstances and sensitivity analysis would have been unduly complicated.
Our first result is that the few parameters introduced here, e.g., scCO2 consumption expressed per unit of geothermal electrical energy produced, heat rate for the fossil power source generating the scCO2,CO2 capture efficiency, are adequate to support a high-level life cycle analysis. Having established a method to compute LCA results based upon this abstraction of the scCO2-EGS system, we then explored broad ranges of the key parameters. Figures 2–5 constitute a sensitivity analysis for this study, mapping out LCA results as a function of these poorly known parameters.
The second major result is that the scCO2 geothermal power production must be considered in combination with the upstream scCO2 production since both produce electricity and, thus, both contribute to the electrical energy based functional unit. The energy consumption and emissions from electricity production associated with top-off scCO2 production account for almost all of the emissions in the combined system. In particular, the emissions associated with plant infrastructure, including pipeline, are small in comparison. Even with 100 km of steel pipeline, the pipeline contributed only 1% of the plant-cycle GHG emissions in table 3. The 100 km pipeline length assumption, then, had little effect on the analysis. Therefore, neglecting pipeline construction for periodic site relocation (Gurgenci 2009, mentioned in section 3.2.1) will have minimal effect on LCA results.
The analysis presented so far computed the prompt emissions associated with producing 1 MWh of total electrical energy as a function of the scCO2 consumption rate. If a portion of the sequestered CO2 can leak to the atmosphere from underground over time, then there will also be emissions in future years that should be considered. We compute future emissions associated with producing 1 MWh total electrical energy at time t = 0. This is done by adding the emissions from leakage of a portion of the 2520 kg added to the reservoir to produce the 1 MWh. An additional amount is also added to account for leakage of the initial reservoir charge, a burden shared over all power produced over the facility lifetime. We evaluate leakage over 100 yr and assume a production period of 30 yr. The production period is the period over which the reservoir is assumed to maintain sufficient production prior to stopping production. This is an arbitrary assumption taken to allow illustration of the computation, but in reality the reservoir may be idled for a period because of thermal drawdown after its initial utilization and then brought back to service.
The CO2 leakage rate to the atmosphere depends upon geology, site layout and construction methods. Lacking empirical data at scale for CO2 leakage for EGS geology and EGS construction, we choose to consider constraints on total leakage that would guide site choice and design: White et al (2003) discussed constraints on surface leakage rates that are required for carbon sequestration to be effective at reducing atmospheric CO2 levels, suggesting limits from 0.01% to 0.1% of the total reservoir CO2 mass per year. We consider leakage rates of 0.01%, 0.1% and 1% yr−1. We assume leakage to be proportional to the mass underground so that dM/dt =− aM(t) where a is the leakage rate (yr−1) (Hepple and Benson 2002).
The assumptions above are not the only possible treatment and many uncertainties surround this part of the analysis. This computation is presented to illustrate how the basic result for prompt emissions can be included in models of delayed emissions from the reservoir and is used to estimate the scale of the possible consequences.
The initial charge of the reservoir, M0, is a shared burden for all subsequent power production. The cumulative mass leaked from the initial reservoir charge by time t is M0[1 − e−at]. This leaked mass is amortized over the total power produced during the 30 yr production period by simple (straight line) division. Other treatments are possible, including various discounting methods and consideration of dependence of leakage on pressure and time. The treatment used here suffices to assess the scale of the effect. If 5000 tons of scCO2 were required in the reservoir per MW of EGS capacity (Brown 2000), then for the corresponding 2.65 × 10⁵ MWh produced over the production period, the leaked CO2 from the initial charge in the reservoir amounts to 0.18, 1.8 and 12 kg/MWh-EGS for leakage rates of 0.01%, 0.1% and 1% yr−1.
Each MWh of EGS power produced stores an additional 2520 kg of scCO2 to be added to the reservoir. The cumulative non-prompt emissions at time t after the production of one MWh of electrical energy is 2520[1 − e−at]. This evaluates to 24, 240 and 1590 kg CO2 per MWh-EGS for leakage rates of 0.01%, 0.1% and 1% yr−1.
The results just computed are per MWh of scCO2 electrical energy, but we wish a result on a total power basis. For carbon capture efficiency of 90%, one MWh of total electrical energy requires 0.36 MWh of scCO2-EGS (table 2). Table 4 displays the prompt emissions of 159 kg CO2e MWh−1 with the various leakage emissions just computed after scaling to a total energy basis. For low leakage rates (0.01%), a limit proposed by Hepple (2002) to achieve stabilization at 350, 450 and 550 ppmv atmospheric CO2, the leakage effect is small over 100 yr compared to the prompt emissions but at 0.1% leakage from the surface, the prompt emissions are increased by 55% while at 1% leakage, the total emissions are substantially higher than the prompt.
Table 4. Additional contributions to emissions related to leakage at the surface when one MWh of geothermal electrical energy is produced. Contributions from leakage over 100 yr are considered.
| Surface leakage rate yr−1 (%) | Prompt emissions kg CO2ea | Leakage from initial reservoir charge kg CO2b | Leakage from scCO2 increment kg CO2c | Total kg CO2e |
|---|---|---|---|---|
| 0.01 | 159 | 0.064 | 8.6 | 168 |
| 0.1 | 159 | 0.64 | 86 | 246 |
| 1 | 159 | 4.3 | 572 | 735 |
aThese are from the upstream power plant supplying make up scCO2. bA burden shared equally by all generated power by flat line amortization. cEmissions from leakage of the 2540 kg scCO2 added to the reservoir to produce 1 MWh-EGS.
The surface leakage computations did not apply discounting or consider other approaches to studying delayed emissions: there is substantial uncertainty concerning how to handle future emissions associated with present day activities when doing life cycle analysis, e.g., whether discounting or other methods should be applied (Levasseur et al 2012, O'Hare 2009, Cherubini et al 2011). Such computations should be performed in the future when more details are in hand regarding leakage rates, reservoir size and operational lifetime.
The analysis considered coal-fired power generation because of its ubiquity. Gas fired power plants can have lower direct CO2 emissions, e.g., natural gas combined cycle (NGCC) power plants have roughly half the GHG emissions of coal. We examined a scenario in which NGCC replaces coal, 95% carbon capture and 2520 kg-scCO2 MWh−1 consumption. Emissions were determined for natural gas production via the data in GREET (2011) which comprise a mixture of 77% conventional NG plus 23% shale gas NG. In GREET (2011), emissions for shale gas production are comparable to those for conventional NG production. The life cycle fossil energy use changed from 2.8 to 2.7 MWh MWh−1 and the life cycle GHG emissions changed from 160 to 201 kg CO2e MWh−1. The surprising increase in GHG emissions when NGCC is used to supply CO2 arises because of higher life cycle methane emissions for NGCC versus coal. The CH4 emissions occur during procurement of the natural gas, not during its combustion for power generation.
Power will be required for circulation of the geothermal fluid. Circulation power will be provided from the geothermal plant itself and is a parasitic loss that reduces the net power from a given investment in wells and associated equipment. For this reason, in our treatment, circulation power affects the plant-cycle (infrastructure materials) rather than the fuel cycle when the plant cycle is expressed on a net MWh basis. Plant-cycle GHG emissions were roughly 10% of the total. Errors from neglecting the circulation power affect only this 10% fraction, mitigating the effect of circulation power uncertainty on the final result. Since the plant cycle emissions in this analysis were adopted from the water EGS case, the question is whether scCO2-EGS has higher or lower circulation power than does water-EGS. There are compensatory effects between the lower heat capacity of scCO2, which requires higher circulation to recover a given amount of heat, and the higher permeability of rock for scCO2 flow, which reduces the pressure drop. Further, the scCO2 thermal siphon effect assists flow. When considered on the basis of required pumping energy, Brown (2000) estimated net heat production for scCO2 is comparable to that of water. Further analysis is required, but this suggests that using the water-EGS plant cycle model as a proxy for the scCO2 plant cycle model is a good approximation with regard to the effects of circulation power and the results reported here are unlikely to change substantially when circulation pumping is considered in more detail. For example, if scCO2-EGS circulation saved 5% of gross geothermal power compared to water EGS, then the infrastructure related emissions in table 3 would change from 5106 gCO2e/MMBTU to 4863 gCO2e/MMBTU because the same amortized infrastructure emissions would be associated with a 5% larger nameplate power capacity. Carried through to the final result for the case of 90% capture efficiency and 2520 kg scCO2 MWh−1 consumption, life cycle emissions change from 159.1 to 158.8 kg CO2e MWh−1. We have had to use more significant figures than the data warrant in order to display the small change. The 5% change was selected arbitrarily for illustration, but note that Butler et al (2004) estimates that the total parasitic power loss for circulation in water EGS is 5%–22% of gross power. Even for a 22% change in nameplate capacity, the result only changes to 157.9 kg CO2e MWh−1. Thus, even large changes in circulation energy demand have little effect on the results presented here.
The scCO2-EGS reservoir must be filled before operation, but the emissions for producing the initial scCO2 charge are small and correspond to the emissions from producing and delivering the scCO2. We estimate that the effect of neglecting the emissions from filling the reservoir is to underestimate GHG emissions by 1% for the 90% carbon capture efficiency case.
Table 2 shows that, although the underlying coal-fired electricity heat rate depends upon the CO2 capture rate and is impaired by the CO2 capture (table 1), the effective heat rate for the combined coal scCO2-EGS system more than makes up for the CO2 capture. Figure 2 shows that life cycle fossil energy consumption for the combined CCS and scCO2-EGS power plants is less than the fossil energy consumption for stand alone CCS coal and less than even conventional coal-fired power generation. As a result, the GHG emissions for the combined power plants in figure 3 are lower than those for standalone CCS.
Reading figure 4 requires some care because the share of power from geothermal power varies across the abscissa. At low scCO2 consumption, the geothermal plant provides most of the power because the geothermal plant is able to recirculate the scCO2 many times before it is absorbed below ground. Thus, less scCO2 is required from upstream and less coal-fired power is present in the mix. If the consumption rate is low enough that an on-site power plant can meet the demand, this may help deployment by eliminating the pipeline, but if scCO2-EGS is more useful by enabling CCS for the upstream power plant, then the low consumption rate reduces the ability to treat coal-fired emissions.
As analyzed here, and for the assumed 2520 kg scCO2 MWh−1,scCO2-EGS acts like an additional power cycle for the associated coal-fired plant. Renewable energy is being used to offset energy losses for CO2 capture. Deployment will be limited by the number of situations in which a coal power plant is located close enough to a geothermal resource. By contrast, water-EGS must have adequate water resources nearby and all of the water-EGS power is from renewable geothermal power.
Future work should consider a more realistic model of scCO2 consumption, in particular by considering the change in uptake rate over time. Figure 4(A) was fit with a polynomial to give emissions as a function of scCO2 consumption. The fitted curve, displayed in the figure legend, can be used by interested readers to evaluate temporal models of scCO2 consumption. A recent report from the National Research Council suggests that there is potential for induced seismicity when large fluid volumes are injected for carbon capture and sequestration (NRC 2012). EGS geology may be different than CCS geology and there are no data for EGS geology concerning induced seismicity. Thus, we have not considered the implications in this work.
7. Conclusions
Geothermal systems utilizing scCO2 require a constant supply of scCO2 to make up for consumption underground (sequestration). We considered scenarios that used combustion of fossil fuel in coal-fired power plants to meet the demand. From a life cycle perspective, since the scCO2 from the power plant is an input for the scCO2-EGS power plant, it makes sense to combine the two power-generating operations and compute total emissions for a functional unit defined by the total power of the combined system: there is only one product (electricity), so it makes little sense to distribute emissions between the coal and geothermal operations since distribution methods introduce methodological uncertainty into life cycle analyses.
When the scCO2 was supplied by a coal-fired power plant with carbon capture, the power generated from the scCO2-EGS operation made up for the heat rate increase (degradation) at the coal-fired power plant resulting from parasitic consumption of heat and power by the carbon capture operation. This result was true for carbon capture efficiencies ranging from 30% to 90% (the range of data available). For 90% capture efficiency, the combined system consumed less fossil fuel than did conventional coal-fired power generation as long as the scCO2 consumption rate was below 3100 kg-scCO2 MWh−1 of geothermal power. The ratio of the emissions from the combined system to the emissions from conventional coal was only 15% when the reservoir was hermetic or leaked less than 0.01%, but could be substantially higher (especially when long-term effects of CO2 are a concern) depending upon the leakage rate. Thus, as for other forms of carbon sequestration, imperfect storage leads to consideration of tradeoffs between the costs and benefits of emissions in the present versus emissions in the future since, for a leaky reservoir, some 'stored' CO2 will eventually return to the atmosphere.
The potential for sequestering a substantial fraction of coal power generated CO2 emissions with scCO2-EGS in the US is likely limited because of the distributed nature of the existing coal plant infrastructure and the need for proximity to a geothermal resource. Nevertheless, scCO2-EGS consumption of coal power CO2 could provide an energy and emission value when fossil fuel power plants and geothermal resources coincide, cost permitting.
Acknowledgments
The Geothermal Technologies Program in the US Department of Energy's Office of Energy Efficiency and Renewable Energy sponsored this work. Argonne National Laboratory is a DOE laboratory managed by UChicago Argonne, LLC, under Contract No. DE-AC02-06CH11357. We are grateful to Arlene Anderson of the Geothermal Technologies Program for her guidance and input and are also grateful to the reviewers for comments that substantially improved the manuscript.