
Abstract
We perform engineering cost analyses of systems capable of delivering 1–5 million metric tonnes (Mt) of albedo modification material to altitudes of 18–30 km. The goal is to compare a range of delivery systems evaluated on a consistent cost basis. Cost estimates are developed with statistical cost estimating relationships based on historical costs of aerospace development programs and operations concepts using labor rates appropriate to the operations. We evaluate existing aircraft cost of acquisition and operations, perform in-depth new aircraft and airship design studies and cost analyses, and survey rockets, guns, and suspended gas and slurry pipes, comparing their costs to those of aircraft and airships. Annual costs for delivery systems based on new aircraft designs are estimated to be $1–3B to deliver 1 Mt to 20–30 km or $2–8B to deliver 5 Mt to the same altitude range. Costs for hybrid airships may be competitive, but their large surface area complicates operations in high altitude wind shear, and development costs are more uncertain than those for airplanes. Pipes suspended by floating platforms provide low recurring costs to pump a liquid or gas to altitudes as high as ∼ 20 km, but the research, development, testing and evaluation costs of these systems are high and carry a large uncertainty; the pipe system's high operating pressures and tensile strength requirements bring the feasibility of this system into question. The costs for rockets and guns are significantly higher than those for other systems. We conclude that (a) the basic technological capability to deliver material to the stratosphere at million tonne per year rates exists today, (b) based on prior literature, a few million tonnes per year would be sufficient to alter radiative forcing by an amount roughly equivalent to the growth of anticipated greenhouse gas forcing over the next half century, and that (c) several different methods could possibly deliver this quantity for less than $8B per year. We do not address here the science of aerosols in the stratosphere, nor issues of risk, effectiveness or governance that will add to the costs of solar geoengineering.
Export citation and abstract BibTeX RIS

Content from this work may be used under the terms of the Creative Commons Attribution-NonCommercial-ShareAlike 3.0 licence. Any further distribution of this work must maintain attribution to the author(s) and the title of the work, journal citation and DOI.
1. Introduction
Geoengineering may be a means to reduce the climate risks while long-term emissions reduction actions take effect. Geoengineering has been defined as: 'the deliberate large-scale manipulation of the planetary environment to counteract anthropogenic climate change' (Royal Society 2009).
One approach is to disperse particulates at high altitude to reduce the effective solar flux entering the atmosphere (Budyko 1982). Sulfur compounds have been proposed, similar to the compounds emitted during volcanic eruptions that have been found to cool surface temperatures (Keith 2000, Crutzen 2006, Rasch et al 2008a, 2008b). Other particulates may also be suitable (Keith 2010).
This paper does not address the effectiveness, risks or social implications associated with the deployment of aerosols to the stratosphere for solar radiation management (SRM). We make rough order-of-magnitude estimates of the costs of transporting a million tonnes of material to the stratosphere for three reasons. First, the basic feasibility of SRM with current technology at low cost has been disputed (Angel 2006, Robock 2008). We think this work demonstrates clearly that it is feasible by showing that several independent options can transport the required material at a cost that is less than 1% of climate damages or the cost of mitigation. Removing this uncertainty is relevant whatever one's view about implementation of SRM. Second, economists are beginning to explore cost-effectiveness and perform option value calculations to help understand the role of several types of geoengineering in climate policy (Nordhaus 2008, Moreno-Cruz and Keith 2012). Rough order-of-magnitude costs are needed for their work. Third, political scientists and some policy makers are concerned about unilateral action (Victor et al 2009). Our analysis provides insight into what might be possible—at a purely technical level—even for a small country, assuming it is able to procure the aviation services on an open market. Fourth, some atmospheric scientists are working on various methods for creating and dispersing particles other than simple SO2 injection (Pierce et al 2010, Keith 2010, Rasch et al 2008a, 2008b). Novel schemes might reduce environmental risk or increase the specificity of geoengineering (for example, to target polar regions). A low cost of deployment means that one can explore methods that increase the required mass if they bring some other benefits such as reduced risks.
As early as 1992, estimates were made of the cost of geoengineering (US National Research Council 1992). Previous work (US National Research Council 1992, Robock et al 2009, Katz 2010) has not benefited from systematic cost estimation techniques developed in the high altitude aircraft industry. Here, we make cost estimates based on statistical cost estimating tools used in the aerospace industry. Our goal is not to examine effectiveness or risks of injecting material into the stratosphere for SRM. The goal is rather to compare a range of delivery systems on a single cost basis.
We consider existing aircraft, a new design airplane optimized for the geoengineering task at altitudes up to 30 km, a new design hybrid airship for the same purpose, rockets, guns, and suspended pipes carrying gas or slurry.
The full report on which this paper is based is available as online supplemental data at stacks.iop.org/ERL/7/034019/mmedia.
2. Assumptions about aerosol
In so far as was feasible, we have decoupled our study of delivery technology and cost from specific proposals for stratospheric aerosol geoengineering. It is nevertheless necessary to make some assumptions about (a) the mass flux of material that might be used, (b) the altitude and latitude range at which it would need to be delivered, (c) the density of material when carried as payload, and finally (d) the delivery rate per unit distance along the flight track.
2.1. Mass flux
Initial estimates of the amount of sulfur as SO2 required to provide 1 W m−2 of solar flux change were approximately 1 Mt of sulfur per year (Robock 2008). The effectiveness of geoengineering is strongly dependent on the type of particle and the particle size deployed. Most studies of geoengineering have considered the release of SO2 or H2S gas into the stratosphere where over time ( ∼ 1 month) they are converted to condensable H2SO4. Recent work has shown that directly emitting H2SO4 allows better control of particle size (Pierce et al 2010), so 4 Mt yr−1 of S provides a radiative forcing of ∼ 2.3 W m −2 an amount roughly equivalent to the anticipated growth in radiative forcing over the next half century (IPCC 2007).
2.2. Altitude and latitude
To a rough approximation the circulation of air in the stratosphere rises from the tropics and descends at middle and high latitudes. Lifetime of air in the stratosphere is longest in the 'overworld' corresponding to potential temperatures above that of the tropical tropopause and shorter in the 'middle world' roughly corresponding to altitudes between the tropical and polar tropopause heights where air in the stratosphere mixes more rapidly with tropospheric air (Holton et al 1995). These considerations suggest that long lifetimes and even distribution of stratospheric aerosol can be most easily achieved by delivering material in the tropics above the tropical tropopause (Robock 2008, Pierce et al 2010).
Models of stratospheric aerosol have confirmed this theoretical insight and suggest that delivery between 18 and 25 km altitudes within a latitude range between roughly 30°N and 30°S are sufficient to obtain long aerosol lifetimes (Rasch et al 2008a, 2008b, Pierce et al 2010). We note that Katz (2010) ruled out aircraft in large measure because the paper assumed that aerosols needed to be lofted to 30–50 km, although no supporting argument or citations were provided.
2.3. Density
We assume that material to be delivered is a liquid with a density of 1000 kg m−3 (in our gas pipe analysis, a density of 1.22 kg m−3 is assumed). At liquid densities payload volume is not an important constraint for any of the delivery methods, as a result of the insensitivity to small (factor of two) differences in payload density.
2.4. Linear dispersal rate
If the material to be released is a non-condensable gas such as SO2, then delivery rate will make little difference. If, however, one is releasing solid particles that may agglomerate or condensable gas then there will likely be an upper limit to the linear dispersal rate along the track of the dispersing vehicle, where if dispersal rates exceed this limit agglomeration of aerosol would limit efficiency. For the aircraft and airship calculations we have conformed to the analysis of Pierce et al (2010) that release rate should be of order 0.1–0.003 kg m−1 traveled and adopted a value of 0.03 kg m−1. In general imposing an upper limit on dispersal rate increases cost because it requires the aircraft cruise in (roughly) level flight. We note that some delivery options, such as buoyed hoses cannot achieve the low linear dispersal rates and might be inappropriate for some forms of stratospheric aerosol geoengineering.
3. Cost estimation method
We develop cost estimates of airplanes and other engineered systems through the use of statistical cost estimating relationships (CERs). CERs are based on historical costs of development programs and use one or more input variables such as the empty weight of an aircraft, flight hours per year, or change in velocity (ΔV) of a rocket to solve for a variety of output values such as engineering hours, spare parts cost, or cost of personnel.
The RAND Corporation has developed a set of airplane CERs, the Development and Procurement Costs of Aircraft model, or DAPCA (Boren 1976). This CER model is flexible and well suited to a cost prediction for a variety of airplane types and has been updated over time to incorporate statistics for modern airplanes, improving its accuracy. Research, development, testing and evaluation (RDT&E) costs are modeled using an inflation-updated version of the original RAND model. Raymer's (1999) modified version of the DAPCA model is used as the basis for the RDT&E cost analysis for airplanes and airships. The basis for the cost models is given in section 3 of the supplementary data (available at stacks.iop.org/ERL/7/034019/mmedia).
Fuel costs are estimated from the flight time. The duration of the cruise leg is determined from aircraft payload mass, cruise speed and desired release rate of the payload. For existing aircraft, the fuel burn rate (in weight per hour) is determined and used to solve for the fuel weight for each sortie. For new airplane designs, an engine model is used to determine the thrust specific fuel consumption for the engines, then the thrust required and the mission profile are used to determine the fuel weight for the sortie. The peak 2009 jet fuel price paid by Air Transportation Association airlines of $2.01/gallon or $0.68/kg ($0.31/lb) was used in all calculations (ATA 2009). Fuel is approximately 12% of yearly operations costs for most airplane systems; even a doubling of fuel costs will increase operations costs by only 12%, within the uncertainty bounds of the cost estimates.
Personnel costs (air crews, site managers, maintenance personnel and logistics) are calculated. Labor rates are determined by surveying the rates for various skill sets from several companies on the US General Services Administration website. In some cases, CERs are used to directly determine labor costs. The supplementary data (available at stacks.iop.org/ERL/7/034019/mmedia) gives the fully burdened labor rates used.
For existing airplanes, a single pilot and payload operator (missions under 8 h) are assumed. Their labor rates are multiplied by the number of block hours per year. For new aircraft analysis, flight crews cost per block hour including pilots, copilots, and payload operators, are estimated per the CER given in the supplementary data (available at stacks.iop.org/ERL/7/034019/mmedia).
Similarly, the number of maintenance-man-hours per flight hour (MMH/FH) for the existing aircraft is used to determine the yearly number of maintenance labor hours, this is multiplied by the maintainer labor rate. Additionally, 4 logistic personnel, 1 site manager per site and 1 mission director are assumed to work full time and their labor rates are multiplied by 2080 labor hours in a standard year. For new aircraft analysis, flight crews cost per block hour including pilots, copilots and payload operators, are estimated from a CER based on cruise speed and gross weight, as given in the supplementary data (available at stacks.iop.org/ERL/7/034019/mmedia).
Maintenance-man-hours per flight hour (MMH/FH) is assumed to be 10 h per flight hour for new design aircraft. MMH/FH for existing aircraft are based on values for currently deployed aircraft given in table 1.
Table 1. Costs for existing aircraft with a fleet size required to deliver 1 Mt yr−1. Numbers in parentheses in the right-hand three columns represent costs with modifications to achieve an altitude of 18.2 km (60 kft). 'FY10' refers to the US fiscal year 2010.
| Maintenance hours per flight hour | FY10 acquisition cost ($M) | FY10 modification cost ($M) | Number of aircraft required | Fleet acquisition cost ($B) | Yearly operations cost ($B) | Total yearly cost with depreciation and interest | |
|---|---|---|---|---|---|---|---|
| Large cargo (Boeing 747-400) | 4 | 28a | 30.5b | 14 | 0.8 | 1.0 | 1.1 |
| Zoom climber (Boeing F-15E) | 22 | 50c | 5d | 133 | 7.0 | 7.6 | 8.4 |
| Business Jet (Gulfstream C-37A) | 2 | 23e (used); 60 (new); 55f (modified) | 10g (used); 10g (new); 20g,h (modified) | 66 (43) | 2.1 (3.2) | 2.1 (2.5) | 2.4 (2.7) |
| Airlifter (Boeing C-17) | 4 | 240 | 50.3i | 24 (24) | 0.8 (7.0) | 1.0 (2.8) | 1.1 (3.6) |
| Supersonic Bomber (Rockwell B-1B) | 4 | 300 | 10j | 28 | 8.7 | 3.6 | 4.7 |
a1999 B747-400. bUSAF Civil. Reserve Fleet passenger jet to cargo conversion cost. cEstimated. dCustom drop tanks with dispenser. e1997 G-V with 5672 total time. f$5M credit for selling OEM engines. gTank installation, possible fuel tank modification to carry payload. hNew engines. iFour engines @$11.3M plus $5M for integration. j$10M for integration of tanks, etc.
Approximately 50% of the maintenance costs of an aircraft come from the spare parts, materials and supplies needed to maintain the aircraft. The CER used estimates the spare parts cost per block hour and per sortie based on the cost of the aircraft, the engine cost and the number of engines per aircraft.
A 10% interest rate is used for the cost of capital. The aircraft are depreciated over 20 years, with a residual value of 10% of aircraft initial cost at the end of that period.
4. Existing aircraft
Analysis of existing aircraft focused on estimating the cost of acquiring and operating new or used aircraft. If the fleet size represents a large portion of an aircraft's total production, new aircraft price is used to calculate acquisition costs; otherwise a survey of the used market provided typical used acquisition costs. Costs of conversion of existing aircraft for the geoengineering mission are estimated based on costs of converting passenger aircraft to cargo aircraft. For modified versions of existing aircraft, costs of additional engines are included. Five categories of existing aircraft are examined, each with a representative airplane: large cargo aircraft (Boeing 747-400), zoom climber (Boeing F-15E), business jet (Gulfstream G550/650, C-37A), high performance airlifter (Boeing C-17) and supersonic bomber (Rockwell B-1B). A summary of acquisition and modification costs is in table 1, and details are in section 5 of the supplementary data (available at stacks.iop.org/ERL/7/034019/mmedia).
Existing aircraft are optimized to transport a payload quickly and efficiency over a long distance; they are not optimized for high altitude flight and therefore are poorly suited to the geoengineering mission. Operating existing aircraft at their ceiling, or beyond with expensive modifications, requires lightly loading them, driving fleet size up. The zoom climber type (F-15E) does have high altitude capability, but its size drives fleet size to well over 100 aircraft and fuel consumption makes operations costs the highest of all airplane options examined. Supersonic bombers provide the payload and altitude capability required for geoengineering but the feasibility of acquiring and operating them is questionable and costs are high. Costs grow rapidly as altitude is increased. Figure 1 summarizes the yearly total cost for existing aircraft systems as a function of altitude.
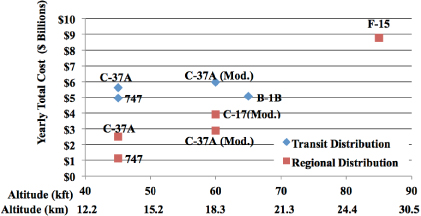
Figure 1. Yearly total cost (operations, depreciation, and interest) for the existing aircraft systems sized to loft payload at a 1 Mt yr−1 rate. For visual clarity, the F-15E has been abbreviated as F-15 and the 747-400 as 747. 'Transit distribution' means an aircraft concept of operations with dispersal taking place during long transit leg between bases. 'Regional distribution' means an aircraft concept of operations with dispersal taking place in a region close to the aircraft base using an out-and-back flight path. Detailed costs for each aircraft examined are provided in the supplementary data (available at stacks.iop.org/ERL/7/034019/mmedia).
Download figure:
Standard image5. New aircraft design
To examine new aircraft designed for the geoengineering mission, we use an aircraft design and sizing code originally developed by Aurora Flight Sciences to examine high efficiency transport aircraft. This code is integrated with the CERs discussed above into a parametric analysis software package developed for high altitude aircraft analysis. The parametric package explores 32 combinations of payload mass (103–104 kg), propulsion type (propeller or turbofan), and number of engines (2–8) at six altitudes between 40 and 100 kft. The optimized designs favor 2 engines over greater numbers as engines are a large contributor to RDT&E and acquisition costs as well as spare parts costs. Details are in section 6 of the supplementary data (available at stacks.iop.org/ERL/7/034019/mmedia).
The analysis of new aircraft platforms assumes a 20 yr aircraft design life, consisting of approximately 7000 flight hours per year or about 2000 cycles. This is comparable to a Boeing 737 with a design life of about 150 000 h and 75 000 cycles. Aircraft designs are optimized by depreciating acquisition costs over this 20 yr life.
5.1. New aircraft cost estimates
Uncertainty arises in the cost estimating relationships for acquisition and operations costs from the sources discussed in section 6.2 of the supplementary data (available at stacks.iop.org/ERL/7/034019/mmedia); the sensitivity analysis bounds for the 13 uncertainties there are in table 11 of the supplementary data (available at stacks.iop.org/ERL/7/034019/mmedia). The new aircraft RDT&E, acquisition costs, and operations costs with upper and lower uncertainty bounds are shown in section 6.3 of the supplementary data (available at stacks.iop.org/ERL/7/034019/mmedia). Combining depreciation and interest for the RDT&E and acquisition costs with yearly operations cost, a yearly total cost can be determined. This yearly cost is plotted as a function of altitude in figure 2. Uncertainty is included, as are the second-lowest cost airplane designs. There is a noticeable increase in cost above 19.8 km (65 kft) due to the increase in engine development costs and fuel costs.
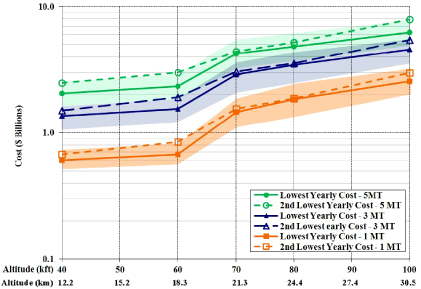
Figure 2. Cost scaling with payload annual mass flux and altitude. New aircraft design yearly cost, including depreciation, interest (both over 20 yr), and yearly operations costs. Note the logarithmic cost scale. The lowest cost design is shown with its associated uncertainty, and the second-lowest cost design is shown as open symbols.
Download figure:
Standard image6. Airships
Airships may provide an attractive solution to the mission of payload delivery because of their large payload capacity and long endurance potential. A key enabling innovation has been the use of internal bladders with adjustable pressure (ballonets) that allow dynamic adjustment of vehicle buoyancy. This allows the vehicle to descend after releasing payload without dumping helium. In recent years the concept of hybrid lift airships (HLA) that generate the majority of their lift from buoyant forces but generate a small percentage dynamically due to aerodynamic forces has emerged as a way to reduce vehicle size and improve ground handling. The HLA technology shows promise for geoengineering operations, but the technology is still in its infancy.
A turboprop engine model is used for propulsion analysis. Costs of developing or modifying engines are computed using a modified version of the engine CER discussed previously. The hull material and construction are assumed to be sophisticated enough to handle a positive pressure differential without deformation. Ballonets that can take 50% of the volume of the HLA with only 1% helium loss per flight are assumed.
Analysis of airships for deployment altitudes of 15, 20, 25 and 30 km with 0, 10 and 20% net heaviness was performed using an optimization model described in section 7 of the supplementary data (available at stacks.iop.org/ERL/7/034019/mmedia), where the cost models and sensitivity analyses are also described.
Yearly total costs were computed in the same manner as described for aircraft (figure 3). The majority of the airship's technical risk comes from extending the technology to high altitude.
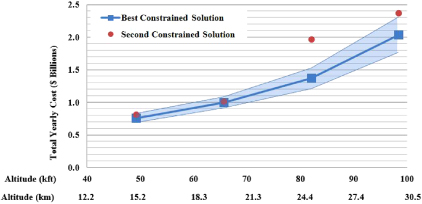
Figure 3. Hybrid lift airship (HLA) design yearly cost, including depreciation, interest (both over 20 yr), and yearly operations costs for 1 MT yearly payload to altitude. The lowest cost design is shown with its associated uncertainty, and the second-lowest cost design is shown.
Download figure:
Standard image7. Rocket powered glider
An analysis of a rocket powered system was carried out for comparison to airplanes. The concept vehicle utilizes off-the-shelf rocket engines or motors to boost a vehicle and payload to altitude. At apogee, wings are deployed to increase the vehicle's lift-to-drag coefficient to allow it to glide at altitude and disperse payload. Once dispersal is completed, the wings retract to allow it to descend quickly.
Rocket glider cost estimates were developed (table 2 and section 8.1 of the supplementary data available at stacks.iop.org/ERL/7/034019/mmedia); however, a preliminary analysis showed this architecture is several orders of magnitude more costly than other systems.
8. Guns
We examined conventional and advanced gun designs, and reexamined a widely cited analysis of guns (US National Research Council 1992) that analyzed the costs of delivering sulfur to the stratosphere for geoengineering. The basis for this analysis is the Iowa-class battleship's 16'' Mark 7 naval gun.
Our scoping analysis of new gun technologies under development that utilize electromagnetics or hydrogen gas suggest that, while these technologies might be preferred for altitudes at or beyond the upper (100 kft) boundary of our study, they would not be preferred for the 50–80 kft altitudes of primary interest (supplementary data section 8.2 available at stacks.iop.org/ERL/7/034019/mmedia). We also note that these new gun technologies are unlikely to be available for non-military uses for some time to come. The 16'' naval guns represent a mature, deployable technology with almost a century of heritage. We consider these, and a modified gun using modern materials. Both were found to exceed the cost of deployment using other systems by one or two orders of magnitude. We give details in section 8.2 of the supplementary data (available at stacks.iop.org/ERL/7/034019/mmedia); a summary is in table 2.
Table 2. Summary of all systems examined. 1 Mt yr−1, all costs in FY10 dollars.
| System type | Altitude (kft) | Altitude (km) | RDT&E and acquisition costs ($B) | Recurring cost per kg (less RDT&E, acquisition costs) | Yearly total cost including depreciation and interest ($B) |
|---|---|---|---|---|---|
| Boeing 747 Class | 45 | 13.7 | $0.8 | $1.00 | $1.1 |
| Modified Gulfstream Class | 60 | 18.3 | $3.2 | $2.15 | $2.9 |
| New design airplane | 40 | 12.2 | $2.0 | $0.30 | $0.6 |
| New design airplane | 60 | 18.3 | $2.1 | $0.35 | $0.7 |
| New design airplane | 70 | 21.3 | $5.6 | $0.56 | $1.5 |
| New design airplane | 80 | 24.4 | $7.8 | $0.60 | $1.9 |
| New design airplane | 100 | 30.5 | $11 | $0.75 | $2.6 |
| Gun (Mark 7 16'') | 91 | 27.7 | $0.34 | $137 | $137 |
| Gun (Modernized Mark 7) | 91 | 27.7 | $0.55 | $18.90 | $19 |
| Hybrid airship | 66 | 20.0 | $4.0 | $0.35 | $1 |
| Hybrid airship | 82 | 25.0 | $5.9 | $0.40 | $1.4 |
| Hybrid airship | 98 | 30.0 | $7.5 | $0.80 | $2 |
| Rocket | 100 | 30.5 | $2300 | $263 | $390 |
| Floating slurry pipe | 70 | 21.3 | $24 | $0.25 | $4 |
| Floating gas pipe | 70 | 21.3 | $59 | $0.63 | $10 |
9. Floating platform with slurry pipe or gas pipe
The practicality of a space elevator is limited by the strength of existing materials. However, the tension in the tether for a stratospheric elevator is less than the yield strength of existing materials, for example, Kevlar. We conducted a preliminary analysis (summarized in table 2) of systems utilizing a lighter-than-air platform to support a pipe, sometimes called a floating platform (Intellectual Ventures 2009, Blackstock et al 2009); see section 8.3 of the supplementary data (available at stacks.iop.org/ERL/7/034019/mmedia).
It is important to note that these systems are purely theoretical and are at or beyond the limits of today's materials and technologies. Analysis was conducted to determine approximate costs for comparison purposes, but uncertainties are very large and true development costs are extremely difficult to predict. Deploying these systems may require significant advancements in fluid mechanics, aerodynamics and material science.
10. Conclusions
Delivery of material required for stratospheric solar radiation management appears to be feasible from an engineering standpoint. Costs are comparable to other large engineering projects or aerospace flight operations (see table 1, figure 1 and section 5 of the supplementary data available at stacks.iop.org/ERL/7/034019/mmedia). Yearly costs including interest payments and depreciation for a 1 Mt annual mass delivery rate are about $1B to $2B for a new airplane design (table 2); for 5 Mt those costs are about $5-8B. Airplane geoengineering operations would be comparable to the yearly operations of a small airline, and are dwarfed by the operations of a large airline like FedEx or Southwest (supplementary data section 3.3 and supplementary data table 2). Airships may provide at most a $0.5B initial cost savings over airplanes and are more attractive from a cost standpoint, but require technologies that have not been demonstrated. Other systems such as new design aircraft and possibly hybrid airships, and rockets (although at large expense) provide access to very high altitude. Suspended pipe systems may be competitive and offer the lowest recurring cost per kilogram, but more thorough analysis is required to determine their true feasibility and refine development cost estimates.
To put these cost in perspective, the costs of climate damages or of emission mitigation are commonly estimated to be 0.2–2.5% of 2030 global GDP (Barker et al 2007) equivalent to roughly $200B to $2000B per year. Our estimates of the cost of delivering mass to the stratosphere—likely to be the most substantial part of the cost of SRM deployment—are less than 1% of this figure. We are not making a cost-effectiveness argument, as we are discussing the cost of SRM deployment alone, not costs associated with its risk side-effects. We emphasize that SRM climate forcing cannot perfectly offset the effects of greenhouse gas climate forcing (Ricke et al 2010) and SRM does nothing to counter ocean acidification. When SRM is considered as one element of climate strategy that also includes mitigation and adaptation, it is meaningful to compare costs and in this sense one can conclude that the cost of SRM deployment of quantities sufficient to alter radiative forcing by an amount roughly equivalent to the growth of anticipated GHG forcing over the next half century is low, though SRM does not thereby mitigate the risks of the accumulated GHGs that extend far beyond this time window.
This does not mean that SRM is a preferred strategy. Such a claim could be sensibly made only after thorough investigation of the implications of risks and of the imperfect climate compensation offered by SRM, and of the costs associated with these issues. It simply means that an attribute of SRM is that it is comparatively inexpensive.
Table 2 summarizes our cost results for all systems examined.
Figure 4 provides a comparison of all the systems yearly costs (including depreciation, interest, and operation). The high altitude capability of guns and rockets comes at an extremely high cost. The large cost associated with developing high altitude airship and airplane systems is lower than the costs of other non-aircraft high altitude systems. Even with generous uncertainties on the new aircraft and airship systems (shown as shaded regions), the costs of rockets and guns is much larger than the cost of aircraft systems. This conclusion differs sharply from that of Katz (2010), who suggests that rockets are less expensive than guns and that aircraft are infeasible. The discrepancy arises, in part, because Katz focused on aerosol delivery above 30 km. We are unable to resolve the difference in rocket costs because Katz did not provide quantitative cost analysis for rockets.
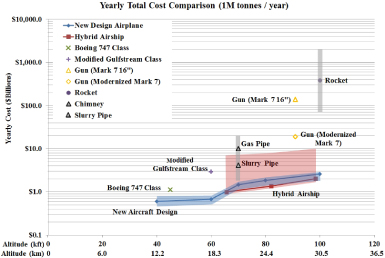
Figure 4. Comparison of yearly costs ($B) for geoengineering systems delivering 1 Mt yr−1 to the specified altitude. Shaded regions depict the range of uncertainty in cost estimates.
Download figure:
Standard imageAirships may be lower cost than aircraft at high altitude due to their significant advantage in fuel burn and slightly lower development and acquisition costs, but airship operations at high altitude have never been demonstrated. While airplanes provide flexibility, having low costs at all altitudes, airships may be better suited to large payload, high altitude operations. Gas and slurry pipes may provide a cost competitive solution if low end estimates are accurate but, with considerably higher technological risk, their RDT&E and acquisition cost include large uncertainties and may exceed $20B even if they prove technically feasible.
While analysis shows deployment of 1–5 Mt by airplane is possible up to 30.5 km (100 kft), at these altitudes, the need for development of a new high altitude propulsion system provides a large uncertainty to aircraft development costs. Above 24.4 km (80 kft), the assumed $2B cost of engine development could be underestimated, as has been the case with many recent engine development efforts. At altitudes in excess of 60 kft, the airship system provides greater propulsion flexibility than airplanes, but the large surface area of the airship requires a carefully designed structure and powerful propulsion system. With no high altitude airship flight heritage, the airship's vulnerability to winds and weather are unknown risks. Above about 80 kft, HLA size to generate enough buoyancy as well as the size of the floating platform required to support a gas pipe or slurry pipe become very large. Development of new propulsion for airships would be required, with resulting increase in cost estimate uncertainties. In the 80–100 kft range, the relative simplicity of the gun system begins to look attractive despite the high recurring cost of shells, but only if the payload fraction can be increased.
Additional work is required to refine the new airplane and airship designs. Uncertainties in the predicted costs for each can be reduced through more detailed conceptual designs. Similarly, the floating platform system with a gas pipe or slurry pipe costs may be competitive with airplanes and airships, but it is a system with some of the most difficult-to-predict RDT&E costs. A more thorough analysis of the floating platform design and the pipe design is required to obtain more accurate cost for that system. A detailed structural analysis of the pipe including modeling of wind effects, optimization of pipe to reduce wind effects, modeling of tapered pipe, and trade studies of distributed floatation and pumping will improve understanding of feasibility and cost.
Acknowledgments
The authors acknowledge helpful commentary from David Whelan and Robert Parks. Funding for this work was provided by the Fund for Innovative Climate and Energy Research (FICER), see http://keith.seas.harvard.edu/FICER.html. The work by Aurora Flight Sciences was funded as a consulting contract by FICER funds administered through the University of Calgary under the direction of David Keith. It is the policy of FICER that all results be placed in the public domain. The full report from Aurora is available at www.keith.seas.harvard.edu/geo.html and is reproduced in reformatted and slightly updated form in the supporting online material associated with this publication.