
Abstract
The numbers of fires detected on forest, savanna and transition lands during the 2002–10 biomass burning seasons in Amazonia are shown using fire count data and co-located land cover classifications from the Moderate Resolution Imaging Spectroradiometer (MODIS). The ratio of forest fires to savanna fires has varied substantially over the study period, with a maximum ratio of 0.65:1 in 2005 and a minimum ratio of 0.27:1 in 2009, with the four lowest years occurring in 2007–10. The burning during the droughts of 2007 and 2010 is attributed to a higher number of savanna fires relative to the drought of 2005. A decrease in the regional mean single scattering albedo of biomass burning aerosols, consistent with the shift from forest to savanna burning, is also shown. During the severe drought of 2010, forest fire detections were lower in many areas compared with 2005, even though the drought was more severe in 2010. This result suggests that improved fire management practices, including stricter burning regulations as well as lower deforestation burning, may have reduced forest fires in 2010 relative to 2005 in some areas of the Amazon Basin.
Export citation and abstract BibTeX RIS
1. Introduction
In the Amazon, fires are set to burn trees from recently cut forests so that agricultural or pastoral lands may be developed, but they are also set on existing agricultural or pastoral lands for nutrient mobilization, pest control, and removal of brush and litter accumulation (Crutzen and Andreae 1990). A synergy of natural drivers and human activity contribute to biomass burning in the region (Cochrane 2003, Aragão et al 2007). Fires may result from anthropogenic drivers such as commodity prices (Nepstad et al 2008) and from natural drivers such as weather and climate variability (Nepstad et al 2004, Le Page et al 2008). Biomass burning is also a large source of particulate matter during the Amazon dry season (Martin et al 2010). These particles cause health problems, modify cloud properties and affect the regional radiative balance (Koren et al 2008). Our study extends upon previous studies in that we analyze anthropogenic and natural drivers of Amazonian fires detected by satellite, classified by land cover type using 500 m resolution land cover data between 2002 and 2010.
Even though most fires in the Amazon region are anthropogenic in origin, fuels are allowed to dry out for longer periods in drought conditions, contributing to a higher occurrence of fire and fire spreading (Nepstad et al 2004, Alencar et al 2006, van der Werf et al 2008). Drought years in the Amazon have been correlated with enhanced fire activity and reduction of forest biomass (Nepstad et al 2004, Aragão et al 2007). Because fire ignition is largely associated with land management, populated regions with drought often experience more fires than unpopulated regions with drought (Uhl and Kauffman 1990, Pivello 2011). The drought of 2005 was one of the most severe on record, causing crop failure, low river levels, enhanced wildfire activity and high aerosol loading throughout the Amazon Basin (Marengo et al 2008). The drought of 2010 was even more severe by some estimates, with higher drought intensity over a larger area (Lewis et al 2011). Our study also probes the relationship between drought, human influence and forest fire activity between the severe droughts of 2005 and 2010.
2. Data and methods
Amazon fire seasons between 2002 and 2010 were analyzed in this study. A regional domain over the arc of deforestation (20°S–5°S, 80°W–40°W) during fire season months (June–November) was used. Areas to the north experienced later fire seasons and were not included in the analysis (Le Page et al 2010). Daily 1 km Level 3 MODIS fire detections from the Terra and Aqua satellites were employed and only cloud-free pixels were retrieved (Justice et al 2002, Giglio et al 2003). Fires with a detection confidence lower than 'high' (80%) were excluded from the analysis due to possible false detections in small forest clearings (Giglio et al 2003, Schroeder et al 2008). Fire detections were classified into three land cover categories: (1) forest, (2) savanna/agriculture, and (3) transition between forest and savanna, according to MODIS-derived International Geosphere–Biosphere Programme Classification (IGBP) land cover classifications at 500 m resolution from the previous year (Friedl et al 2010). The 500 m land cover data was upscaled to the 1 km fire product resolution using a majority filter. The transition land cover category was defined as 1 km2 pixels with a 50% split between forest and savanna/agricultural land cover categories.
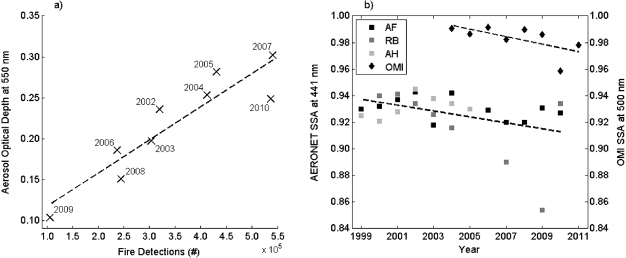
Figure 1. (a) Scatter plot of total fire detections and average AOD over the study domain and period. (b) (Square shapes) Aug–Oct averaged SSA derived from AERONET data for sites in the arc of deforestation: Alta Floresta (AF), Rio Branco (RB) and Abracos Hill (AH) between 1999 and 2010. (Diamond shapes) average Aug–Oct OMI SSA averaged over the study domain and period between 2004 and 2011. The difference in magnitude between OMI and AERONET may be due to the fact that OMI calculates SSA from retrievals at 388 nm, scaled to 500 nm, whereas AERONET calculates SSA from retrievals at 441 nm. Dashed lines in (a) and (b) show least-squares linear fits to the data.
Download figure:
Standard imageAveraged over the study period, there were 3 134 616 km2 of forest, 4 176 730 km2 of savanna/agriculture, and 200 491 km2 of transition land in the study domain. Land cover distributions each year are provided in supplementary figure 1 (available at stacks.iop.org/ERL/7/024020/mmedia), showing a 5% decrease in forested land due to ongoing deforestation activities over 2002–10. For our region, the estimated accuracy provided by quality assurance data across all 17 IGBP land cover types was 75.5%, which is similar to the calculated total accuracy of 74.8% based on training data in Friedl et al (2010). The average estimated accuracy over all land cover types in the forested category was 92% whereas the average estimated accuracies over all land cover types in the savanna/agriculture and transition categories were 64% and 60%, respectively. However, these accuracies correspond to the correct identification of each of the 17 IGBP land covers. When the 17 IGBP land covers are grouped into broad forest, savanna/agriculture and transition categories, overall accuracies improve since misclassifications often occur within each broad category. The user (producer) accuracy for the forested category is 93% (87%) and the user (producer) accuracy for the savanna/agriculture category is 97% (95%) (Friedl et al 2010, table 4). In addition, since the MODIS land cover product employs a collection of images from the same area over many days or weeks, the effects of cloud cover are minimized and all land cover pixels in our study region were able to be retrieved for each year. Therefore, due to the absence of cloud effects and the relatively high reported accuracies of the MODIS land cover categories, classification of fires by land cover can be performed acceptably well using the methods described here.
Level 3 MODIS aerosol optical depth (AOD) at 550 nm was also employed. The AOD product has been validated in the Amazon against ground-truth measurements showing retrieved AOD falling within expected uncertainty (0.05 ± 0.15 × AOD) (Levy et al 2010). Aerosol single scattering albedo (SSA) estimates were derived from quality-assured, cloud-screened, Level 2.0 AErosol RObotic NETwork (AERONET) sunphotometer data (Holben et al 1998) and near-UV retrievals from the ozone monitoring instrument (OMI) on the Aura satellite (Torres et al 2007). The Tropical Rainfall Measuring Mission 3B43 product provided monthly gridded precipitation estimates at a spatial resolution of 0.25° × 0.25° (Huffman et al 1995). Precipitation and fire count standardized anomalies were computed for each fire season and grid box between 2002 and 2010 based on a 2002–10 climatology. Fire counts aggregated to 1° × 1° resolution were adjusted according to the percentage of forest/savanna/transition land cover each year to account for the small land cover change between years.
3. Results
3.1. Trends in fires stratified by land cover type and relationship to aerosol properties
Figure 1(a) shows that total fires and seasonal–regional mean AOD were highly positively correlated (0.92,p < 0.001). Previous studies have shown a similar relationship (Koren et al 2007, Torres et al 2010). The high correlation suggests the majority of aerosol loading is due to biomass burning fires, and not other sources such as dust or transported aerosol (Koren et al 2007). The minimum in both fires and aerosol loading in 2006 has been attributed to a tri-national alert service for wildfires enacted after the severe 2005 drought (Koren et al 2007). Other studies attribute this decline to positive precipitation anomalies that year (Schroeder et al 2009, Torres et al 2010). Yet, a high burning year followed in 2007, suggesting that the tri-national alert service may not have been the cause of the 2006 decline. Relatively low burning years followed in 2008 and 2009, however in 2010, burning increased dramatically. Interestingly, the radiative scattering and absorbing characteristics of the biomass burning aerosol have also changed over this time period. Trends in single scattering albedo observed by both AERONET and OMI have declined over the last decade (figure 1(b)). To better understand the basin-wide interannual variability of fires and smoke, classification of fires by land cover type must be applied.
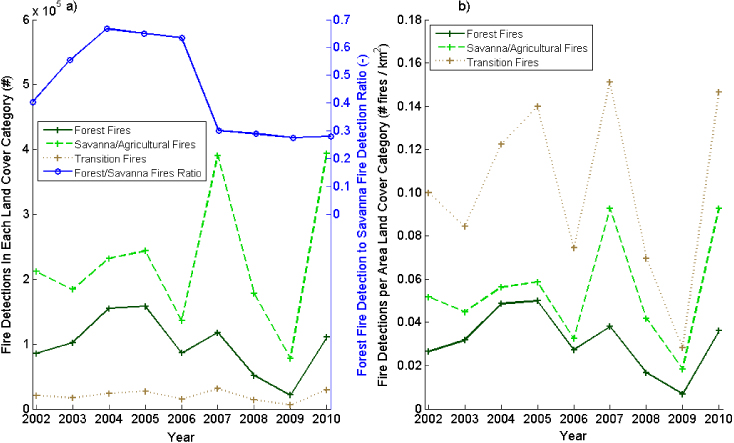
Figure 2. (a) Interannual trend of fire detections classified by land cover type over the study domain and period. Also plotted is the ratio of forest fires to savanna fires for each year. (b) Interannual trend of fire detections classified by land cover type per total area of each land cover type in the study domain.
Download figure:
Standard image
Figure 3. Standardized precipitation anomalies averaged over each land cover type in units of standard deviation (σ). Error bars represent the standard error of the mean anomaly. 0.25° × 0.25° boxes with greater than 75% forest or savanna/agricultural land cover are labeled as such and all other grid boxes are labeled as transition land cover. N denotes the number of grid boxes included in each land cover type averaged over all years.
Download figure:
Standard imageFigure 2(a) shows yearly fire detections stratified by land cover type between 2002 and 2010. Forest fires were highest in 2005, with smaller spikes in 2007 and 2010 corresponding to drought conditions during those years (figure 3). Savanna/agricultural fires, on the other hand, were substantially higher in 2007 and 2010 compared with previous years. Over the study period between 2002 and 2010, the ratio of forest to savanna/agricultural fires was lower in the last four years of the record (2007–10) compared with any other four years in the record, suggesting a possible shift in the type of burning occurring in the Amazon Basin. Regional fire trends are shown in supplementary figure 2 (available at stacks.iop.org/ERL/7/024020/mmedia). Forest fires generally decreased after 2005 in the Amazon states of Mato Grosso, Pará, Amazonas and Rondônia despite local maxima in 2007 and 2010, whereas savanna/agricultural fires were markedly high in 2007 and 2010 in the eastern Amazon and Cerrado regions within the states of Mato Grosso, Pará, Maranhão, Tocantins and Goiás. In Bolivia, the highest number of forest and savanna/agricultural fires was observed during the drought of 2010.
Figure 2(b) shows fires normalized by the area of each land cover type. In each year, the number of fires found in transition land per square kilometer exceeded that found in both forest and savanna/agricultural lands. This is because a large fraction of the land clearing and consequential burning occurs on the edge of the forest frontier (Cochrane 2003). Increased flammability along forest edges also plays a role (Cochrane and Laurance 2002). On average between 2002 and 2010, a fire was detected for every 32 km2 of forest, 18 km2 of savanna/agriculture and 10 km2 of transition land.
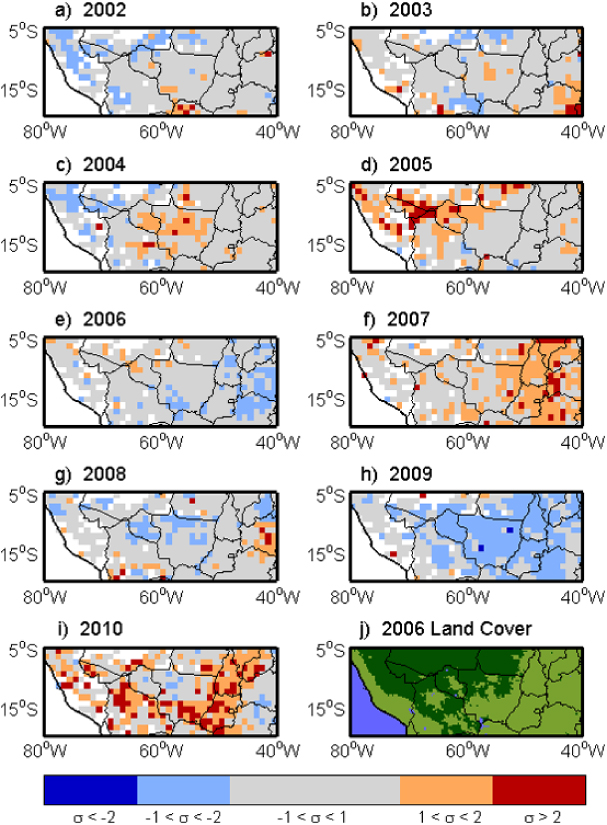
Figure 4. (a)–(i) MODIS fire detection standardized anomalies for 2002–10 at 1° × 1° resolution. Grid boxes containing one or more years of no detected fires are colored white. (j) MODIS-derived majority land cover categories from 2006 (the midpoint of the study period). Dark green areas represent forest, light green areas represent savanna/agriculture and blue areas represent water, urban or permanent wetland.
Download figure:
Standard imageChanges in the forest to savanna/agricultural fire ratio over the study period are attributed to a combination of natural and anthropogenic factors. Precipitation, or lack thereof, is one of the primary natural drivers of fire activity (van der Werf et al 2008). Mean precipitation anomalies in savanna/agricultural land were more negative in 2007 compared with 2005 (figure 3; supplementary figure 3, available at stacks.iop.org/ERL/7/024020/mmedia). This contributed to the higher number of savanna fires observed in 2007 in the south-eastern Amazon and Cerrado regions compared with 2005 (figure 4). In 2005, precipitation anomalies were more negative in forested land than in 2007 as the drought was centered farther to the north (figure 3; supplementary figure 3, available at stacks.iop.org/ERL/7/024020/mmedia), resulting in the high number of forest fires in 2005 (figure 4). Even though the drought was more severe in 2010 compared with 2005 (Lewis et al 2011), particularly in forested land (figure 3; supplementary figure 3, available at stacks.iop.org/ERL/7/024020/mmedia), there were roughly 30% fewer forest fire detections in 2010 compared with 2005, suggesting a possible anthropogenic effect influencing the forest to savanna/agricultural fire ratio. Savanna/agricultural fires were highest in 2010 compared with all other years,
An increase in agricultural fires associated with the conversion of unsustainable pastures to agricultural land may have contributed to the decrease in the forest to savanna/agricultural fire ratio in 2007–10 (Pivello 2011). Fires used to stimulate grass regrowth and to remove woody biomass on pasture land may have also played a role. These savanna/agricultural fires will frequently escape the intended burn area and spread over large regions. Clearing primary forest for new agricultural and pasture land was common until 2005 when deforestation rates began subsiding (Nepstad et al 2009). However, total Brazilian soybean yield has increased from 55.0 million metric tons in 2005/2006 to 75.3 million metric tons in 2010/11 (Soja—Série Histórica de Área Plantada 2012), a 37% increase, while deforestation has decreased 63% (Projeto PRODES—Monitoramento da Floresta Amazônica Brasileira por Satélite 2010). The decoupling of deforestation and agricultural production in the latter 2000s has been explained by the increased use of already-degraded areas for agriculture as well as the conversion of pastures back to agricultural fields, and is consistent with the decrease in the forest to savanna/agricultural fire ratio shown in figure 2(a) in the latter 2000s (Aragão and Shimabukuro 2010, Barona et al 2010, Malingreau et al 2011, Pivello 2011, Macedo et al 2012).
The decrease in SSA over the last decade in figure 1(b) supports the shift to relatively more savanna burning since combustion of savanna grass produces relatively more black carbon than combustion of woody forest, leading to greater aerosol absorption and a lower aerosol SSA (Ward et al 1992). Since SSA depends on a variety of factors in addition to vegetation type burned (e.g. burning efficiency, moisture availability, photochemical modification during transport), we do not expect the regional mean SSA to closely follow the forest to savanna fire ratio each year. However, the decreasing trend in OMI and AERONET SSA suggests experimental evidence of long-term changes in this aerosol property. A systematic change in aerosol absorption may effect aerosol–cloud interactions and thus the radiative balance of the atmosphere, but is beyond the scope of this study.
3.2. Comparison of extreme drought years over Amazonia
Figure 5(a) shows box plots of co-located 2010 minus 2005 standardized forest fire anomalies and standardized precipitation anomalies over 1° × 1° grid boxes containing forest fires in our study region. Mean and median differences were below zero for fires and precipitation, indicating a reduction in forest fires and a more severe drought in 2010 compared with 2005, a deviation from the expected inverse relationship between precipitation and fire. Yet, over 2002–10, 90% (88%) of grid boxes exhibited an inverse correlation between standardized total (forest) fire anomalies and standardized precipitation anomalies. This suggests that the 2005/2010 relationship in figure 5(a) was atypical.

Figure 5. (a) Box plots of 2010 minus 2005 standardized forest fire anomalies (left) and 2010 minus 2005 standardized precipitation anomalies (right) for 1° × 1° grid boxes containing forest fires. The '×' signifies the mean value and whiskers represent the 5th and 95th percentiles. (b) Map of 1° × 1° grid boxes illustrating the differenced forest fire anomaly–precipitation anomaly relationship in (a). Grid boxes with one or more years of no data over the study period are colored white. The four colors are associated with the four permutations (1)–(4) of more/less fires (F) and higher/lower precipitation (P). N represents the number of grid boxes associated with each permutation.
Download figure:
Standard imageFigure 5(b) shows locations of the grid boxes contained within figure 5(a). The four permutations of higher/lower precipitation anomalies and higher/lower forest fires anomalies in 2010 relative to 2005, (1) less precipitation, less fires, (2) more precipitation, less fires, (3) less precipitation, more fires, and (4) more precipitation, more fires, are depicted. Grid boxes in (2) and (3) followed the expected inverse precipitation–fire activity relationship. A large area of grid boxes in (3) extended throughout Bolivia and south-western Mato Grosso. This area, in particular, experienced a more severe drought in 2010 compared with 2005 (Lewis et al 2011).
Grid boxes in (1) and (4) deviated from the expected inverse precipitation–fire activity relationship. Substantially more grid boxes (115) existed in (1), which is characterized by fewer forest fires and lower precipitation in 2010 compared with 2005, than in (4) (56), which is characterized by more forest fires and higher precipitation in 2010 compared with 2005. In these (1) regions, fewer forest fires were detected in 2010 even in stronger drought conditions. A reduction in anthropogenic fire ignitions would serve to reduce fire counts even in a more severe drought when higher fire counts are expected. Large contiguous areas in (1) occurred throughout the states of Mato Grosso and Rondônia. These states contain recently enacted burning regulations and heightened enforcement following the 2005 drought (Brown et al 2006, Nepstad et al 2008, Schroeder et al 2009, Malingreau et al 2011). The creation of large protected areas in the Amazon also helped curb the use of fire in the region (Soares-Filho et al 2010). Furthermore, consumers, businesses, and non-governmental organizations have been acting to massively ban purchases from illegal farms in these states. One of these actions is a 'soy moratorium', beginning in 2006, which banned soy cultivated in newly deforested land (Nepstad et al 2009, Macedo et al 2012).
Regions in (4) were found in eastern Mato Grosso, western Tocantins and southern Pará, but constituted less than half of the area of regions in (1). Regions in (4) suggest an anthropogenic influence that promotes more fires in weaker drought conditions. A weaker drought suggests less fire spreading; however, higher ignition rates for anthropogenic land management in 2010 in (4) would serve to increase total detected fires compared with 2005 even in weaker drought conditions, particularly if ignition sources are a limiting factor as is often the case in the Amazon (Cochrane 2003).
Deforestation is a major driver of forest fires. Deforestation in Mato Grosso and Rondônia in 2010 was 12% and 13%, respectively, of deforestation in 2005 (Projeto PRODES—Monitoramento da Floresta Amazônica Brasileira por Satélite 2010). Deforestation fires in Mato Grosso and Rondônia in 2010, defined as fires over forest land cover detected on the same pixel more than once per fire season (Morton et al 2008), were 38% and 22%, respectively, of deforestation fires in 2005, contributing to the total decrease in forest fires. Deforestation is strongly connected to fire management; enforcement of fire laws help to prevent deforestation and vice versa. Therefore, reduced deforestation and improved fire management may be considered together when suggesting a mechanism for the lower number of forest fires in 2010 compared with 2005.
4. Conclusions
By classifying fire detections by land cover type between 2002 and 2010, we find that the heavy 2007 and 2010 Amazon biomass burning seasons were the result of a large number of savanna/agricultural fires whereas the heavy 2005 burning season resulted from relatively more forest fires. The highest forest fire to savanna/agricultural fire ratio occurred in 2005 (0.65:1) and the lowest ratio occurred in 2009 (0.27:1), with the four lowest years occurring in 2007–10. The lower ratio in 2007–10 is attributed to high numbers of savanna/agricultural fires due to droughts in 2007 and 2010 and increasing agricultural and pastoral development on already-degraded land, in addition to improved forest management and lower deforestation rates, which reduced the number of forest fires. The decrease in the forest fire to savanna/agricultural fire ratio in the late 2000s was also observed as a decreasing trend in the SSA of biomass burning aerosols over a similar period, which in turn has implications for regional aerosol–cloud–radiation interactions. We also find that the number of fires occurring in transition regions, regions on the edge of forest and savanna lands, was higher than the number of forest or savanna fires on a per area land cover basis.
Two of the most severe Amazon droughts in the last century occurred in 2005 and 2010. Even though the total number of fires was highest in 2010 among all years between 2002 and 2010 (including 2005), forest fires were lower in 2010 than in 2005. An analysis of co-located standardized forest fire anomalies and standardized precipitation anomalies between 2010 and 2005 suggests that the majority of areas that defied the expected inverse precipitation–fire activity relationship were defined by fewer forest fires but a more severe drought in 2010 compared with 2005. This result points to improved forest fire management practices in terms of stricter forest burning regulations and reduced deforestation as likely causes of the reduction in forest fires in 2010 relative to 2005.
We acknowledge the various uncertainties associated with this analysis. Some fires may not be detected due to atmospheric conditions, satellite overpass time, or fire size and energy. Only high-confidence fires were selected to minimize false fire detections. Yet, a sensitivity analysis of the fire confidence level (Giglio et al 2003) indicates that the shift from forest to savanna/agricultural burning between the early and late 2000s is robust (supplementary figure 4, available at stacks.iop.org/ERL/7/024020/mmedia). The effect of cloud cover on fire detections is also found to be minimal. The average fraction of pixels in our study domain considered by the MODIS fire product too cloudy to perform a retrieval is 0.105 with a standard deviation of 0.012. A similar fraction with minimal interannual variability exists for forest and savanna/agricultural lands individually (0.101 ± 0.011 forest, 0.107 ± 0.016 savanna/agricultural). This suggests that biases in forest and savanna/agricultural fire detections attributed to cloud cover are small and biases in the interannual trend in fire detections due to interannual variability in cloud cover is also minimal.
Acknowledgments
This study was supported by NASA grant NNX07AN25G, US EPA Grant RD-83337101-O, the NASA Interdisciplinary Sciences Program and the NASA Earth and Space Science Fellowship. We thank Paulo Artaxo and Eric Lambin for helpful comments, as well as the AERONET support team. A L Correia thanks FAPESP SERENA grant 2010/15959-3.