
Abstract
In Africa, groundwater is the major source of drinking water and its use for irrigation is forecast to increase substantially to combat growing food insecurity. Despite this, there is little quantitative information on groundwater resources in Africa, and groundwater storage is consequently omitted from assessments of freshwater availability. Here we present the first quantitative continent-wide maps of aquifer storage and potential borehole yields in Africa based on an extensive review of available maps, publications and data. We estimate total groundwater storage in Africa to be 0.66 million km3 (0.36–1.75 million km3). Not all of this groundwater storage is available for abstraction, but the estimated volume is more than 100 times estimates of annual renewable freshwater resources on Africa. Groundwater resources are unevenly distributed: the largest groundwater volumes are found in the large sedimentary aquifers in the North African countries Libya, Algeria, Egypt and Sudan. Nevertheless, for many African countries appropriately sited and constructed boreholes can support handpump abstraction (yields of 0.1–0.3 l s−1), and contain sufficient storage to sustain abstraction through inter-annual variations in recharge. The maps show further that the potential for higher yielding boreholes ( > 5 l s−1) is much more limited. Therefore, strategies for increasing irrigation or supplying water to rapidly urbanizing cities that are predicated on the widespread drilling of high yielding boreholes are likely to be unsuccessful. As groundwater is the largest and most widely distributed store of freshwater in Africa, the quantitative maps are intended to lead to more realistic assessments of water security and water stress, and to promote a more quantitative approach to mapping of groundwater resources at national and regional level.
Export citation and abstract BibTeX RIS
Corrections were made to this article on 23 April 2012. A new copyright line was included.
1. Introduction
Water use in Africa is set to increase markedly over the next few decades as a result of population growth and planned increases in irrigation (Vörösmarty et al 2005). Currently, there are more than 300 million people in Africa without access to safe drinking water (JMP 2010), many of whom are amongst the poorest and most vulnerable in the world (Hunter et al 2010). Consequently, increasing access to improved water supplies is an international priority (Bartram and Cairncross 2010). Even for those with access to improved water sources, there is growing evidence that domestic water use will need to increase substantially to help move people out of poverty (Grey and Sadoff 2007, Hunter et al 2010). There are also concerns about per capita food production in Africa (Funk and Brown 2009) that are likely to be exacerbated by climate change. Currently only 5% of the arable land is irrigated (Siebert et al 2010) and there is much discussion about increasing irrigation to help meet rising demands for food production in the context of less reliable rainfall (UNEP 2010, Pfister et al 2011).
Increasing reliable water supplies throughout Africa will depend on the development of groundwater (Giordano 2009, MacDonald and Calow 2009). Groundwater responds much more slowly to meteorological conditions than surface water and, as such, provides a natural buffer against climate variability, including drought (Calow et al 1997, 2010). Groundwater generally does not require treatment since it is naturally protected from pathogenic contamination, although in some environments elevated iron, fluoride or arsenic concentrations can be a problem (Smedley 1996, Edmunds and Smedley 2005). Groundwater can also be found in most environments using the appropriate exploration techniques so supplies can be located close to the point of need, minimizing the requirement for extensive reticulation systems (MacDonald and Calow 2009).
Groundwater, however, is neither a universal panacea to water problems nor invulnerable to degradation. Careful characterization of the resource is required to guide investments in water supply and to manage the resource to minimize environmental degradation (Foster and Chilton 2003) and widespread depletion. Limited knowledge of African groundwater resources is evident from the paucity of information on groundwater included in the IPCC Fourth Assessment Report and Technical Paper on water (Bates et al 2008) which noted major uncertainty in how changes in climate may affect groundwater and what resources are currently available to help support adaptation strategies.
Quantitative, spatially explicit information on groundwater in Africa is required to characterize this resource in ways that can usefully inform strategies to adapt to growing water demand associated not only with population growth but also climate variability and change. Current continent-wide groundwater maps provide only qualitative information on the likely extent of aquifers (Struckmeier and Richts 2008, Seguin 2008, MacDonald and Calow 2009). As such, key quantitative information outlining the dimensions of the continent's groundwater resources have, to date, remained unresolved. We address this significant knowledge gap by developing the first quantitative maps of groundwater storage and potential groundwater yields in Africa.
2. Methods
Groundwater occurrence depends primarily on geology, geomorphology/weathering and effective rainfall (both current and historic). The interplay of these three factors gives rise to complex hydrogeological environments with innumerable variations in aquifer transmissivity (the permeability of the rocks integrated over thickness); effective porosity (the total porosity minus the volume taken up by water bound to clays or more rarely held in isolated unconnected pore spaces), saturated thickness of aquifers; and groundwater recharge. Direct measurements of transmissivity and effective porosity are scarce for much of Africa (Adelana and MacDonald 2008). Instead we use proxies for these parameters which have been found to be effective surrogates in data limited areas. For transmissivity, we use reported borehole yields (termed aquifer productivity). Although borehole yields are constrained by borehole and pump characteristics in addition to transmissivity, they are much more widely reported than measurements of transmissivity or alternatively, specific capacity. As such, use of borehole yields provides a much larger dataset with which to characterize spatial variations in aquifer productivity. In practice, boreholes are often constructed to maximize yield from an aquifer, which helps to explain why several studies have found borehole yields to be directly related to transmissivity at a regional or national scale (Acheampong and Hess 1998, Graham et al 2009). Effective porosity is estimated by systemizing the flow and storage characteristics of different lithologies and relating these to measured effective porosity in Africa and other global analogies. Saturated thickness is estimated from the available hydrogeological and geological reports and data (see below).
Fundamental to our analysis is the collation and review of existing national hydrogeological maps as well as both published and grey literature for Africa. Hydrogeological maps were collated by building on the International Association of Hydrogeologists database of published maps, WHYMAP (Struckmeier and Richts 2008) and supplementing these with other geological and hydrogeological maps available elsewhere. A systematic review of aquifer studies was also undertaken from published and easily accessible grey literature resulting in 283 aquifer summaries within 152 publications. A database of all maps and consulted studies, together with the review criteria, are given in supplementary material 2 available at stacks.iop.org/ERL/7/024009/mmedia. Figure 1 shows the spatial distribution of data used to develop the quantitative maps, and the range of confidence in the data assigned by systematic review.

Figure 1. Available information on groundwater resources for Africa used to construct the quantitative continent maps. A detailed list of the maps and studies is given in supplementary material 1 available at stacks.iop.org/ERL/7/024009/mmedia.
Download figure:
Standard imageThe new quantitative maps of groundwater in Africa were developed in the following manner: (1) the digital 1:5 million scale geological map of Africa (Persits et al 1997) was modified by dividing Precambrian rocks into hydrogeologically significant units (meta-sedimentary, mobile-belt, craton), and classifying sedimentary rocks according to the major basins to which they belong; (2) published national and regional hydrogeological maps were georeferenced and used to further combine or divide geological units; (3) the modified geological basemap was parameterized using available quantitative information from the national hydrogeological maps and the georeferenced aquifer studies for aquifer productivity (the approximate interquartile range in the yield of appropriately sited boreholes); saturated aquifer thickness (the estimated range in total saturated thickness for the aquifer units) and aquifer flow/storage type (classified as fractured volcanic rocks, weathered and non-weathered crystalline basement, dominantly fractured, mixed intergranular/fractured and dominantly intergranular consolidated sedimentary rocks, and unconsolidated sediments); and (4) peer review of the draft quantitative maps by 12 regional experts.
To estimate groundwater storage the saturated aquifer thickness was multiplied by effective porosity (ϕe). For each of the aquifer flow/storage types an effective porosity (ϕe) range was assigned based on a series of studies across Africa and surrogates in other parts of the world. Weathered basement and fractured volcanic rocks were assigned a mean ϕe of 5% (1–10%), which is representative of moderately decomposed crystalline basement (Taylor and Eggleton 2001, Petford 2003, Howard and Griffith 2009). Fractured sedimentary rocks were assigned a mean ϕe of 8% (3–15%) based on studies in the Karoo basin (Van der Voort 2001); the Voltaian Sediments (Pelig-Ba 2009), and the Benue Trough (Lott 1998). Mixed intergranular and fractured rocks were assigned a mean ϕe of 15% (10–30%) based on a studies in Nigeria (Samaila and Singh 2010), Botswana (Jones 2010), surrogates in the UK (Allen et al 1997) and global oil industry studies of porosity in cemented siliciclastic reservoirs (Morse 1994). Intergranular aquifers were assigned a mean ϕe of 25% (20–35%), a conservative value based on the studies in the Continental Terminale (Adelana and MacDonald 2008), the Chad Basin (Nwankwo et al 2009) and the Nubian Sandstone (Beavan et al 1991).
Figure 1 shows the distribution of data used to develop the continental maps. Good quality hydrogeological maps and studies are available for much of southern Africa, but there is a lack of quantitative national hydrogeological maps in north, west and central Africa. In western Africa, this is compensated by the availability of many individual smaller studies, most notably in Nigeria and Ghana. In northern Africa, the size of individual studies tend to be much larger and involve characterizing major regional aquifers that substitute for the lack of high quality national maps. In central Africa both maps and literature are scarce.
3. Results and discussion
3.1. Groundwater storage
Groundwater storage has been estimated by combining the saturated thickness and effective porosity of aquifers across Africa (figure 2). Large sedimentary aquifers in North Africa contain a considerable proportion of Africa's groundwater. Libya, Algeria, Sudan, Egypt and Chad have the largest groundwater reserves. Many of these Saharan aquifers are not, however, actively recharged, but were recharged more than 5000 yr ago when the climate of the area was wetter (Scanlon et al 2006, Edmunds 2008). Groundwater storage volumes in these aquifers can be as high as 75 × 106 m3 km−2 (equivalent to 75 m water depth).
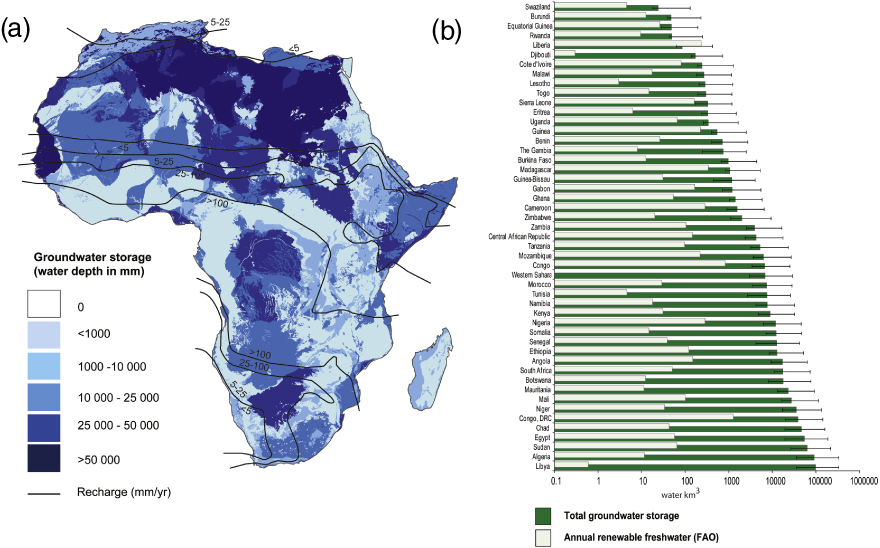
Figure 2. Groundwater storage for Africa based on the effective porosity and saturated aquifer thickness. Panel (a) shows a map of groundwater storage expressed as water depth in millimetres with modern annual recharge for comparison (Döll and Fiedler 2008). Panel (b) shows the volume of groundwater storage for each country; the error bars are calculated by recalculating storage using the full ranges of effective porosity and thickness for each aquifer, rather than the best estimate. Annual renewable freshwater availability (FAO 2005) generally used in water scarcity assessments is shown for comparison.
Download figure:
Standard imageAquifers with the least storage generally comprise thin weathered Precambrian basement rocks where average groundwater volumes are estimated to be 0.5 × 10⁶ m3 km−2 (equivalent to 0.5 m water depth) and range from 0.05 to 2.5 × 10⁶ m3 km−2. The limited storage of these aquifers is nevertheless highly significant as it is considerably more than the volume abstracted annually using a community handpump ( < 0.003 × 10⁶ m3). These aquifers also have sufficient storage space to allow groundwater recharge to be stored for several decades thereby providing a vital buffer against variable climates (MacDonald et al 2009). Countries with the lowest groundwater reserves are generally those with a small land area which are underlain almost exclusively by Precambrian basement rocks.
The total volume of groundwater in Africa is estimated to be 0.66 million km3 with a range in uncertainty of between 0.36 and 1.75 million km3 (figure 2 and table 1). Not all the groundwater volume estimated by the saturated thickness and effective porosity of the aquifer is, however, available to be abstracted. The volume of water that is released from an aquifer through pumping is often less than the effective porosity but is problematic to measure. This parameter, specific yield, represents the drainable porosity of an unconfined aquifer. There are only two published estimates of in situ specific yield at location in Africa (Wright et al 1982, Taylor et al 2010). Both indicate the specific yield to be approximately half of the measured porosity, consistent with global estimates (Fetter 2000).
Table 1. Estimated groundwater storage for African countries.
| Country | Groundwater storage (km3) | |
|---|---|---|
| Best estimate | Rangea | |
| Algeria | 91 900 | 56 000–243 000 |
| Angola | 17 100 | 7800–46 500 |
| Benin | 718 | 320–2000 |
| Botswana | 17 700 | 9560–58 300 |
| Burkina Faso | 978 | 319–3330 |
| Burundi | 47 | 8–183 |
| Cameroon | 1560 | 667–4810 |
| C African Rep | 4240 | 1 900–13 100 |
| Chad | 46 000 | 26 600–112 000 |
| Congo | 6730 | 3 350–18 300 |
| Congo, DRC | 38 300 | 18 600–103 000 |
| Cote d'Ivoire | 241 | 49–1020 |
| Djibouti | 171 | 35–546 |
| Egypt | 55 200 | 36 000–130 000 |
| Equatorial Guinea | 48 | 20–147 |
| Eritrea | 333 | 94–1120 |
| Ethiopia | 12 700 | 4340–39 300 |
| Gabon | 1200 | 499–4190 |
| Ghana | 1400 | 369–4418 |
| Guinea | 541 | 133–1935 |
| Guinea-Bissau | 1180 | 742–2824 |
| Kenya | 8840 | 4090–23 300 |
| Lesotho | 285 | 78–936 |
| Liberia | 86 | 25–333 |
| Libya | 99 500 | 64 600–234 000 |
| Madagascar | 1060 | 207–4160 |
| Malawi | 269 | 91–885 |
| Mali | 27 100 | 10 600–87 000 |
| Mauritania | 23 400 | 10 500–67 200 |
| Morocco | 7410 | 3970–20 700 |
| Mozambique | 6290 | 2684–20 300 |
| Namibia | 7720 | 3520–24 600 |
| Niger | 35 800 | 19 000–94 700 |
| Nigeria | 11 800 | 5710–33 600 |
| Rwanda | 49 | 6–198 |
| Senegal | 12 500 | 8280–29 100 |
| Sierra Leone | 327 | 160–850 |
| Somalia | 12 300 | 5210–34 500 |
| South Africa | 17 400 | 6400–56 100 |
| Sudan | 63 200 | 37 100–151 000 |
| Swaziland | 24 | 6–104 |
| Tanzania | 5250 | 2040–17 900 |
| The Gambia | 748 | 498–1750 |
| Togo | 297 | 102–879 |
| Tunisia | 7580 | 4 910–18 100 |
| Uganda | 339 | 73–1270 |
| Western Sahara | 6800 | 3770–21 400 |
| Zambia | 3950 | 1430–12 300 |
| Zimbabwe | 2010 | 906–7230 |
aThe range is calculated by recalculating storage using the full ranges of effective porosity and thickness for each aquifer, rather than the best estimate.
Our estimates of groundwater storage do not consider water quality as there is currently insufficient data to make meaningful regional assessments for Africa. Concentrations of fluoride in excess of drinking water guidelines have been found in the volcanic rocks of the East African rift valley (Edmunds and Smedley 2005); elevated arsenic concentrations have been found locally in weathered basement rocks in West Africa (Smedley 1996). Undesirable natural concentrations of other parameters including iron, manganese and chloride can also be found in aquifers depending on local hydrogeological conditions. Contamination of groundwater by faecal coliforms and nitrate is common in urban areas from widespread and dispersed faecal effluent from on-site sanitation and leaking sewers (Adelana and MacDonald 2008).
Notwithstanding the uncertainties discussed above, the estimated groundwater storage (0.66 million km3) represents a water resource that is of a different magnitude to all other freshwater sources in Africa. Annual average rainfall is approximately 0.02 million km3 (New et al 2000) and freshwater storage in lakes is estimated to be 0.03 million km3 (Shiklomanov and Rodda 2003). Water scarcity assessments (e.g. Falkenmark 1989, Vörösmarty et al 2010) are based on renewable freshwater resources defined by river discharge and estimated groundwater recharge which amount to approximately 0.004 million km3 (FAO 2005, UNEP 2010). Figure 2 illustrates that many countries designated as 'water scarce' have substantial groundwater reserves. These large reserves provide a large and important buffer to changes in climate, and are therefore integral to the development of adaptation strategies to current and future climatic variability.
3.2. Aquifer productivity
The accessibility of the groundwater resources is as important as overall groundwater storage in determining how far groundwater can support nations and communities to adapt to climate change and population growth (Calow et al 2010). Groundwater is accessed and abstracted, generally through drilling boreholes, and the yield of the borehole will limit the rate at which groundwater can be abstracted. For a community water supply fitted with a handpump, a borehole must be able to sustain a supply of >0.1 l s−1, and preferably 0.3 l s−1. Intensive irrigated agriculture requires much higher borehole yields. For example a standard centre pivot irrigator of the type used in the central plains of the US will require a borehole that can supply approximately 50 l s−1. Other farm systems which irrigate smaller areas do not require such high yields, but for commercial irrigation schemes typically demand boreholes supplying > 5 l s−1. In a similar way, urban town supplies rely on individual boreholes that can sustain a yield of at least 5 l s−1.
Figure 3 shows the calculated aquifer productivity map for Africa, indicating what boreholes yields can reasonably be expected in different hydrogeological units. The ranges indicate the approximate interquartile range of the yield of boreholes that have been sited and drilled using appropriate techniques, rather than those drilled at random. For most geological units, likely yields from successful boreholes span several orders of magnitude (figure 4). Crystalline basement rocks have the lowest yields, generally less than 0.5 l s−1, though a significant minority of areas have yields that are in excess of 1 l s−1 (figure 4). Highest borehole yields ( > 20 l s−1) can be found in thick sedimentary aquifers, particularly in unconsolidated or poorly consolidated sediments. Depth to groundwater is another important factor controlling accessibility and cost of accessing groundwater (figure 3). Water levels deeper than 50 m will not be able to be accessed easily by a hand pump. At depths >100 m the cost of borehole drilling increases significantly due to the requirement for more sophisticated drilling equipment.

Figure 3. Aquifer productivity for Africa showing the likely interquartile range for boreholes drilled and sited using appropriate techniques and expertise. The inset shows an approximate depth to groundwater (Bonsor and MacDonald 2011).
Download figure:
Standard image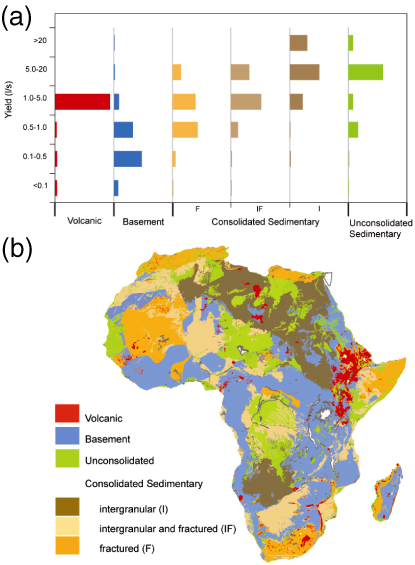
Figure 4. The range in aquifer productivity within the different geological environments from the available data. The frequency in panel (a) is the proportion of land area within each geological unit attributed with a particular aquifer productivity class; panel (b) shows the distribution of each geological environment.
Download figure:
Standard imageThe aquifer productivity map (figure 3) shows that for many African countries appropriately sited and constructed boreholes will be able to sustain community handpumps (yields of 0.1–0.3 l s−1) and for most of the populated areas of Africa, groundwater levels are likely to be sufficiently shallow to be accessed using a handpump. The majority of large groundwater stores in the sedimentary basins which can accommodate high yielding boreholes are in northern Africa. These are often far from population centres and have deep water levels and are therefore costly to develop. Away from the large sedimentary aquifers in northern Africa, the potential for borehole yields exceeding 5 l s−1 is not widespread, though higher yielding boreholes may be successful in some areas if accompanied by detailed hydrogeological investigation. The potential for intermediate boreholes yields of 0.5–5 l s−1, which could be suitable for small scale household and community irrigation, or multiple use water supply systems, is much higher, but will again require effective hydrogeological investigation and borehole siting. Strategies for increasing the use of groundwater throughout Africa for irrigation and urban water supplies should not be predicated upon the widespread expectation of high yielding boreholes but recognize that high borehole yields may occasionally be realized where a detailed knowledge of the local groundwater conditions has been developed.
4. Conclusions
The production of the first quantitative maps of groundwater resources in Africa reveals the magnitude and distribution of freshwater stored as groundwater. The volume of groundwater is estimated to be 0.66 million km3, more than 100 times the annual renewable freshwater resources, and 20 times the freshwater stored in African lakes. As the largest and most widely distributed store of freshwater in Africa, groundwater provides an important buffer to climate variability and change. The maps presented here are designed to give a continent-wide view of groundwater and to encourage the development of more quantitative national and sub-national quantitative maps and assessments to support the development of groundwater-based adaptation strategies to current and future climate variability. In addition, the maps enable the explicit representation of groundwater storage in assessments of water scarcity and strategies to achieve water security.
The maps demonstrate the uneven distribution of groundwater across the continent and in particular the large groundwater volumes available in the sedimentary basins of north Africa. The potential for boreholes yielding greater than 5 l s−1 outside of large sedimentary basins is not widespread but limited to particular areas requiring careful exploration and development. Nevertheless, for many African countries appropriately sited and constructed boreholes will support a handpump (a yield of 0.1–0.3 l s−1), and sufficient storage is available to sustain abstraction through inter-annual variations in recharge.
Acknowledgments
This paper is published with the permission of the Executive Director of the British Geological Survey (NERC). The research was funded by grants from the UK Department for International Development.
© BGS/NERC 2012