
Abstract
Researchers around the world are developing sustainable plant-based liquid transportation fuels (biofuels) to reduce petroleum consumption and greenhouse gas emissions. Algae are attractive because they promise large yields per acre compared to grasses, grains and trees, and because they produce oils that might be converted to diesel and gasoline equivalents. It takes considerable energy to produce algal biofuels with current technology; thus, the potential benefits of algal biofuels compared to petroleum fuels must be quantified. To this end, we identified key parameters for algal biofuel production using GREET, a tool for the life-cycle analysis of energy use and emissions in transportation systems. The baseline scenario produced 55 400 g CO2 equivalent per million BTU of biodiesel compared to 101 000 g for low-sulfur petroleum diesel. The analysis considered the potential for greenhouse gas emissions from anaerobic digestion processes commonly used in algal biofuel models. The work also studied alternative scenarios, e.g., catalytic hydrothermal gasification, that may reduce these emissions. The analysis of the nitrogen recovery step from lipid-extracted algae (residues) highlighted the importance of considering the fate of the unrecovered nitrogen fraction, especially that which produces N2O, a potent greenhouse gas with global warming potential 298 times that of CO2.
Export citation and abstract BibTeX RIS
1. Introduction
Many countries plan to improve their energy and economic security and reduce their greenhouse gas (GHG) emissions to abate global climate change. Towards these ends, researchers are developing sustainable liquid transportation fuels from biomass (biofuels). These fuels would replace petroleum transportation fuels and would contain atmospheric (biogenic) carbon rather than fossil carbon, thus addressing GHG emissions concerns.
Interest in algae is high because algae might address several biofuel challenges. Biofuels require inexpensive biomass feedstock, but the land, water, and nutrient needs of biofuel crops, combined with those from feed and food crops, must be consistent with available resources. Algae experiments have shown large productivities compared to terrestrial cellulosic plants like grasses, grains and trees. This trait, if realized in reliable agricultural processes, offers large biomass yields per acre. Also, algae can store energy in lipids that might be converted to diesel and gasoline equivalents using current infrastructure.
Several researchers have studied algal fuel production with life-cycle analysis (LCA) methods to estimate process energy consumption and GHG emissions. LCA methods account for all energy use and all emissions incurred during the production and use of a fuel. They consider all processes within the study scope, also called the system boundary, including transportation and manufacture of resources and intermediates. For example Kadam (2001), concluded that GHG emission reductions were possible when a coal power plant was co-fired with algal biomass; however, when mono-ethanolamine (MEA) solvent was used to separate CO2 from the rest of the flue gas, many of the benefits were lost because of high steam requirements for regenerating the MEA. Campbell et al (2009) studied algal fuel production from flue gas and concluded that pressurized distribution required unacceptably high operating power while low-pressure distribution introduced challenges related to capital, pipeline size, and routing.
Lardon et al (2009) emphasized the importance of increasing the lipid fraction and avoiding drying, highlighting that much of the algal biomass energy remains in the lipid-extracted algae (LEA) remnants that remain after lipid extraction. Clarens et al (2010) compared production of algae with several other energy crops and concluded that, unless nutrient demand is mitigated, algal biomass can have higher life-cycle emissions than those other crops. Stephenson et al (2010) compared paddlewheel-mixed ponds with tubular photobioreactors and concluded that culture mixing required significant electrical power. Collet et al (2011) studied bio-methane production from algae by anaerobic digestion (AD) for use as a transportation fuel. The Moller et al (2009) life-cycle analysis of AD and digestate use did not study algae, but the work identified fugitive methane emissions and emissions of nitrous oxide (N2O) when digestate is used as an agricultural fertilizer to be important factors for pathways utilizing AD.
Since fuels are manufactured with complex processes that produce several products simultaneously, e.g., biodiesel and glycerin, LCA must distribute energy and emission burdens amongst these co-products. Several distribution methods are possible and result in different distributions for the same production process. In addition, the total emissions depend upon what is included in the system boundary. The studies cited above are difficult to compare because of differences in scope and burden distribution. Therefore, our first goal was to establish a framework that would facilitate comparisons amongst algae scenarios and facilitate their comparisons with other transportation fuels.
Our second goal was to identify parameters that most affect the LCA results. Given the results just cited, this study paid particular attention to processes related to energy recovery from the LEA, especially AD. Other analyses of liquid algal fuels did not consider fugitive methane emissions and did not discuss the fate of unrecovered nitrogen and the potential for N2O production. We present estimates for N2O and fugitive methane emissions associated with liquid algal fuels.
2. Methods
This study employed the GREET (Greenhouse Gases, Regulated Emissions, and Energy Use in Transportation) model developed at Argonne National Laboratory with support from the US Department of Energy's (DOE's) Office of Energy Efficiency and Renewable Energy. GREET is a publicly available LCA tool that investigates numerous fuel and vehicle cycles (Wang 1999a, 1999b, GREET 2011). GREET computes fossil, petroleum and total energy use (including renewable energy in biomass), emissions of greenhouse gases (CO2, CH4 and N2O), and emissions of six criteria pollutants: carbon monoxide (CO), volatile organic compounds (VOCs), nitrogen oxides (NOx), sulfur oxides (SOx), particulate matter with a diameter below 10 μm (PM10) and particulate matter with a diameter below 2.5 μm (PM2.5). GREET includes gasoline, diesel, biofuels, hydrogen, natural-gas-based fuels and electricity. Vehicle technologies include gasoline engines, diesel engines, hybrid electric vehicles with gasoline and diesel engines, plug-in hybrid electric vehicles with gasoline and diesel engines, battery-powered electric vehicles and fuel cell vehicles.
We expanded the GREET model to include algal biofuel production analysis as described in Frank et al (2011a) and built a helper tool called Algae Process Description (APD) to facilitate the description of various algae pathways. Because of the wide array of fuels and vehicles analyzed under a shared methodological umbrella, shared upstream and downstream emissions, and shared co-product handling methods, the expanded GREET provides a framework for uniform life-cycle analysis and comparison of algal biofuels with many other fuels.
APD and GREET were used to study the lipid production pathway shown in figure 1. The algae and lipid production blocks are further described in figure 2. A detailed discussion of parameter values, data provenance and emission allocation methodology is presented in Frank et al (2011b). In brief, algae are cultivated in paddlewheel-mixed open ponds, dewatered by settling, dissolved-air flotation (DAF) and centrifuge operations, and then ruptured by pressure-homogenization. Lipids are then extracted on-site via a wet hexane process. Biodiesel is produced by transesterification. Tables 1–3 display essential data. The macromolecular composition and productivity depend upon species, specific growth conditions, and extrapolation from diverse experiments. The baseline scenario assumes 25 wt% lipids and 25 g m−2 d−1 productivity but we then compute GHG results over a broad range of these two highly uncertain parameters.

Figure 1. System definition for the algae production pathway. BD—biodiesel; RD—renewable diesel; RG—renewable gasoline.
Download figure:
Standard image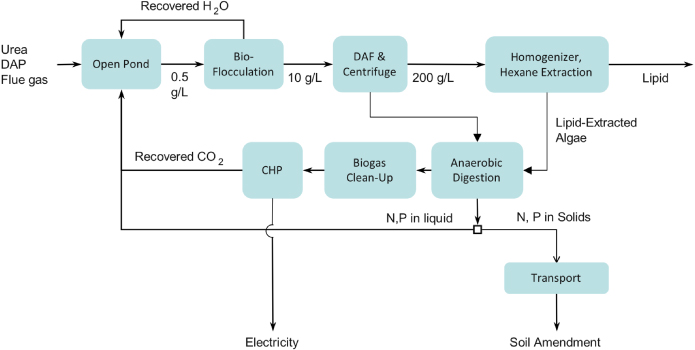
Figure 2. The algae and lipid production activities from figure 1.
Download figure:
Standard imageTable 1. Algae growth characteristics.
| Quantity | Value | Notes |
|---|---|---|
| Productivity | 25 g m−2 d−1 | Assumed, but explored in analysis |
| Lipid fraction | 25 wt% | Assumed, but explored in analysis |
| Carbohydrate fraction | 50 wt% | Lardon et al (2009) |
| Protein fraction | 25 wt% | By difference |
| Carbon fraction | 50 wt% | Chisti (2007) |
| C:N:P ratio | 103:10:1 mol:mol | Similar to Chisti (2007) |
| CO2 | 1.83 gCO2/g-algae, net | Stoichiometric, from algae C fractiona |
| CO2 utilization | 82% | Lundquist et al (2010)b |
| Evaporation rate | 0.6 cm d−1 | Arid region, no precipitation |
| Culture mixing speed | 25 cm s−1 | Lundquist et al (2010) |
aCO2 required assuming perfect uptake in culture. bThe average of 75% and 85% utilization efficiencies.
Table 2. Algae processing energy densities.
| Process | Efficiencya (%) | Electricityb (Wh/g-algae) | Heatb (Wh/g-algae) |
|---|---|---|---|
| Dissolved-air flotation | 90 | 0.15 | 0 |
| Dewatering centrifugec | 95 | 0.035 | 0 |
| Homogenizer | 90 | 0.2 | 0 |
| Wet hexane extraction | 95 | 0.54d | 1.4d |
aEfficiency is the fraction of algae captured at each step. Unrecovered algae go to the digester. bDirect energy consumption. cInfluent at 10 wt% solids. dEnergy for wet hexane extraction is Wh/g-lipid rather than per g-algae.
Table 3. Energy consumption and site-level energy balance for on-site processes considering flows through each process. (Note: all weights are dry-weight.)
| Direct energy consumptiona (Btu/unit shown) | Process inputs | Direct demandb (Btu/kg lipid) | CO2 | |||
|---|---|---|---|---|---|---|
| Thermal | Electrical | Thermal | Electrical | (kg/kg lipid) | ||
| Growth and first dewateringc | 0 | 1348/kg yield | 2.24 kg CO2/kg-algae | 0 | 7375 | 12.23 |
| Remaining dewateringd | 0 | 649/kg yield | 1.17 kg algae/kg dewatered algae | 0 | 3036 | |
| Lipid extractione | 4695/kg yield | 4772/kg yield | 4.68 kg dewatered algae/kg lipids | 4695 | 4772 | |
| Anaerobic digestion | 1856/kg feed | 464/kg feed | 4.47 kg feed/kg lipids | 8301 | 2075 | |
| Off-site CO2, transfer into pond | 0 | 72.2/kg CO2 | 0 | 632 | ||
| Recovered CO2, transfer into pond | 0 | 72.2/kg CO2 | 0 | 250 | ||
| Biogas clean-up | 0 | 1406/kg CH4 | 0 | 1310 | ||
| Transesterificationf | 26.4 kg lipid/MMBTU-BDg | |||||
| Total direct demand on-site | 12 996 | 19 450 | 12.23 | |||
| Recovered on-site (CHP) | 18 911 | 14 620 | 3.47 | |||
| Imported (by difference) | 0 | 4830 | 8.76 | |||
aDirect energy consumption shows the (specific) energy consumption of each operation per unit of yield, as listed. bDirect demand shows the net energy consumption of each operation when the unit is processing the flow required to produce one kilogram of lipids. It is obtained by multiplying the factors in the process inputs column. For example, one kg of lipids requires 4.68 kg dewatered algae each of which required 1.17 kg of algae after first dewatering. Therefore, the direct demand for Growth and first Dewatering is the product, (1348 Btu/kg-algae) × (1.17 kg- algae/kg dewatered algae) × (4.68 kg dewatered-algae/kg-lipid). cOpen pond plus bio-flocculation in figure 2. dDAF and centrifuge in figure 2. eHomogenizer and hexane extraction in figure 2. fTransesterification is an off-site process but is included here to display the relationship between lipid mass and biodiesel energy content. See Huo et al (2008) for transesterification material and energy consumption details. gUnits are kg of lipids per million BTU of biodiesel.
We present two scenarios. The baseline scenario uses AD for energy and nutrient recovery from the LEA while a reduced emissions scenario uses catalytic hydrothermal gasification instead. AD produces biogas and mineralizes a portion of the nitrogen as ammonia and ammonium in the AD supernatant. The solids remaining after AD (the digestate) contain the remaining nitrogen and, in this study, are applied to agricultural fields to displace fertilizers. Based upon the work of Weissman et al (1988) and Ras et al (2011), this study assumed that 80% of the nitrogen in the biomass was recovered as ammonium/ammonia and was returned to the algae culture with 5% volatilization losses. The nitrogen in the digestate was assumed to have 40% bioavailability (Tchobanoglous et al 2003, Bruun et al 2006). Phosphorus was split 50/50 between supernatant and digestate (Weissman et al 1988). We assumed that the phosphorus in the supernatant was completely recovered by the algae culture and assumed 100% of the phosphorus in the digestate was bioavailable when applied to soil. Carbon remaining after digestion was also split 50/50 between supernatant and digestate. The mass balance is shown in figure 3. In total, each gram of algae required 14 mg N and 6.3 mg P from new fertilizer and used 42 mg N and 6.3 mg P from recovered nutrients. Biogas was combusted in a combined heat and power unit on-site operating with 33% electrical efficiency and 76% total efficiency (LHV basis) (EPA 2008).
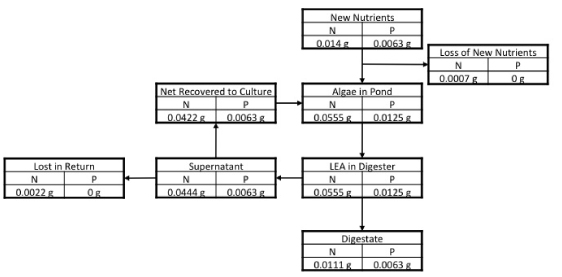
Figure 3. Nutrient mass balance. All quantities are normalized per gram of harvested algae, e.g., 0.0444 of N are present in the digester supernatant for each gram of algae harvested.
Download figure:
Standard imageAD performance was reviewed in the literature. Only one study used LEA as substrate (Ehimen et al 2011) and this was at bench scale. There were several studies of whole-algae digestion, again all at bench scale (Ras et al 2011, Samson and Leduy 1982, Sialve et al 2009, Collet et al 2011). These studies reported methane yield on a volatile solids (VS) basis. The results of our review were expressed on a total solids basis (TS) to facilitate mass flow computations in the model by assuming 0.9 g VS/g-TS (consistent with the studies just cited). The methane yield then ranged from 0.2 to 0.4 L-CH4/g-TS at standard temperature and pressure. The midpoint, 0.3 L-CH4/g-TS was adopted in our baseline scenario. The biogas volume was then computed assuming 67 vol% CH4 and 33 vol% CO2. The biogas was cleaned as for landfill renewable gas and combusted in the on-site combined heat and power (CHP) unit. Flue gas produced from the CHP unit was returned to the pond, CHP heat was recovered to meet all of the AD and hexane extraction heat demand, and CHP electricity was used to meet some of the on-site electricity demand (the balance being supplied from the grid). By itself, the AD process required a total of 0.68 kWhthermal/kg-TS and 0.11 kWhelectrical/kg-TS (Collet et al 2011) including electricity to dewater the digestate to 30 wt% solids.
Methane is a potent greenhouse gas, 25 times as potent as CO2 (Eggleston et al 2006). We performed a literature search for information concerning unintended methane emissions from AD and from biogas clean-up. Two studies measured methane loss at eleven AD facilities (Flesch et al 2011, Liebetrau et al 2010). Two other studies considered methane loss in biogas pathways when used for transportation (Moller et al 2009, Borjesson and Berglund 2006). Flesch reported 3.1% total loss of CH4 from AD at a state of the art facility. This fell to 1.7% after redesigning the biomass loading hopper. Liebetrau reported similar total emissions, but commented that the digestate can yield up to an additional 10% of the total AD CH4 during digestate storage (field application is seasonal), which might be leaked depending upon the storage method. Liebetrau also observed substantial losses from previously undiscovered equipment failures, e.g., leaking service openings. Although these sources of fugitive CH4 might be reduced or removed by design and quality control, a total loss of 2% was assumed in our analysis to estimate the consequences of employing current state of the art equipment, similar to losses assumed in several biogas studies (Moller et al 2009, Borjesson and Berglund 2006).
The nitrogen in the digestate might be converted to nitrous oxide (N2O), a GHG even more potent than CH4, after application to soil. The International Panel on Climate Change (IPCC) task force on greenhouse inventories emission factor for direct N2O emissions from organic fertilizers is 0.01 kg N2O–N per kilogram of applied N where each kilogram of N2O–N equates to 44/14 g of N2O (IPCC 2006). Direct N2O emissions from field application of digestate were estimated in this manner and added as a GHG burden. Emissions from transporting digestate to the field assumed the digestate was dewatered by centrifuge to 30 wt% solids.
The baseline pathway just described was modified to define a lower-emission scenario that combined some optimistic and some conservative changes. Considering the uncertainty in the AD performance for LEA, this alternative scenario used catalytic hydrothermal gasification (CHG) (Elliott et al 1993, Elliott and Sealock 1996) in place of AD. CHG converts wet biomass slurries to biogas with over 99% efficiency for organic carbon. Nitrogen is reduced to ammonia and recovered in an aqueous phase. Phosphorus is recovered from a clay-like precipitate by treatment with sulfuric acid. Developers report almost complete recovery of N and P, but in the current model 95% and 90% recoveries were assumed, respectively (Genifuel 2011). In this lower-emission scenario, fugitive CH4 emissions were reduced to 0.2%, and the algal lipid fraction was increased to 35 wt%. The increase to 35 wt% lipid has not been demonstrated at scale but is modest compared to 50 wt% reported by some authors. Unrelated to these optimistic assumptions, more conservative values were assumed for the CHP electrical efficiency (29%) and for the DAF output (8% solids). The CHP efficiency was reduced for possible effects related to higher operating temperature and part-load utilization. Further details are in Frank et al (2011b).
Energy consumption and emissions were allocated amongst the algal biofuel, exported electricity, glycerin from transesterification, and digestate used to fertilize fields with a hybrid method:

Alipid = Elipid/(Elipid + Eco−power) is an energy-based allocation for emissions related to lipid production. GHGdisplaced−fertilizer is a displacement credit for the exported digestate equal to the manufacturing emissions from the displaced fossil fertilizers. GHGconversion are the life-cycle emissions for transesterification of the algal lipids and Aconversion = Efuel/(Efuel + Eglycerin) is an energy-based allocation factor between the biodiesel fuel and the glycerin co-product. The glycerin is considered an energy product because large-scale biofuel production would likely exceed the glycerin chemical market perhaps leading to its use as a process fuel.
3. Results
Table 3 summarizes the energy and CO2 balance for the on-site production of algal lipid while figure 4 displays the fossil and petroleum energy use for algal biodiesel and conventional LS diesel. Conventional LS diesel emissions are from GREET (2011). The well to pump (WTP) and pump to wheel (PTW) stages are shown for each fuel. The WTP stage includes all activities up through fuel delivery to the filling station. The PTW stage includes all aspects of vehicle operation (combustion) but not vehicle manufacturing. The sum of WTP and PTW is the whole fuel cycle result, also called the well to wheels (WTW) result.
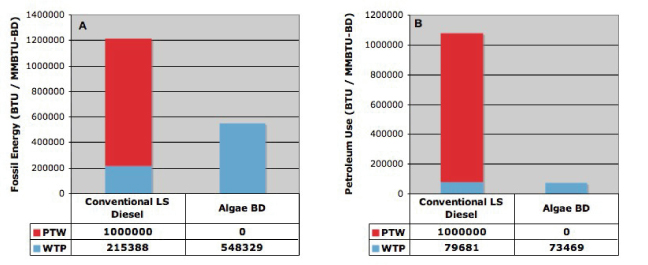
Figure 4. Energy use per million BTU of biodiesel. Algal biodiesel reduced total fossil energy use (A) and petroleum use (B) compared to LS diesel although it consumed more fossil energy during its production.
Download figure:
Standard imageFigure 5(A) displays the GHG emissions by stage while 5B breaks down the WTP emissions. Given the expected future demand for electricity, a power plant will emit CO2 whether algae are grown or not. Therefore, power plant CO2 supplied to the pond is taken as a credit (biogenic carbon credit) even though the carbon was derived from fossil sources. This treatment is consistent with other algae LCAs although the assumption is not always explicitly articulated (Kadam 2001, Lardon et al 2009, Clarens et al 2010, Stephenson et al 2010). As a result, the breakdown of the WTP portion in figure 5(B) shows that significant emissions incurred during biofuel production and delivery are offset by the biogenic carbon credit and, secondarily, by the displacement credit for digestate used as fertilizer.
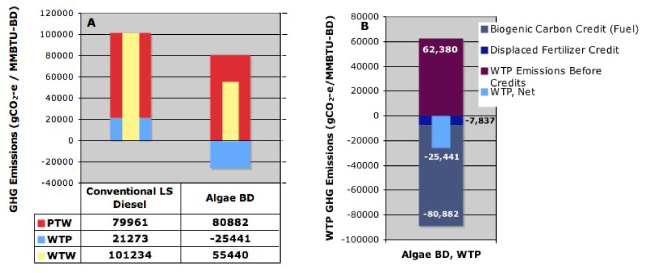
Figure 5. GHG emissions per million BTU of biodiesel. In the baseline production scenario, whole-life greenhouse gas emissions from algal biodiesel were less than those from LS diesel (A) because of a substantial CO2 credit for re-use of carbon in the flue gas (B).
Download figure:
Standard imageFigure 6(A) displays a breakdown of the WTW emissions to show the GHG contributions from fugitive methane emissions during AD and from direct N2O emissions from digestate used as fertilizer. Figure 6(B) breaks down the net credit for fertilizer displacement by the digestate. Substantial credits from fertilizer displacement and from sequestration of 8% of the carbon (Bruun et al 2006) in the digestate (treated as biogenic) are offset by emissions from transportation to the field and by direct N2O emissions.
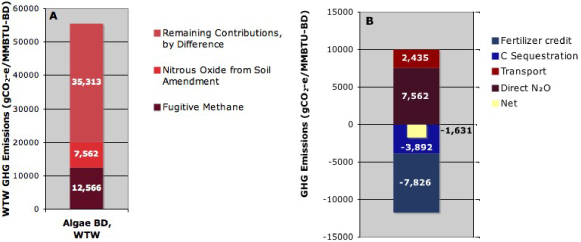
Figure 6. GHG contributions per million BTU of biodiesel. (A) In the baseline production scenario, fugitive methane emissions and direct N2O emissions from digestate applied to soil were a substantial fraction of the total WTW emissions. (B) The N2O emissions largely canceled the fertilizer displacement credit.
Download figure:
Standard imageThe sensitivity analysis in figure 7 considers low and high values for several parameters. The 'extraction without CHP heat recovery' scenario indicates the additional emissions that would occur if heat for solvent recovery could not be obtained from the CHP system, e.g., if extraction occurred at a regional facility. The 'wet gasification' scenario replaced the AD with the CHG process with 95% N recovery and either 0% (low) or 95% (high) P recovery. The culture mixing power variations correspond to mixing speeds of 20, 25, and 30 cm s−1. The low hexane extraction scenario consumed 0.5 Whthermal/g-oil of heat and 0.1 Wh/g-oil of electricity, while the high scenario consumed 3 Whthermal/g-oil of heat and 1 Wh/g-oil of electricity. The 'no additional N2O from digestate solids' scenario assumed equal N2O emissions from the digestate and from the displaced fertilizer.

Figure 7. Sensitivity analysis. See text for details.
Download figure:
Standard imageFigure 8 shows GHG emissions as a function of the algal lipid fraction and as a function of the algal productivity with all other parameters as in the lower-emission scenario. The GHG emissions for the lower-emissions scenario (35 wt% lipids and 25 g m−2 d−1 productivity) were 40 000 g CO2-e, i.e., 28% less than the baseline scenario.

Figure 8. Lower-emission scenario GHG emissions and direct electricity demand. (A) GHG dependence on lipid fraction. The pink X at 35 g m−2 d−1 shows the lower-emissions scenario result discussed in the text. The light-blue curves marked 'low mixing' have the electricity demand assumed for mixing and pumping during growth reduced by 50%. (B) Electricity demand dependence on lipid fraction. Dashed curves with open symbols show demand while solid curves with solid symbols show imported electricity. (C) and (D) show dependence on productivity.
Download figure:
Standard image4. Discussion
The lipid content and productivity of future algal systems are highly uncertain; hence, this analysis examined the dependence of GHG emissions over a broad range of these variables. These variations were compared against a baseline scenario in which the lipid fraction, productivity, and pathway operations were selected to facilitate comparisons with evolving technoeconomic analyses (TEA) (Davis et al 2011). When these choices were combined with the AD methane yield and energy consumption estimates, the on-site electrical energy balance was negative and 25% of the on-site electrical demand must be imported, but only 69% of the recovered heat was used. Note that Alipid in equation (1) is therefore equal to one because no CHP power is exported. The allocation factor for the conversion step, Aconversion, was 0.90. The lower-emission scenario produced the same allocation factor values.
Algal biodiesel production and use in the baseline scenario required less fossil energy and less petroleum energy than did petroleum LS diesel. These reductions occurred because the PTW (combustion) stage utilized renewable energy. The fossil energy use for algal biofuel production, though, was 2.5 times higher than for LS diesel production, largely from electricity consumption and from fertilizer manufacturing. Petroleum consumption during fuel production was comparable to LS diesel and occurred during transportation of fuels and intermediates.
GHG emissions, figure 5(A), were substantially less for algal biodiesel than for LS diesel because the carbon in the algal biofuel was treated as biogenic. Also, shown in figure 5(B), substantial emissions during production were offset by the large biogenic carbon credit and by a relatively small credit from displaced fertilizer. Since some biogenic carbon, taken up as CO2, may be emitted as methane with a higher global warming potential, the biogenic carbon accounting must be handled carefully. Details are described in Frank et al (2011b).
The fertilizer credit is examined in figure 6(B). The credit for displaced fertilizer is almost canceled by the N2O emission burden when computed by IPCC methods. These emissions exceed those for the displaced fossil-based fertilizer because the IPCC method considers all nitrogen in the soil amendment, but only the bioavailable fraction (40%) displaces fertilizer. This is not the only treatment possible, but a recent review (IPCC 2010) revisited this topic in light of the more than 1000 publications released since the 2006 IPCC report on N2O emissions from soils. The expert panel concluded that the 2006 guidelines were correct; however, the data indicated that disaggregating the emission factor by region, climate, and soil might introduce significant variations in emissions. Furthermore, the panel commented that only 10% of the studies considered organic fertilizers and that the relationships among the mineral/organic N fractions in the fertilizer, C/N ratio, and quality of organic C may have strong effects on N2O emissions. In the work presented here, C/N was 14 for the digestate.
The AD literature survey indicated significant uncertainty in methane yield and nutrient recovery and scant performance data either at scale or for LEA. Therefore, the lower-emission scenario replaced AD with CHG. CHG is quite different from other gasification processes. Although CHG produces a gas product (methane), all reactions occur as liquid phase, making CHG a catalyzed thermochemical digester rather than a conventional gasifier. The CHG process has shorter residence time and smaller footprint, than AD so, using the natural gas processing industry as an analog, lower fugitive methane emissions seem plausible. Furthermore, nutrient recovery during CHG produces mineralized nitrogen in a sterile water phase that ought to be usable by algal cultures. By contrast, the AD supernatant will contain many moieties besides the mineralized nitrogen and soluble phosphorus; hence, questions remain about nutrient recycling for algae by AD.
The effect of the lipid fraction on energy consumption and GHG emissions is complex. Higher lipid fractions require less biomass per pound of produced lipid thus reducing cultivation energy demand. The associated reduction in the non-lipid fraction, though, decreases the renewable electricity recovered on-site. Figure 8(A) indicates that for three productivities studied, there was a net GHG benefit from increasing the lipid fraction; however, the benefit was limited (asymptotic) after an initial rapid change at low lipid fractions. The plot of electricity balance in figure 8(B) shows that, although the electricity produced per pound of lipid and the electricity demand all decrease monotonically with lipid fraction, electricity production and demand changed at different rates so that their difference (the imported electricity) can either increase or decrease with lipid fraction. This illustrates the interplay between algal composition, energy recovery, and energy demand. Similarly, the effect of productivity on GHG emissions (figure 8(C)) and electricity consumption (figure 8(D)) also shows asymptotic behavior.
Presumably, the values of the asymptotes in figure 8 are determined by the on-site energy intensity. To test this idea, the paddle wheel power for mixing the pond and the power for pumping the culture to and from settling were arbitrarily reduced by a factor of two for the 50 g m−2 d−1 and for the 50% lipid scenarios. This caused the curves to shift downwards and approach a lower asymptote (light-blue curves with solid circle, figures 8(A) and (C)).
These scenarios highlight the importance of several factors. First, the asymptotic behavior mitigates uncertainty in the GHG result arising from the lipid fraction and productivity parameters: Davis et al (2011) concluded that 25 wt% lipids at 25 g m−2 d−1 would not give economically viable biofuels for a pathway very similar to the one studied here yet a higher performance in these values pushes into the asymptotic region where resulting changes in GHGs will be modest. Second, there is an important balance in the pathway between improved process efficiency and decreased on-site power production that occurs when lipid fractions are increased. The belly in the curve for 50 g m−2 d−1 with reduced mixing power in figure 8 hints that there might be scenarios in which maximum GHG reduction may not occur at maximum lipid fraction.
5. Conclusions
Algal biofuel production, as modeled here, is energy intensive. Nevertheless, substantial reductions in GHG emissions (45%–60% compared to conventional LS diesel) were achieved in the model due to the non-fossil treatment of the carbon in the biofuel and because substantial energy and nutrient recovery credits from processing of residuals were included. Fugitive methane and N2O emissions totaled 14% and 23% of the whole pathway GHG emissions. A great deal of the direct energy demand derived from water movement to maintain the culture in suspension and to move it to and from the first dewatering step. Many key parameters driving algal biofuel LCAs hinged on biogas production: yields from digesters, yields from gasification, fugitive emissions, nutrient recovery rates, and electrical efficiency of the CHP generator. An algal biofuel operation at the 25 million gallons per year scale would produce 30 MW of electricity, all of which would be consumed on-site. Considered as a biogas production operation, this makes the facility roughly ten-fold larger than the largest current biogas operations. Yet, there are significant concerns about methane losses during biogas production and handling. Technoeconomic modeling of algae processes must choose technologies that control these emissions. Future LCAs require better data on fugitive emissions and must account for unrecovered nitrogen leading to N2O. Nitrogen transported to fields to displace mineral fertilizers has the potential to produce N2O emissions in the field, but the literature is unclear regarding emission factors and the results are likely site-dependent, largely dependent upon the soil chemistry. Agricultural construction techniques may offer an opportunity to reduce capital costs substantially; however, these techniques need careful evaluation with regard to fugitive emissions including long-term hermetic integrity.
Lipid fraction and productivity are two of the strongest drivers of economic viability (Davis et al 2011). For the system studied here, changes in lipid fraction and productivity required for economic viability would also reduce GHG emissions although with rapidly diminishing returns. Nevertheless, TEA and LCA have harmonious needs for these parameters. Care must be taken, though, because the large global warming potential for methane could make the costs for controlling methane emissions higher than the economic value returned. In that case, sustainability and economic drivers would be at odds.
Acknowledgments
This work was sponsored by the Office of Biomass Program (under DOE's Office of Energy Efficiency and Renewable Energy). Argonne National Laboratory is a DOE laboratory managed by UChicago Argonne, LLC, under Contract No. DE-AC02-06CH11357.