
Abstract
The majority of the world's food production capability is inextricably tied to global precipitation patterns. Changes in moisture availability—whether from changes in climate from anthropogenic greenhouse gas emissions or those induced by land cover change (LCC)—can have profound impacts on food production. In this study, we examined the patterns of evaporative sources that contribute to moisture availability over five major global food producing regions (breadbaskets), and the potential for land cover change to influence these moisture sources by altering surface evapotranspiration. For a range of LCC scenarios we estimated the impact of altered surface fluxes on crop moisture availability and potential yield using a simplified linear hydrologic model and a state-of-the-art ecosystem and crop model. All the breadbasket regions were found to be susceptible to reductions in moisture owing to perturbations in evaporative source (ES) from LCC, with reductions in moisture availability ranging from 7 to 17% leading to potential crop yield reductions of 1–17%, which are magnitudes comparable to the changes anticipated with greenhouse warming. The sensitivity of these reductions in potential crop yield to varying magnitudes of LCC was not consistent among regions. Two variables explained most of these differences: the first was the magnitude of the potential moisture availability change, with regions exhibiting greater reductions in moisture availability also tending to exhibit greater changes in potential yield; the second was the soil moisture within crop root zones. Regions with mean growing season soil moisture fractions of saturation >0.5 typically had reduced impacts on potential crop yield. Our results indicate the existence of LCC thresholds that have the capability to create moisture shortages adversely affecting crop yields in major food producing regions, which could lead to future food supply disruptions in the absence of increased irrigation or other forms of water management.
Export citation and abstract BibTeX RIS
1. Introduction
In order to meet the requirements necessary to fuel and feed the nearly seven billion people that currently populate Earth, managed croplands and pastures have grown to rival global forests in extent and occupy 30–40% of Earth's ice-free land surface (Ramankutty et al 2008), with croplands alone representing 10–15% of Earth's total terrestrial biological productivity, making them a key component of the Earth system (Bonan 1997, Foley et al 2005, Bala et al 2007, Haberl et al 2007).
With the human population expected to reach approximately 9 billion by 2050, and personal wealth and health anticipated to increase, the demand for food and energy will continue to rise. It has been estimated that an increasing population and changing diet will require between a ∼80 and 120% increase in global food production by 2050 (Tilman 2001, FAO 2006, Foley et al 2011). By necessity this increase in food production will be achieved through a combination of technological improvements and conversion of natural ecosystems for agriculture (Licker et al 2010). With society already approaching or surpassing several biophysical thresholds that broadly define a safe environmental operating space for humanity (due in part to changing global landscapes and increasing food requirements), it is vital to understand what impacts future land use changes may have on crop production (Rockström et al 2009, Foley et al 2011).
In addition to anthropogenic emissions of greenhouse gases and their warming effect on global surface climate, land cover change (LCC) impacts fluxes of energy, momentum, and moisture to the atmosphere, thereby also influencing climate on local and regional scales. A host of studies have shown that changes in global agricultural productivity are fundamentally related to alterations in climatic variables such as temperature and precipitation (Lobell and Asner 2003, Lobell and Field 2007, Kucharik 2008, Deryng et al 2011, Hsiang et al 2011). While several studies have investigated how potential crop yields may be influenced by changes in climate due to anthropogenic greenhouse gas forcing, there have not been any global climatological assessments of the impacts of changing land cover on global potential crop yields.
In this study we examined the potential impacts that changing land cover may have on the major food producing regions of the world. We used a combination of models and observations to bound the extent that changes in evapotranspiration due to LCC may influence crop moisture availability and potential crop yields in Earth's breadbaskets. Specifically we addressed the following questions.
- (1)From where does the moisture for the major food producing regions of the world come?
- (2)To what extent does natural (not already cleared) vegetation provide the regional evaporative moisture source for precipitation over breadbasket regions?
- (3)What is the potential for moisture sources of Earth's breadbaskets to change due to alterations in land cover surrounding the breadbasket?
- (4)How could changes in the moisture sources affect potential crop yield in breadbasket regions?
2. Data and models
In order to examine the questions posed above, we considered five major food producing regions representing diverse crops and climatological conditions. We obtained observational and reanalysis datasets describing crop and pasture extent, growing season length, evaporative source and climatological atmospheric variables. We then used a state-of-the-art global ecosystem model to simulate impacts of LCC on surface fluxes and potential crop yields. The data sources, model and estimation procedures are described below.
2.1. Defining major breadbasket regions
We used crop specific yield and harvested area data (Monfreda et al 2008) to define five major breadbaskets. By combining national, state and county level census statistics with several global satellite products, the data of Monfreda et al provided observed harvested area and yield for a multitude of crops on a global 5' × 5' grid (∼9 km × 9 km at the equator) around the year 2000. In this study we limited our focus to three prevalent primarily rainfed crops: maize, spring wheat and soybeans. Combined, these three crops make up approximately 40% of global cropland (Leff et al 2004) (supplemental figure 1 available at stacks.iop.org/ERL/7/014009/mmedia). The primary crop missing from this study was rice, due to its unique and generally irrigated growing conditions. Additionally, we used the composite fractional area of all croplands and pastures using data from Ramankutty et al (2008) (supplemental figure 1(d) available at stacks.iop.org/ERL/7/014009/mmedia), and a potential vegetation dataset for our reference vegetation (Ramankutty and Foley 1999).
The observed growing season for each crop was estimated using planting/harvesting data from observational data compiled in Sacks et al (2010). That study primarily used data from the United Nations Food and Agriculture Organization (FAO) and the United States Department of Agriculture (USDA) to construct global maps of planting/harvesting dates for 19 crops, which represented 71% of the globally cultivated area.
Using the crop data, we selected five regions as breadbaskets to be the focus of this study. These regions are shown in figure 1. They include maize in the Midwest United States (US), soybeans in Southeast South America (SA), maize in West Africa (WA), wheat in the Central Asian wheat belt (CAS) and wheat in East Asia (EA). The observed median planting and harvest dates for each region are shown in table 1.

Figure 1. The maize (yellow), soybean (green) and wheat (blue) breadbasket regions used in this study.
Download figure:
Standard imageTable 1. Median planting and harvest dates of crops for each region using data from Sacks et al (2010).
| Region | Plant date | Harvest date |
|---|---|---|
| East Asia wheat | March 30 | July 31 |
| Central Asia wheat | May 18 | September 3 |
| North America maize | May 11 | October 18 |
| South America soybeans | November 24 | April 16 |
| West Africa maize | May 31 | September 31 |
The breadbasket regions shown in figure 1 were chosen taking several factors into account. First, we selected regions that represented major crop producing regions. Second, regions were selected to be geographically distinct and represent unique biomes. Also, winter wheat growing regions were excluded as surface fluxes of moisture and energy tend to be relatively small for much of this crop's growing season, and modeling of winter wheat crop yields present unique challenges beyond the scope of this work. This prohibited investigation of the extensive Indian and Western European wheat growing regions observed in supplemental figure 1(b) (available at stacks.iop.org/ERL/7/014009/mmedia). Finally, we selected regions that represented a diverse set of climatological and meteorological conditions. The US and CAS regions represented agricultural regions where precipitation is largely influenced by midlatitude storm tracks. The SA region encompasses a relatively large range in latitude and is influenced by a combination of the tropical movement of the Intertropical Convergence Zone (ITCZ) and midlatitude systems. Precipitation in WA is strongly tied to seasonal movements of the ITCZ and tropical dynamics. Finally, EA represents a midlatitude crop growing region where the moisture for crop production is influenced by monsoonal systems (Wallace and Hobbs 1977, Hastenrath 1991).
2.2. Evaporative source data
The sources of water that precipitated over breadbasket regions were found using an evaporative source (ES) dataset developed in Dirmeyer and Brubaker (1999, 2007) and Brubaker et al (2001). For each terrestrial gridpoint on a global T62 Gaussian grid (∼1.9°× 1.9° at the surface on the equator), this source provided a 25 yr (1979–2004) mean monthly climatology of where the precipitation that fell over a given point last evaporated from Earth's surface (mm H2O m−2). These data have been used in a variety of applications including studies of moisture recycling, hydrological feedbacks of floods in the Midwest United States, and estimates of atmospheric water vapor transports between countries (Dirmeyer and Brubaker 2007, Dirmeyer et al 2009, Dirmeyer and Kinter 2010). For more details of the ES data see supplementary information (SI1 available at stacks.iop.org/ERL/7/014009/mmedia). There are alternative methods for calculating ES such as those by Yoshimura et al (2004) and van der Ent et al (2010). While a full comparison of these methods is beyond the scope of this study, we do acknowledge that our results may vary to some degree with alternative methods for ES estimation. Here, we used the ES dataset to calculate the total ES footprint of moisture that precipitates over the fraction of each breadbasket region containing the specified crop. This was aggregated over the growing season of each of the breadbasket regions, with the growing season defined as the time interval between the observed median planting date and median harvest date (table 1). 30 yr mean NCEP reanalysis-II 850 mb fields were also used in this analysis (Kanamitsu et al 2002).
2.3. Simulating LCC and potential crop yield using the PEGASUS model
To determine changes in surface fluxes of moisture associated with LCC, and potential changes in crop yield associated with changing moisture availability, we used 25 yr runs of the Predicting Ecosystem Goods and Services Using Scenarios (PEGASUS) model described in Bagley et al (2011) and Deryng et al (2011). To simulate the effects of LCC, PEGASUS used a set of fifteen biomes and three crops (maize, soybean and spring wheat) to describe the vegetative state at each gridpoint. The biome assigned to any gridpoint was manually altered to represent a change in surface cover by LCC. Associated with each biome were a set of literature-derived parameters describing water, energy, and nutrient properties.
Potential crop yields in PEGASUS were calculated by integrating the effects of climate, planting dates, crop specific irrigated areas, cultivar choices and fertilizer choices for maize, wheat and soybeans. For this study, nutrients were assumed to be unlimited, planting and harvesting dates were set to those currently observed using the planting/harvesting data from Sacks et al (2010), and all crops were assumed to be rainfed, assumptions that we examine later in this letter. The sensitivity of potential crop yields in PEGASUS to changes in precipitation and moisture availability can be found in Deryng et al (2011). Further description of the PEGASUS model, and its simulation of surface energy balance and potential crop yield can be found in the supplemental information (SI2 available at stacks.iop.org/ERL/7/014009/mmedia).
2.4. The linear moisture availability model
To determine the potential impact of LCC on breadbasket moisture availability via alterations to a region's ES we developed a simple linear model. To begin, the total moisture availability (M) at gridpoint i (mm H2O day−1 m−2) can be written as:

where s is the ES (mm H2O day−1 m−2) of gridpoint i at gridpoint j,n represents the global number of gridpoints, and A (m2) is the area represented by a given gridpoint. Next we assumed that fractional change in ES for gridpoint i due to LCC at gridpoint j was equal to the fractional change in surface evapotranspiration E (mm H2O day−1):
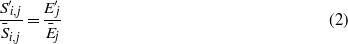
where overbars indicate climatological means, and primes indicate perturbed values due to LCC. Thus the fractional change in moisture availability (F) due to LCC can be written as:
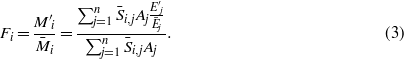
Equation (3) allowed us to estimate potential changes in moisture availability in breadbasket regions for LCC scenarios, and required only fractional changes in evapotranspiration from each scenario. These changes in evapotranspiration were modeled with PEGASUS and depended on soil and vegetative properties, as well as climatological rates of precipitation. Essentially, the linear model assumes that fractional changes in ES for any grid point proportionally change the precipitation and hence moisture availability at all downwind grid points, as determined by the ES dataset. It should be noted that although changes in atmospheric circulation and stability are key to fully encompass changes in precipitation due to LCC (Charney 1975, Eltahir 1996, De Ridder 1997, Nobre et al 2009), they are not accounted for in this study in order to focus exclusively on changes in moisture availability due to alterations in moisture supply from LCC, and results should be interpreted with this caveat in mind. Depending on whether the circulation and stability feedbacks on precipitation are negative or positive, our approach may overestimate or underestimate the impact of LCC on cropland moisture availability.
To estimate the maximum potential impact of LCC on breadbasket moisture availability, we simulated two 25 yr scenarios using the PEGASUS model. In the first, we set the land surface to potential vegetation and precipitation to CRU 2.1 30 yr monthly means linearly interpolated to daily values. This scenario represented the climatological means ( in equation (3). In the second scenario all land that was not agricultural land, as depicted in supplemental figure 1(d) (available at stacks.iop.org/ERL/7/014009/mmedia), was converted to bare soil. This represented the maximum potential impact of LCC on moisture flux (although other possible conversions such as vegetation to urban landscapes could have larger impacts on moisture fluxes). This scenario represented the perturbed values due to LCC in equation (3) (E'j,M'j). Using equation (3) we estimated the potential change in breadbasket moisture availability for points containing a given crop within each breadbasket region shown in figure 1. Finally, 25 yr PEGASUS model simulations with precipitation patterns altered to reflect changes in moisture availability as calculated above were integrated to calculate changes in potential crop yield relative to climatological conditions. Additionally, a series of LCC scenarios were considered by limiting LCC to encroaching areas around breadbasket regions excluding land already under agricultural usage and incrementally increasing the magnitude of LCC (SI3 available at stacks.iop.org/ERL/7/014009/mmedia).
3. Results
3.1. The evaporative source of breadbasket moisture availability
To investigate the potential impacts of land cover change on the breadbasket regions, we determined the spatial patterns of ES for each region. The ES (shaded) results are shown in figure 2, along with the fractional area of the crop (contours) and NCEP reanalysis-II climatological 850 mb wind vectors.
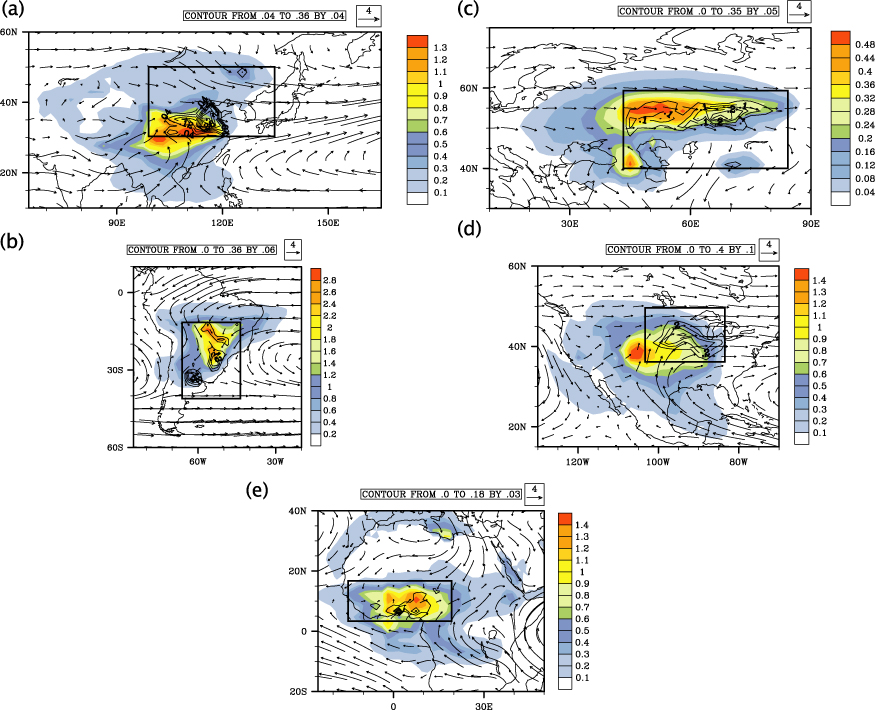
Figure 2. Evaporative source (mm H2O m−2) of crop growing sections of each region during its growing season as defined by the planting/harvesting dates shown in table 1 (shaded). Also shown are the observed crop fractional area ( − ) (contours), NCEP Reanalysis-II 850 mb climatological winds (m s−1) (arrows), and breadbasket regions (terrestrial locations within black boxes).
Download figure:
Standard imageIn East Asia (figure 2(a)), there was evidence of extensive moisture recycling within the region, with much of the moisture that precipitates over wheat last evaporating off the surface from the region itself. The East Asia region also had a long westward tail that followed the grassland and mixed forest biome to the north and west of the Gobi Desert, which contributed significant amounts of moisture to growing season moisture availability in the northern portion of the breadbasket region. Meanwhile only a small percentage of wheat's moisture source in the region originated over the ocean, and that evaporation was largely constrained to the Yellow Sea and South China Sea. This was related to circulation patterns associated with the East Asian summer monsoon, which is the climatologically dominate feature throughout much of the April–July growing season of wheat in the region (Lee et al 2008).
For the Central Asian wheat belt region, the ES pattern was primarily zonal for the May–August growing period, with large amounts of moisture recycling (figure 2(c)). This was anticipated given the large range of longitude (∼40°) encompassed by the region and the zonal flow of climatological winds in the region. In the extensive wheat crops of the Ukraine, Kazakhstan and Russia the moisture availability was largely dependent on water supplied by terrestrial evaporation from Eastern Europe and local sources. This region had a very limited oceanic influence, although the Black Sea and Caspian Sea did contribute to the ES.
In the Midwestern United States, moisture for maize growth is largely supplied by terrestrial evaporation to the southwest of the main growing region (figure 2(d)). Here, the regional recycling appeared to be small relative to other regions. There was also a clear influence in the US maize's ES from the Gulf of Mexico. Previous studies have found significant variations in precipitation in the United States to be correlated to changes in the nocturnal low-level jet of southerly flow from the Gulf of Mexico over the Great Plains, as well as changes in circulation associated with El Nino (Helfand and Schuber 1999, Hu and Feng 2001). Helfand and Schuber (1999) estimate that approximately one-third of the moisture entering the United States enters via the Great Plains low-level jet. This suggests that potential land cover changes which alter the ability of the surface to absorb and re-transpire moisture as it moves from the Gulf of Mexico to the maize crop in the Midwestern United States may significantly influence moisture availability and productivity of the region.
In the South American region (figure 2(b)) we found that the climatological ES footprint for soybean producing areas was largely terrestrial for the November–April growing season. With the Andes physically bounding the west side of the region, much of the moisture that contributes to soybean crops comes from the north and northwest, with a substantial fraction of the ES being located over the Brazilian Amazon. Nearly the entire terrestrial ES resides within the region, indicating large moisture recycling. This is of particular consequence for this region, as multiple studies have indicated that human modifications to the area have the potential to drastically reduce evapotranspiration (Dickinson and Henderson-Sellers 1988, Zhang and Henderson-Sellers 1996, Snyder et al 2004). Additionally, this is a critical region for investigation of water vapor transport, with ∼15% of the Brazilian rainforest already converted to agriculture, and modeling studies suggesting that vegetation in this region may be susceptible to diebacks due to positive feedbacks associated with reduced water vapor flows (Oyama and Nobre 2003).
Finally, for West African wheat, the June–September growing season is directly related to the Northward movement of the ITCZ, with peak rainfall typically lagging its passage by several months (Hastenrath 1991). Figure 2(e) shows that the terrestrial ES is relatively local, with significant contributions from the tropical rainforest and savanna regions of Central Africa, and is negligible to the north due to the presence of the Sahara Desert. There was also evidence that a large fraction of the West African wheat ES footprint is oceanic relative to other regions.
3.2. Potential impact of land cover change on breadbasket evaporative source, moisture availability and crop yield
Figure 3 provides quantitative estimates of the ES contribution for relevant areal groupings, and shows the total potential impact of LCC on ES. We found that the impact of removing vegetation from regions not under agricultural usage typically reduced moisture availability for breadbasket crops between 6 and 17% (yellow bars in figure 3, table 2), and potential crop yields from 1 to 17% (table 2). The smallest impact on moisture availability was found to be for North American maize, and the largest were South American soybeans and Central Asian wheat. These changes impacted potential crop yields greatest in the East and Central Asian wheat and North American maize regions, and least in the West African maize region. Additionally, as described in supplemental information (SI3 available at stacks.iop.org/ERL/7/014009/mmedia), the rates at which breadbasket regions responded to different magnitudes of LCC around a region varied greatly. Large fractions of the potential changes in moisture availability in Central Asia (table 2; figure 3) were found to occur with the first 20% of maximum potential LCC (supplemental figure 2 available at stacks.iop.org/ERL/7/014009/mmedia), while other regions had a more gradual response.

Figure 3. The growing season contribution of different surface classes to the total ES (gray) for each breadbasket region. For each graph the ocean (blue) and land (green) categories sum to the total ES. These represent the magnitudes of the oceanic and terrestrial sources of moisture for each region. The region category (brown) represents the amount of precipitated moisture that last evaporated from the region itself (the black bar within it represents that which evaporated off the specific crop in the region). The agricultural land shows the total moisture contributed by crops and pastures to breadbasket precipitation, with the remaining available land being labeled non-agricultural land. The non-agricultural land and managed land sum to the total land. Finally, the yellow bars show the ES of unmanaged land and total ES for the total LCC scenario.
Download figure:
Standard imageTable 2. Modeled per cent change in moisture availability over crops within breadbasket region and potential crop yield due to LCC relative to the control simulation (yellow bars in figure 3). These values were calculated by estimating the fractional change in precipitation for every crop gridpoint within each breadbasket region using the linear model (equation (3)). 25 yr simulations of the PEGASUS model with reduced moisture availability were used to determine the change in potential crop yields relative to control simulations. Also shown is the soil moisture fraction ( − ) for the PEGASUS control run, and the change in soil moisture index ( − ) for the LCC run (in parentheses).
| Region | Modeled % change in moisture availability | Modeled % change in potential crop yield | Control soil moisture fraction |
|---|---|---|---|
| East Asia wheat | −11.89 | −7.47 | 0.46 (−0.05) |
| Central Asia wheat | −16.70 | −17.11 | 0.39 (−0.05) |
| North America maize | −8.34 | −7.62 | 0.49 (−0.05) |
| South America soybeans | −16.90 | −5.08 | 0.79 (−0.08) |
| West Africa maize | −9.64 | −1.07 | 0.93 (−0.02) |
There were several factors that contributed to the large reduction of ES for Central Asian wheat and South American soybeans with the removal of natural vegetation from non-agricultural land (figures 3(b) and (c); table 2). A large contributor to this was that the moisture sources for these regions tended to be densely concentrated over heavily forested biomes, where LCC has been found to most strongly influence growing season evapotranspiration. This impact was especially evident for South American soybeans where approximately 60% of the evaporative source for region's soybeans was recycled within the region, and a significant portion of that was from tropical rainforests, where vegetation removal has been shown to significantly reduce moisture flux to the atmosphere (Gash and Nobre 1997, Fisch et al 2004, Bagley et al 2011).
In the case of Central Asian wheat, the relatively small magnitude of total precipitation over the growing season coupled with the impact of temperate deciduous forest encompassing a significant fraction of the ES footprint played a large role on the impact of the removal of vegetation on crop water availability. Temperate deciduous forests transpire large amounts of moisture during the summer growing season. When this terrestrial moisture source to the atmosphere is replaced exclusively by evaporation from Earth's surface, the soil must be relatively moist to maintain high evaporation rates. If this is not the case, water that precipitated over devegetated regions gets partitioned into soil and groundwater storage and runoff and does not immediately return to the atmosphere. As shown in table 2, the modeled growing season soil moisture fraction (actual water content/field capacity water content) for the Central Asian wheat region was significantly lower than that of the South American soybean region. As a result, when vegetation cover was removed, leaving behind bare soil, the evapotranspiration and hence ES over the non-agricultural land was significantly reduced for this region. This relationship between soil moisture fraction and potential crop yield impact was consistent across breadbaskets. Potential crop yield in regions that had modeled climatological soil moisture fractions >0.5 had limited susceptibility to reduced precipitation due to LCC.
4. Discussion
By comparing the patterns of land surface water flux and lower atmospheric circulation among regions, we were able discern the major climatic influences on breadbasket moisture availability. Additionally, we estimated the potential impact of land cover change on breadbasket moisture sources, with the assumption that perturbations to atmospheric regional circulation and local stability are a secondary response to land cover changes.
We found that moisture availability in regions that had large fractions of their ES contribution from terrestrial locations were particularly susceptible to changes in ES with land cover change. These regions included the East Asian wheat, Central Asian wheat and South American soybean regions. Moreover these impacts were magnified in regions where LCC removed vegetation that was identified as large sources of water vapor during the crops' growing seasons. This was particularly evident for the Central Asian wheat and South American soybean regions, where deciduous or tropical forests were a significant source of moisture for precipitation over the crops. In these regions we calculated that LCC had the potential to reduce moisture availability for wheat crops by up to 17%.
Another major factor that controlled the impact of land cover change on breadbaskets appeared to be moisture recycling within the regions. For breadbasket regions such as Central Asian wheat and South American soybeans, moisture that evaporated from within the regions themselves accounted for 47–60% of the total moisture that fell as precipitation over the crops. This demonstrated that ES was relatively concentrated in area and that natural vegetation within these areas was strongly transpiring and hence susceptible to LCC. Therefore, it is expected that moisture availability and potential crop yield could be more susceptible to reductions due to land cover change in these regions.
Although moisture availability for crops in all regions were found to be somewhat vulnerable to changes in evaporative sources due to LCC, with potential reductions of 7–16%, their prospective impact on potential crop yields varied widely among the regions (1–17% range in reduction of potential crop yield). There were two key variables that explained differences in potential crop yield. The first was the magnitude of potential moisture availability change, with regions exhibiting greater potential reductions in moisture availability tending to also show greater changes in potential crop yield. The second was the soil moisture fraction within root zones. Regions that had climatological soil moisture fractions greater than ∼0.5 tended to minimize potential crop yield impacts from changing moisture availability.
These results indicate that alterations to surface energy and moisture fluxes due to LCC have the potential to influence the moisture availability and crop yield over major breadbasket regions of the world. Many of the results presented here assume extreme scenarios of LCC and no nutrient limitations for crop growth. Although smaller increments of LCC are addressed in the supplemental information (SI3 available at stacks.iop.org/ERL/7/014009/mmedia), we have not tested how the impacts of LCC may be altered on crops that do not have optimal levels of fertilizer. The relaxation of our nutrient assumption may cap the impacts of moisture deficits on potential crop yield, as other factors become limiting. Additionally, although the majority of the crops in this study are currently rainfed, changes in irrigation may be capable of partially mitigating the impacts of LCC, particularly in regions where LCC leads to increased moisture runoff. The assumption of LCC from natural vegetation to soil is also extreme. While this is an underestimate of changes associated LCC from urban growth, for the more general conversion of natural vegetation to additional crop or pasture the reduction in evapotranspiration is overestimated during the growing season. A final aspect of LCC that this study did not address is the impact of LCC on crop yields due to changes in regional temperature. Multiple studies have shown that LCC has the potential to significantly alter local and regional surface temperature through altered surface fluxes, particularly in tropical, boreal and irrigated regions (Foley et al 2005, Bala et al 2007, Kueppers et al 2008, Bagley et al 2011, Loarie et al 2011). It would be potentially worthwhile to test how changes in temperature due to LCC mitigate or enhance reduction in crop yield due to reduced moisture availability.
This study demonstrates that changes in land cover have the ability to significantly disrupt key food growing regions on the planet, and harm food production in several critical areas. However, it is important to note that there are several limitations to the methods used here. For example, this study did not account for changes in circulation and stability that are important for a full accounting of the impact of LCC on precipitation. As such this study should be viewed as an attempt to quantify the moisture sources of major food producing regions, and a first step toward understanding the full impacts of land cover change on the world's food supply. Further modeling and data analysis should be conducted to confirm, or refute, these results.
The changes being presented here due to LCC are comparable in magnitude to changes in crop yield anticipated from greenhouse warming, where reductions in global crop yield of 5–22% were typically found (Parry et al 1999, Lobell and Field 2007, Nelson et al 2009, Deryng et al 2011). Although the extreme LCC scenarios used in this study are extreme and not representative of likely changes in future land use, these results indicate that in addition to anticipating changing temperature, precipitation patterns, and carbon concentrations associated with climate change, estimates of future agricultural productivity may need to predict impacts associated with changes in land use as well. Further, as demand for natural resources expands to accommodate a rising population, understanding the remote and local impacts of changes in land use on the hydrological cycle and agricultural systems will be vital. As the world's population and demand for food and resources continue to grow, understanding the full impacts of the choices we make for land use will be vital to future prosperity. Although the impact on surface fluxes of energy and water is just one facet of the full impact of land cover change, we have shown in this study that changing the balance of surface fluxes of moisture by physically altering Earth's surface can have important consequences for our ability to efficiently grow food in some of our most productive regions.
Acknowledgments
We would like to thank P West for his helpful comments on early drafts of this letter. Also thanks to the NOAA-ESRL Physical Science Division for providing climatological reanalysis at www.esrl.noaa.gov/psd/. This work was accomplished through financial support from the National Science Foundation.