

Abstract
Cities and urban consumers play a central role in the transition to a decarbonized society. Building on existing studies that identify the significant contributions of lifestyle changes, this study proposes a practical methodology for modeling and exploring city-specific carbon footprint reduction pathways through lifestyle changes to decarbonization. It uses an input–output approach with mixed-unit consumption data and the concept of adoption rates, which is applicable to multiple cities with widely available subnational household consumption data. This paper illustrates the use of this methodology by exploring the consumption-based mitigation pathways of 52 Japanese cities with 65 lifestyle change options covering mobility, housing, food, consumer goods, and leisure domains. The results revealed that city-specific impacts of a variety of lifestyle change options can differ by as much as a factor of five among cities, even in the urban context within the same country. Due to this city-level heterogeneity, the priority options of decarbonized lifestyles, such as among shared mobility, low-carbon diets, and longevity of consumer goods, have shifted between cities. The analysis suggests that ambitious urban lifestyle changes can potentially reduce their carbon footprints to meet the 1.5 °C target. However, due to the overlaps of mitigation potentials between multiple lifestyle change options, the necessary levels of adoption and coverage are extensive (i.e. adoption rates of 0.6–0.9). Importantly, adopting lifestyle changes with an efficiency strategy (e.g. the introduction of end-use technologies) or sufficiency strategy (e.g. behavioral changes in consumption amounts and modes) alone is not enough; the only way to succeed is through the combination of both strategies. This paper calls for a target-based exploration and identification of city-specific priorities of lifestyle change options to facilitate consumption-oriented mitigation policies and stakeholder actions to address the climate impacts of urban consumption.
Export citation and abstract BibTeX RIS

Original content from this work may be used under the terms of the Creative Commons Attribution 4.0 license. Any further distribution of this work must maintain attribution to the author(s) and the title of the work, journal citation and DOI.
1. Introduction
Cities are at the center of the global economy, and urban consumers have an enormous direct and indirect impact on climate change. Their decisions affect conditions far beyond city boundaries (Bailey et al 2019). Urban areas are responsible for as much as 68% of direct and indirect greenhouse gas (GHG) emissions globally (Moran et al 2018). Municipal governments can play a key role in addressing city emissions through policy choices and focused activities such as planning, service provision, regulation, and environmental campaigns, and by providing citizens and businesses with financial, technical, and educational support (Lo 2014). Already, local governments have begun to take a leading role in decarbonization commitments, with nearly 2000 jurisdictions declaring a climate emergency (CED 2020). However, these declarations tend to address territorial emissions, while failing to consider emissions occurring outside the given territory caused by territorial final demand. Given that a majority of goods and services consumed in cities are produced outside the city, consumption-based carbon accounting is a useful tool for measuring and managing the realistic impact of cities on climate change (Peters 2010a, 2010b, Wright et al 2011, Bailey et al 2019).
Consumption-based accounting is relevant to promoting lifestyle changes. In terms of its carbon footprint, household consumption accounts for as much as 58%–72% of global GHG emissions (Hertwich and Peters 2009, Ivanova et al 2016). Reflecting the urgency of addressing consumption and its consequences, lifestyle changes are now considered a key element in decarbonization and have been incorporated into government strategies. The United Nations Environment Programme (UNEP) Emissions Gap Report 2020 states that '(l)ifestyle changes are a prerequisite for sustaining reductions in GHG emissions and for bridging the emissions gap' (UNEP 2020), whereas the European Union (EU) has adopted a strategy emphasizing that 'lifestyle can make a real difference' (European Commission 2018).
Despite the large climate impacts of urban consumption, the necessary types and extent of lifestyle changes in cities to meet the decarbonization target remain unexplored. Recent studies using integrated assessment models of climate change have found significant contributions associated with lifestyle changes (Van Sluisveld et al 2016, Van Vuuren et al 2018, Van Den Berg et al 2019, Saujot et al 2021); however, these studies are predominantly focused on direct emissions at the country or regional level. Studies using input–output analysis and lifecycle assessment (Salo and Nissinen 2017, Lekve Bjelle et al 2018, Wood et al 2018, IGES et al 2019, Vita et al 2019, Moran et al 2020) quantify the potential impacts of lifestyle changes, typically covering avoidance of consumption, shifts to low-carbon modes, and the improvement of products to make them less carbon intensive ones, in line with the avoid-shift-improve framework (Creutzig et al 2018). However, these studies have generally focused on the country or regional level, with only a few exceptions analyzing the issue at the city level (Hersey et al 2009, Dubois et al 2019). Importantly, the quantification of individual lifestyle change options is incapable of establishing the level of change that will be required overall or determine the kind of holistic changes that can bring about full compliance with the decarbonization target. In this context, scenario development can guide and catalyze actions for a sustainability transition focusing on the future (Raskin et al 2004). This has been widely applied to energy and direct GHG emissions using a back-casting approach (Hughes and Strachan 2010), but these scenarios are unable to capture the full impact of the products and services consumed by urban residents. Developing carbon footprint reduction pathways is useful for cities to fully incorporate consumption-oriented mitigation actions and identifying priorities.
These consumption-based mitigation pathways need to reflect the characteristics of individual cities and consider a variety of consumption domains and lifestyle change strategies. From the energy-use perspective, a previous study highlighted that priority policies differ among cities, but its focus was limited to transport and energy consumption (Creutzig et al 2015). From the consumption perspective, the carbon footprints of cities and urban consumers vary markedly between cities globally (Moran et al 2018, Bailey et al 2019) and even between cities within the same country (Minx et al 2013, Jones and Kammen 2014, Jiang et al 2020). Such differences have been explained by income level, urban density, transportation mode, energy sources for heating, size of housing, dietary habits, and household size, which are all closely related to the lifestyles of urban residents. However, what level of impact can be expected from various lifestyle changes and in what ways are the priority options different for different cities has not been well understood.
The methodologies for analyzing carbon footprints and lifestyle changes used in previous studies have limitations in scalability, comparability, and their reflection of physical consumption and substitution. The scope of existing studies on city lifestyle changes has been limited to one or only a few cities (Hersey et al 2009, Dubois et al 2019), making it difficult to scale up the analysis to multiple cities in a comparable manner. Even considering country-level analysis, studies based on the physical amount of consumption (Dubois et al 2019, IGES et al 2019) are subject to the limited availability of common data for cities and inconsistency with respect to national emission inventories. Moreover, studies based on expenditure data lack information on physical consumption patterns (Lekve Bjelle et al 2018, Vita et al 2019, Moran et al 2020), which precludes accurate modeling of shifts in consumption between different items. In addition, the estimation of carbon footprints using household expenditure survey data is subject to underreporting bias (Ihara et al 2009, Shigetomi et al 2014), which limits comparability with a decarbonization target. Finally, as determining the likely range of the uptake of behaviors is difficult, existing studies typically determine it based on a literature review and expert judgment (Wood et al 2018, Vita et al 2019, Moran et al 2020), which makes it difficult to distinguish the full and partial adoption of lifestyle changes and to compare the impacts between different lifestyle change options and between cities.
To overcome these limitations, this paper proposes a practical methodology for quantifying city-specific lifestyle changes using a mixed-unit approach with widely available expenditure and price data to ensure comparability to the decarbonization target. It also proposes an approach for exploring city-specific carbon footprint reduction pathways through lifestyle changes using the concept of adoption rates, avoiding overlaps between different lifestyle change options. This paper illustrates the use of this methodology by exploring consumption-based mitigation pathways of 52 Japanese cities with 65 lifestyle change options covering mobility, housing, food, consumer goods, and leisure domains and both efficiency and sufficiency strategies, aimed at meeting a decarbonization target limiting global temperature rise to 1.5 °C.
2. Method
The practical methodology proposed in this study consists of (a) estimating city-specific household carbon footprints with mixed-unit consumption, (b) quantifying the mitigation potential of various lifestyle changes using the concept of adoption rates, and (c) exploring target-based carbon footprint reduction pathways, taking into account the overlap of the various lifestyle change options. Details of the approach are described in the following subsections.
2.1. Estimating per-capita household carbon footprint of multiple cities with a mixed-unit approach
In this study, the household carbon footprint of multiple cities is estimated using an input–output approach together with mixed-unit consumption data. In many countries, monetary GHG intensity data from a single-country or multi-regional input–output model are available; however, for a more accurate modeling of lifestyle changes, reflection of physical consumption are needed. Insofar as household consumption and price data are widely available from expenditure and retail price surveys at the subnational level in many countries, this study combines country-level GHG intensity data and city-level price and consumption data.
Understanding the differences in physical demand among cities is useful for a more accurate modeling of demand-side changes such as the substitution of consumption items. In this study, the physical amount of household consumption in cities was estimated from city-level expenditure data and price information for items for which price information was available (e.g. mobility distances and energy at home) to reflect different local commodity price (e.g. gasoline and electricity prices). For items for which price information was not available, such as consumer goods, leisure, and services, monetary expenditure data were used. The units of the household consumption and GHG intensity data were hybridized using price data to estimate city-specific carbon footprints as follows:
Here,  is the per-capita carbon footprint of household consumption in city j (in kgCO2e/cap⋅yr), which is given by
  , the mixed-unit GHG intensity of item i (in kgCO2e/physical-unit (e.g. kg, km-passenger, kWh) for selected domains such as food, mobility, and housing and kgCO2e/monetary-unit for other domains (e.g. JPY)), and
  , the per-capita mixed-unit household consumption of item i in city j (in physical- or monetary-unit/cap⋅yr). The mixed-unit GHG intensity is given by the monetary intensity
  (in kgCO2e/monetary-unit) and country-level price data
  (in monetary-unit/physical-unit). The city-specific mixed-unit consumption
  is given by the per-capita household expenditure
  (in monetary-unit/cap⋅yr) and price data
  (in monetary-unit/physical-unit), with adjustment factors for consumption amounts
  and prices
  . Adjustments were made in the expenditures and the physical amount of consumption to match national level top-down data in order to address the possible underreporting bias in the bottom-up household survey data. As the purpose of this study is to explore footprint reduction pathways in comparison to the target based on an understanding of the carbon footprint hotspots and physical consumption patterns, such an adjustment is needed to reflect more realistically the carbon footprint levels and physical consumption patterns consistent with the national statistics. The total household carbon footprints are adjusted to the national inventory plus the emissions from international bunkers at the country level to meet consistency requirements, formulated as follows:

The adjustment factor for consumption amount  (in monetary-unit/monetary-unit) is determined for each component c (group of consumption items) to equalize the country-level carbon footprints estimated from the top-down input–output data
  (in kgCO2e/cap⋅yr) to those estimated from the bottom-up household survey data
  by summing for all items belonging to the group of items under corresponding component C. The total household physical consumption amount is adjusted to the national statistics at the country level as follows:

The adjustment factor of prices  (in price/price) is determined to equalize the country-level household physical consumption amount based on national statistics
  (in physical-unit/cap⋅yr) to that estimated from the bottom-up expenditure survey data
  and price data
  for each item.
With this methodology, city-specific household carbon footprints incorporating physical consumption can be estimated for multiple cities. In the case study, 52 Japanese cities (51 municipalities and the Tokyo metropolitan area) were selected to represent the variety of urban contexts in Japan by including all prefectural capitals and government-designated cities. Sources of the expenditure and price data used in the case study include the 2015 family income and expenditure survey (Statistics Bureau of Japan 2015a), which provides annual expenditure per household over 500 consumption items in JPY/household for each target city, and the 2015 retail price survey (Statistics Bureau of Japan 2015b), which provides the average price for a variety of items in JPY/physical-units in cities. (A comprehensive list of data sources is provided in tables S1 and S2 (available online at stacks.iop.org/ERL/16/084001/mmedia in supplementary information 1) (hereinafter, SI 1)). Using the price information, mixed-unit household consumption data in the target cities was estimated by incorporating physical units. This provides city-level consumption data for energy, housing space, mobility distance, and food (e.g. in kWh, m2, km-passenger, kg), while consumption for other items (e.g. consumer goods and services) are kept in monetary units (JPY).
The monetary GHG intensity was obtained in kgCO2e/JPY from the 2015 embodied energy and emission intensity data for Japan using input–output tables (3EID) (Nansai 2019, Nansai et al 2020), which is converted to mixed-unit intensity in kgCO2e/physical-unit for food, mobility, and housing, and kgCO2e/JPY for other items. The boundary of carbon footprint estimation in this study is the direct emissions of household activities and the indirect emissions through supply chains induced by the final demand of residents of the target city; the indirect emissions from imported products are estimated based on the domestic technology assumption. The adjustments in expenditure and physical consumption were made using government and industrial data sources, including the Japanese input–output tables (JIO) (Ministry of Internal Affairs and Communications 2015), the annual report on energy (Agency for Natural Resources and Energy 2015), and vehicle transport statistics (Ministry of Land Infrastructure Transport and Tourism 2015) (Details and data sources are included in tables S2 and S3). The per-capita carbon footprints of household consumption in the selected 52 cities as of 2015 were estimated. The estimated carbon footprints were classified into 42 components in six domains—mobility, housing, food, goods, leisure, and services—as specified in table S4. (A comprehensive data sources and methodologies is included in section 1 in SI 1.)
2.2. Quantifying city-specific carbon footprint reduction impacts from lifestyle change options
The carbon footprint reduction impact of lifestyle changes can be determined by the reduction or shift in consumption and changes in GHG intensity. The city-specific carbon footprint data incorporating the physical units of consumption estimated in the previous step are useful for a more accurate modeling of the shift of consumption from one item to another. To compare lifestyle change options and cities, it is important to first model the maximum impacts of the uptake of a particular lifestyle change option in a city, and then estimate the partial adoption of the same option and the combination of multiple options. Accordingly, the present study quantifies the carbon footprint reduction impact associated with a particular lifestyle change option as follows:

Here,  is the per-capita carbon footprint reduction impact associated with lifestyle change option k in city j, which is given by the comparison of the scenario
  and baseline carbon footprints
  , given as
The reduced per-capita carbon footprints  under the scenario assuming the adoption of lifestyle change option k in city j are given by the scenario GHG intensities
  and consumption amounts
  as follows:


Scenario GHG intensities  and consumption amounts
  are given by intensity reduction factors
  , amount reduction factors
  , and the adoption rates
  applied to the baseline GHG intensities
  and consumption amounts
  , with consideration given to the increased consumption of some items for substitution
  . To illustrate, the maximum impacts of energy saving from nudging are modeled as reducing the energy consumption for heating and cooling in kWh by amount reduction factors
  , identified from the existing literature. Similarly, the impacts from the maximum adoption of electric vehicles are modeled as reducing the GHG intensity of driving by intensity reduction factor
  , identified from the improved fuel efficiency compared to the existing composition of vehicles. Reduction factors
  and
and  , with values up to 1, are determined based on the theoretical maximum uptake of each lifestyle change option, such as teleworking every day.
  and
and  can be set as negative values to reflect rebound effects, the unintended increase in carbon footprints due to technology or behavioral changes. Substitution of consumption occurs when a consumption mode is shifted to a low-carbon mode, such as a shift from private cars to public transport, as calculated below:
The substituted amount of consumption  by lifestyle change option k is the sum of the reduced consumption of items
  belonging to group
  that are the targets of the substitution to be reduced. The substituted amount is only added to the specific item
  targeted by the substitution to be increased. To illustrate, the maximum impacts from eating balanced food guide meals are modeled by first estimating the reduced amount of consumption of food items such as meat and cereals, and then adding the substituted amount of other food items such as vegetables and fruits. For lifestyle change options not involving substitutions,
  is set as empty and thus
  is zero.
Adoption rates  indicate the level of uptake of lifestyle option k in city j, with values between 0 to 1 representing the extent of the lifestyle changes relative to the baseline consumption patterns. An
  value of 1 (100%) indicates the theoretical maximum uptake, or 'full adoption.' Rj,k
values less than 1 indicate 'partial adoption'; e.g. teleworking only a few times per week. After estimating city-specific maximum impacts associated with the uptake of each lifestyle change option, city-specific partial adoption impacts can be estimated by establishing the city- and option-specific adoption rates.
value of 1 (100%) indicates the theoretical maximum uptake, or 'full adoption.' Rj,k
values less than 1 indicate 'partial adoption'; e.g. teleworking only a few times per week. After estimating city-specific maximum impacts associated with the uptake of each lifestyle change option, city-specific partial adoption impacts can be estimated by establishing the city- and option-specific adoption rates.
With this methodology, the impacts of lifestyle change options can be estimated in multiple cities within a consistent framework. The lifestyle change options analyzed in the case study include the avoidance of some consumption, shifts between consumption items, and the adoption of improved products and services by households. These are limited to options that are currently available and can be adopted by households in urban context of the country. Given that the purpose of this study is to examine the potential of demand-side changes, the analyzed options include end-use technology options, such as electric vehicles and zero energy houses, but exclude supply-side technology options, such as renewable energy and efficiency improvements in the production processes. In the case study, lifestyle change options were identified through a review of the existing literature on the impact of consumer lifestyle changes and an examination of carbon footprint hotspots based on the estimated footprint data. In total, 65 options related to mobility, housing, food, goods, and leisure were identified to cover the most impactful options and major carbon footprint hotspots (table 1). (Data sources, assumptions, and the criteria for the identification of options are given in section 2 (tables S6–S9) in SI 1.) The city-specific full adoption carbon footprint reduction impacts of the identified lifestyle change options were quantified for the selected 52 cities. Embodied rebound effects (Sorrell 2012) (i.e. expected increases in carbon footprint through embedded emissions from the installment of equipment) were considered by partly increasing scenario GHG intensity  or consumption amounts
  by setting negative values for reduction factors
  or
or  in equations (7) and (8).
Table 1. Lifestyle change options in the case study.
| Category | Lifestyle change options | |
|---|---|---|
| Mobility (27) | Vehicle sharing (2)* | Ridesharing, carsharing |
| Vehicle efficiency (7)* | Electric vehicle (charged with renewable or conventional electricity), plug-in hybrid vehicle (charged with renewable or conventional electricity), non-plug-in hybrid vehicle, light vehicle, eco driving | |
| Modal shift (10)** | Modal shift of in-city private trips (bus, train, or bicycle) a , commuting trips (bus, train, or bicycle) a , long distance trips (bus or train) b , domestic flights c , taxi trips d | |
| Demand reduction (3)** | Teleworking, online homecoming visit, less frequent shopping | |
| Compact city (2)** | Living close to workplace, living close to services | |
| Micro leisure (3)** | Local vacation e , domestic vacation f , local weekend g | |
| Housing (15) | Eco house (5)* | Life cycle carbon minus house, zero energy house, nearly zero energy house, renovation for improved insulation, improvement of windows |
| Renewable energy (4)* | Rooftop solar PV (with or without IH cooking heater h ), renewable grid electricity, solar water heater | |
| Housing sufficiency (1)** | Compact house | |
| Appliances (3)* | Water heating by heat pump, temperature control by air conditioner, LED lighting | |
| Energy behavior (2)** | Wearing warm/cool clothes, energy saving by nudging | |
| Food (13) | Dietary shift (6)** | Vegan diet, vegetarian diet, diet with balanced food guide (self-catering, ready-meal, eating-out, or snack/drink) |
| Protein shift (3)** | Alternative meat i , pescatarian diet j , pollotarian diet k | |
| Food loss (2)* | Reduction of food loss (at home or eating out) | |
| Seasonal and local food (2)* | Seasonal food l , local food m | |
| Others (10) | Decarbonized leisure and services (3)** | Community recreation activities n , community eco tourism n , healthy lifestyles o |
| Durability and repair (5)** | Longer use of clothes, hobby products, electronics p , accessories q , and furniture r . | |
| Material sufficiency (2)** | Saving of consumables s , e-books |
No. of options in each domain/group in parenthesis. Lifestyle change options with efficiency strategy in normal text with one asterisk* and ones with sufficiency strategy in italics with two asterisks**. a Shifting from cars to bus, train, or bicycle. b Shifting from cars to bus or train. c Shifting from flight to train. d Shifting from taxi to bus or bicycle. e Shifting from long-distance domestic trips to inner-prefectural vacation trips. f Shifting from overseas trips to domestic vacation trips. g Shifting from medium distance trips to local weekend leisure trips. h Induction heater cooker combined with rooftop solar photovoltaic system. i Plant-based meat. j Shifting from meat to fish. k Shifting from red meat to chicken. l Open-field cultured vegetables. m locally-produced vegetables. n Community-based local weekend leisure or trips. o Reduction of tobacco and alcohol with less medical expenses. p Small electronics excluding large home appliances. q Jewelleries and bags. r Futniture and coverings. s Paper, plastic, stationary, kitchen, and chemical products.
2.3. Quantifying aggregated impacts and exploring carbon footprint reduction pathways
Due to the overlap of some options, the aggregated impact of adopting multiple lifestyle change options is not equal to the sum of the impacts of the individual options. Consequently, the city-specific aggregated impact of a combination of multiple lifestyle change options is quantified with the set of adoption rates for all options as follows:

Here, the aggregated impact of multiple lifestyle change options  in city j is given by comparing the baseline carbon footprints
  in equation (5) and the scenario carbon footprints
  , which are determined by the scenario GHG intensities
  and consumption amounts
  as follows:
The scenario GHG intensities  and consumption amounts
  are given as the infinite product of the subtotal intensity reduction factors
  or amount reduction factors
  for option group g, adding the increased consumption of some items for substitution
  . These infinite products consider the vertical overlap of options that are related to the same item of consumption but can be adopted together, such as the reduced impact of the shift from cars to public transport due to the shorter driving distance resulting from an earlier introduction of teleworking. The subtotal intensity reduction factors
  and amount reduction factors
  are given as follows:
Here, the reduction factors for option group g are calculated as the sum of the reduction factors ( or
or  ) and adoption rates
  for the same group g under the conditions specified in (9) and (10). All lifestyle options are classified into option groups, designated g, in order to consider the horizontal overlap between options that cannot be adopted together, such as electric vehicles and hybrid vehicles. Options that do not have such horizontal overlaps form an individual group with only one member, and thus there is only one term in the summation. The condition specified in (18) refers to the maximum sum of the adoption rates
  in the same group g, not exceeding 100%. The increased consumption amount of an item i due to substitution
  is calculated as the sum of the increased consumption by substitution
  for lifestyle change option k (equation (11)) over all options. That is,
With this methodology, the city-specific carbon footprint reduction pathways through lifestyle changes can be modeled and explored with different sets of adoption rates. In the case study, illustrative pathways for the selected 52 cities were developed assuming unified adoption rates across lifestyle change strategies for each city to determine the level of change required and the potential contribution of lifestyle changes to meet a given decarbonization target. The consumption-based per-capita target  is set as the upper 2030 target corresponding to the 1.5 °C target of the Paris Agreement adopted from an existing study (IGES et al
2019, Koide et al
2019). In addition, scenario analyses with lifestyle changes based on an efficiency strategy (i.e. the introduction of low-carbon technologies or the more efficient use of the same consumption mode) and a sufficiency strategy (i.e. a lessening of the physical or monetary amount of consumption, shifting modes of consumption, or behavioral changes that do not primarily rely on new technologies) were conducted for the 52 cities to examine the implications of different choices of lifestyle change options. While the case study analysis does not consider economy-wide rebound effects and employs a simplified assumption regarding adoption rates in the development of the illustrative scenarios, it provides useful insight into the potential of the methodology. (For a detailed discussion of the methodology and the limitations of the case study, please refer to sections 3 and 4 in SI 1.)
is set as the upper 2030 target corresponding to the 1.5 °C target of the Paris Agreement adopted from an existing study (IGES et al
2019, Koide et al
2019). In addition, scenario analyses with lifestyle changes based on an efficiency strategy (i.e. the introduction of low-carbon technologies or the more efficient use of the same consumption mode) and a sufficiency strategy (i.e. a lessening of the physical or monetary amount of consumption, shifting modes of consumption, or behavioral changes that do not primarily rely on new technologies) were conducted for the 52 cities to examine the implications of different choices of lifestyle change options. While the case study analysis does not consider economy-wide rebound effects and employs a simplified assumption regarding adoption rates in the development of the illustrative scenarios, it provides useful insight into the potential of the methodology. (For a detailed discussion of the methodology and the limitations of the case study, please refer to sections 3 and 4 in SI 1.)
3. Results
3.1. Understanding per-capita carbon footprints in Japanese cities and the gaps with the target
Figure 1 shows the estimated carbon footprints of household consumption in the targeted Japanese cities in the casestudy. The total carbon footprint of household consumption per capita was estimated to be 7310 ± 490 kgCO2e/cap⋅yr (mean ± standard deviation) as of 2015. The estimated mean carbon footprints in the present study are comparable to those in a previous study of household carbon footprints in the country (7510 kgCO2e in 2004) (Koide et al 2019); the slight differences can be explained by the different reference years and data sources for carbon intensity that were used in the studies. The footprints range from 8430 kgCO2e (in 1. Mito city (the number here refers to the rank of the city relative to the baseline footprint as shown in figure 1)) to 5780 kgCO2e (in 52. Naha city), a difference of 2650 kgCO2e. Relatively large variations across cities are observed for mobility, housing, goods, and leisure (e.g. 1430 ± 290 kgCO2e for mobility). Smaller variations are observed for food and services (e.g. 1300 ± 90 kgCO2e in food). The range of the carbon footprints of Japanese cities estimated in the current study (5780–8430 kgCO2e/cap⋅yr in 2015) differs from that in a prior study based on household survey data (3410–5000 kgCO2e/cap⋅yr in 2011) (Jiang et al 2020) due to the proposed adjustment for the underreporting bias in the bottom-up survey data used in the current study.

Figure 1. Estimated per-capita household carbon footprints in 52 Japanese Cities in 2015. Decarbonization target indicated by the red line (3200 kgCO2e/cap⋅yr) is the upper limit of the per-capita carbon footprints of household consumption by 2030 for limiting the global temperature increase to within 1.5 °C.
Download figure:
Standard image High-resolution imageAccording to the result, on average, the carbon footprints need to be reduced at least by 56% to comply with the aspirational target of the Paris Agreement for limiting the global temperature increase to 1.5 °C. The required reduction level varies, ranging from a maximum of 62% (1. Mito city) to a minimum of 45% (52. Naha city). More detailed statistics for the estimated city-level footprints are available in table S11 (SI 1). The hotspots of the carbon footprints for the food, mobility, housing, and 'other' domains are shown in figure S1 for the country average and in figures S3 and S4 for selected cities.
3.2. Comparing city-specific carbon footprint reduction impacts from lifestyle change options
Figure 2 shows the city-specific carbon footprint reduction impacts of the 65 lifestyle options in the case of full adoption (Rj,k = 1). As can be seen here, there is substantial variation among cities, particularly for car-related options in mobility, eco house and renewable energy options in housing, dietary and protein shifts in food, and leisure- and goods-related options. For example, electric vehicles charged by renewable energy have very heterogeneous footprint reduction impacts, ranging from −150 kg to −760 kgCO2e/cap⋅yr (differing by a factor 5.0). Similarly, the impacts of rooftop solar panels with induction heating cookers vary from −1020 kg to −2160 kgCO2e (factor 2.1). In general, the city-by-city estimated carbon footprint reduction impacts from major lifestyle change options in the present study are comparable to estimates reported in a previous country-level study focused on Japan (IGES et al 2019) (e.g. 140–620 kg vs. 520 kgCO2e for electric vehicle, 1300–2100 kg vs. 960 kgCO2e for renewable grid electricity and rooftop solar PV, and 220–420 kg vs. 340 kgCO2e for vegetarian/vegan diet). The relatively small differences can be explained by the use of different data sources and the targeting of different areas.
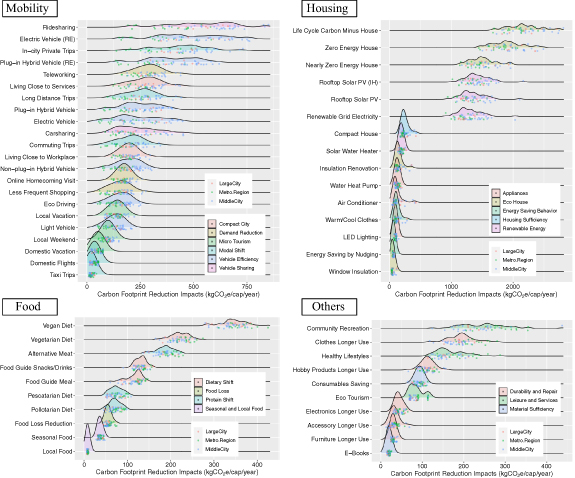
Figure 2. Carbon footprint reduction impacts from lifestyle change options in 52 Japanese cities. Dots represent the footprint reduction impacts of the relevant options in 52 cities, assuming full adoption of the identified lifestyle change. Dot color identifies the city category: cities in a metropolitan region, large cities, and medium cities. Ridgelines represent the density of footprint reduction across the 52 cities. Some similar options were grouped, and the average (modal shift of in-city private, commuting, and long-distance trips) or sum of sub-options (food guide meal and loss) is indicated.
Download figure:
Standard image High-resolution imageSuch city-level variations indicate that the priority of the various lifestyle changes differs among cities. To illustrate, the ranges of impacts from mobility options such as ridesharing (−190 kg to −850 kgCO2e) and teleworking (–160 kg to −440 kgCO2e) overlap with the ranges of goods, leisure, housing, and food-related options, such as longer use of clothes (–120 kg to −280 kgCO2e), community-based recreation (−120 kg to −440 kgCO2e), wearing warm clothes (−70 kg to −280 kgCO2e), and eating meat alternatives (–140 kg to −230 kgCO2e/cap⋅yr). Notably, however, some of the lifestyle change options have consistently higher footprint reduction impacts than others, even considering between-city differences. For example, dietary and protein shifts (at least −280 kgCO2e from a vegan diet, −140 kgCO2e from meat alternatives) are far more impactful than efficient food sourcing and loss reduction (at most −10 kgCO2e by local food, −50 kgCO2e by seasonal food, −80 kgCO2e/cap⋅yr by food loss reduction). Similarly, living in a zero-energy house has a four-digit impact (at least −1450 kgCO2e), which is far larger than energy-saving behavior (at most, −280 kgCO2e by wearing warm/cold clothes, −80 kgCO2e from energy saving by nudging). Many of the more impactful options common among cities (e.g. electric vehicles, shift to public transport, renewable electricity, compact house, vegan and healthy diet) identified in the present study are compatible with the prominent options indicated in a 2020 review (Ivanova et al 2020). Estimated carbon footprint reduction impacts from lifestyle change options in the 52 cities, together with more complete statistics are provided in supplementary information 2 (hereinafter, SI 2) and table S13 (SI 1), respectively.
3.3. Exploring carbon footprint reduction pathways through lifestyle changes in multiple cities
3.3.1. Illustrative Pathways to the Decarbonization Target
Illustrative carbon footprint reduction pathways to meet the consumption-based per-capita target for limiting the global temperature rise to 1.5 °C were developed for the 52 selected Japanese cities (figure 3). According to the results, ambitious urban lifestyle changes can shift carbon footprints to meet the decarbonization target, but the level of change required and the contribution of consumption domains significantly differ by city, with adoption rates for the lifestyle changes needed to meet the target ranging from 62% to 87%. These percentages are close to those found in a previous study at the country level, which concluded that a 65%–75% adoption rate for the various options would be necessary to meet the 2030 target (IGES et al 2019). The required coverage of demand-side options is also comparable to a previous study, which presented scenarios for a 90% reduction of carbon footprints in London (Hersey et al 2009).

Figure 3. Aggregated carbon footprint reduction impacts of illustrative pathways in 52 Japanese cities. The dots indicate the per-capita carbon footprint reduction impacts in each domain in the 52 cities; the ridgelines represent the density of the cities. Dot color indicates the required adoption rate to meet the decarbonization target. The shape of the dots indicates city category: cities in a metropolitan region, large cities, and medium cities. Labels are only shown for cities with the largest and smallest baseline footprints in four consumption domains.
Download figure:
Standard image High-resolution imageThe carbon footprint reduction pathways can be understood using two metrics: reduction of the consumption amount, and reduction in the carbon intensity. Figure 4 illustrates how urban consumers' carbon footprint hotspots are addressed through lifestyle changes in some selected cities (cities with the largest and smallest baseline footprints in each consumption domain). In the illustrative pathways, reductions in both consumption amounts (e.g. energy use, mobility distance, food consumption, and goods and service expenditure) and their intensities are reduced through a variety of urban lifestyle change options. Importantly, the level of reduction in both amount and intensity varies between cities, due to their different adoption of lifestyle change options to address carbon footprint hotspots.
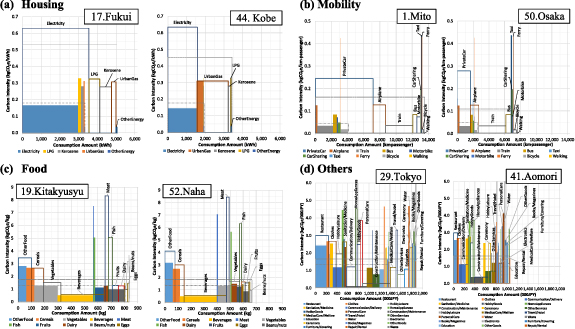
Figure 4. Reduction of carbon footprint hotspots in illustrative pathways (selected cities). The area, width, and height of the rectangles indicate carbon footprint, consumption amount, and carbon intensity, respectively. The unfilled rectangles represent consumption patterns in the baseline, and the color-filled rectangles represent decarbonized scenarios derived in the illustrative carbon footprint reduction pathways. The difference between the unfilled and filled rectangles shows the reduced carbon footprints. In each panel, the city on the left has the largest footprint in the domain; the city on the right has the smallest. The dotted and dash-dot lines represent the total amount of consumption and average intensity in the baseline and decarbonized scenarios, respectively. The number preceding the city name indicates the city's rank based on its carbon footprint, corresponding to figure 1. The cities were ranked in descending order.
Download figure:
Standard image High-resolution imageThe footprint reductions in housing range from −2.2 tCO2e (17. Fukui city) to −1.0 tCO2e/cap⋅yr (52. Naha city). In the illustrative pathways, electrification and the shift to renewable electricity and energy demand reduction including through zero-energy and compact houses with energy saving behavior are assumed. Similarly, the impacts in the mobility footprints range from −2.0 tCO2e (1. Mito city) to −0.70 tCO2e/cap⋅yr (50. Osaka city). Regarding mobility, distance reduction through teleworking, more compact cities, and micro leisure, a shift to public transport and bicycles, and sharing and the electrification of cars are considered.
In food (cooking at home and ready-made meals), the reduced footprints range from −0.50 tCO2e (19. Kitakyushu city) to −0.24 tCO2e/cap⋅yr (52. Naha city). Here, a shift in the amount of consumption to beans and vegetables, a reduction in the GHG intensity of food items through changes in the composition of food and field-cultured, locally-produced vegetables are included. In the category of 'others' (a combination of leisure, goods, and services), the reduced footprints range from −1.2 tCO2e (9. Kawasaki city) to −0.44 tCO2e/cap⋅yr (41. Aomori city). In the pathways, reduction in the consumption of clothes, hobby goods, and consumables through longer use and material savings is considered. These results show that even with the simplified assumption of unified adoption rates per city, the shape of future lifestyles and hotspots significantly varies between cities. Table S12, figures S2, S5 and S6 (SI 1) provide additional details.
3.3.2. Scenario Analysis of Efficiency and Sufficiency Lifestyle Changes
Figure 5 gives the results of the scenario analyses using different combinations of efficiency and sufficiency lifestyle changes in the 52 cities. Importantly, it was found that maximum adoption of either efficiency or sufficiency lifestyle changes alone will not meet the 1.5 °C target. A 100% uptake of all efficiency options (e.g. life cycle carbon minus houses, electric vehicles charged with renewable energy, ridesharing, local and seasonal food with food loss reduction) reduces the total household carbon footprint by −39% to −50%, resulting in per-capita footprints of 3.5 t to 4.2 tCO2e, all of which exceed the target. Similarly, the uptake of all sufficiency options (e.g. telework, micro tourism, a modal shift to bus, train or bicycle, energy saving behavior, vegan diets and healthy lifestyles, longer use of durables, and community-based leisure) reduces footprints by −42% to −47%, resulting in per-capita footprints of 3.4 t to 4.4 tCO2e, which, again, are all above the target.

Figure 5. Carbon footprint reduction impacts by the scenario of efficiency and sufficiency lifestyle changes. Large, medium, and small circles represent the maximum, mean, and minimum aggregated carbon footprint reduction impacts from the respective lifestyle change scenarios among the 52 cities. Levels of adoption from 0% to 100% (five cases) were assumed for efficiency and sufficiency options, resulting in 25 scenarios. In the three sets of numbers below each circle, the left, middle, and right values give the carbon footprint reduction in tCO2e, the reduction percentage relative to the baseline, and the remaining carbon footprint in tCO2e, respectively, for the maximum (top line), mean (middle line), and minimum among the 52 cities (bottom line). Red circles indicate per-capita carbon footprints that exceed the target; green circles indicate footprints within the target. Gray circles indicate that some per-capita carbon footprint statistics (e.g. max or mean) exceed the target while, with the same combination of adoption rates, some cities (e.g. min) are within the target.
Download figure:
Standard image High-resolution image
The scenario analysis indicated that an ambitious uptake of both efficiency and sufficiency lifestyle changes will be needed to decarbonize urban consumption. For example, if a 100% adoption of efficiency lifestyle changes is assumed, including an additional 25%–75% of the sufficiency options will be required in order to reduce the footprints to the targeted level. Similarly, if a 100% uptake of the sufficiency options is assumed, 25%–75% of the efficiency options would be required. More detail is available in figure S7 (SI 1).
4. Discussion
The case study presented in this paper revealed the characteristics of necessary urban lifestyle changes to meet the 1.5 °C target and applicability of the methodology proposed in this study. The analysis of city-specific carbon footprints suggested that ambitious footprint reduction will be required, though at different levels in different cities. The variation in the estimated carbon footprint of Japanese cities is unignorable—up to 2.7 tCO2e/cap⋅yr in some cases. The city-specific reductions required to comply with the 1.5 °C target (i.e. 45%–62% reduction) and the variation by consumption domain (e.g. large variations in mobility, housing, goods, and leisure) imply that solutions tailored to individual cities are essential.
The city-specific carbon footprint reduction potential quantified here suggests both differing priorities and common challenges among cities. For many of the lifestyle change options, city-specific impacts differ by as much as a factor of two to five, and the effective solutions can differ across cities. For example, whether ridesharing and teleworking have a greater impact than longer use of clothes and eating meat alternatives depends on the city. This heterogeneity suggests that the promotion of lifestyle changes requires city-specific prioritization that considers local consumer lifestyles. On the other hand, the relative impact of some of the lifestyle changes was consistent across all cities. For example, dietary and protein shifts had a greater impact than food loss reduction and local/seasonal food. This suggests that prioritizing effective lifestyle changes with large mitigation potential is a common challenge for all cities, as indicated in previous studies at the country level (Wynes and Nicholas 2017, IGES et al 2019).
The analysis of carbon footprint reduction pathways shows that ambitious lifestyle changes can potentially reduce the carbon footprints of urban consumers to meet the 1.5 °C target. However, the level and coverage of the required lifestyle changes were substantial for all cities (i.e. 62%–87% adoption). The contributions from the different consumption domains also differed significantly by city. For example, some cities could expect as much as a 2 tCO2e/cap⋅yr reduction in mobility (Mito city) or housing (Fukui city), while others may expect as much as a 1 tCO2e reduction in goods, leisure, and services (Kawasaki city) or a 0.5 tCO2e reduction in food (Kitakyushu city). The target could only be achieved by adopting a combination of both sufficiency and efficiency options (e.g. 100% of one approach, combined with 25%–75% of the other). This implies the necessity of merging the two strategies by innovative provision systems tailored to each city, such as shared transport systems combined with walkable inner-city amenities, zero-energy houses with energy saving nudging, and healthy diets sourced from seasonal ingredients.
Accordingly, cities should differentially prioritize lifestyle changes considering the local context, referring to the city-specific carbon footprint reduction impacts (estimated results of 52 cities included in SI 2). City-specific consumption-based mitigation pathways can be explored by the approach proposed in this study by reflecting different lifestyle change strategies as adoption rates, as illustrated in the scenario with efficiency and sufficiency strategies. It can be combined with a participatory approach, such as workshops or surveys with stakeholders and citizens as illustrated in other studies (Dubois et al 2019, Vita et al 2019). Reflecting the city-specific priorities, city governments can formulate and implement policies that focus on high-priority options, such as transit-oriented urban planning, subsidies for efficient houses and renewable energy, and campaigns promoting healthy diets, and facilitate actions by other stakeholders, such as retailers and service providers, to increase the availability of low-carbon options to citizens.
5. Conclusions
This paper proposed a practical methodology for modeling and exploring carbon footprint reduction pathways through urban lifestyle changes to meet the 1.5 °C target in multiple cities. The case study presented in this paper suggests the usefulness of the proposed approach and necessity for cities to explore and identify unique consumption-based mitigation pathways and priority lifestyle change options, even while aiming at the same per-capita target. Although the case study was on 52 Japanese cities with 65 lifestyle change options, the proposed methodology is applicable to other countries with increasingly available subnational household consumption data and GHG intensity databases from input–output models. Application of this methodology to city-level lifestyle changes in other countries and to incorporating a participatory approach can be suitable topics for future research.
It should be noted that the decarbonization target used in the case study is the upper target for 2030. Thus, the footprint reduction discussed here should be considered a minimum bound; further reduction towards net-zero emissions, such as the 2050 target and early actions by 2030, will be necessary. Although this study focuses on lifestyle change options that can be adopted by households, to achieve the broader adoption of sustainable options will require support and facilitation by service providers, retailers, manufactures, governments, and other stakeholders. Furthermore, supply-side technology such as renewable energy in supply chains and provision of additional decarbonized options not currently available to households can reduce the required adoption rates and increase the number of citizens who accept the necessary lifestyle changes. For this to occur, more consumers and stakeholders will need to demand supply-side solutions. In addition to urgently implementing tailored policies to enable decarbonized provision systems and lifestyle changes, there is a need for cities to provide opportunities for citizens and other stakeholders to understand holistically their lifestyle-related carbon footprint and to appreciate the level and types of changes that will be required to meet the decarbonization target.
Acknowledgments
This research was supported in part by the Environment Research and Technology Development Fund (JPMEERF16S11600) of the Environmental Restoration and Conservation Agency, Grants-in-Aid for Scientific Research (JP21K12374) of Japan Society for the Promotion of Science, and the United Nations' 10-Year Framework of Programmes on Sustainable Consumption and Production (10YFP).
Data availability statement
The data that support the findings of this study are available upon reasonable request from the authors.
Conflict of interest
The authors declare no conflicts of interest associated with this manuscript.