

Abstract
We quantify the impact of nutrient (nitrogen and phosphorus) limitation on land carbon uptake and the sensitivity of this uptake to atmospheric carbon dioxide (CO2) concentrations (land carbon-concentration feedback) and surface air temperature (land-carbon climate feedback). We analyse simulations of the Australian Earth System Model (ACCESS-ESM1.5) with a prescribed 1% yr−1 CO2 increase in three different configurations: (1) without nutrient limitation, (2) with nitrogen limitation only and (3) with nitrogen and phosphorus limitation combined. Our results suggest a reduction in land carbon uptake and feedback strength of about 30% by including nitrogen limitation only. This reduction agrees well with the ensemble mean of models with and without nitrogen limitation from the sixth Coupled Model Intercomparison Project (CMIP6). By adding phosphorus limitation to our model, the response is even stronger with a further 50% reduction for the carbon-concentration feedback and a further 75% reduction for the carbon-climate feedback. We find that the feedback strength in all three nutrient configurations is mostly determined by vegetation productivity (i.e. Net Primary Production) with little contribution from soil heterotrophic respiration. Our simulations show that nutrient limitation has the largest impact in the northern mid latitudes (around 50∘), reducing land carbon uptake by about 50% when accounting for nitrogen and phosphorus limitation combined. The strong response of land carbon uptake and feedback strength to nutrients in our model simulations underlines the importance of including both nitrogen and phosphorus limitation in other Earth System Models in order to derive better estimates of future land carbon uptake and to assess the effectiveness of land-based carbon mitigation.
Export citation and abstract BibTeX RIS

Original content from this work may be used under the terms of the Creative Commons Attribution 4.0 license. Any further distribution of this work must maintain attribution to the author(s) and the title of the work, journal citation and DOI.
1. Introduction
Our future climate will depend on future emissions of greenhouse gases such as CO2. However, the physical climate also depends on the global carbon cycle and how they interact with each other. Changes in the physical climate affect the uptake of CO2 by the land and the ocean leading to changes in atmospheric CO2 concentrations which in turn affect the physical climate. For example, an increase in temperature leads to an increase in soil heterotrophic respiration, reducing the land carbon uptake. Therefore, more CO2 remains in the atmosphere which increases temperature even further. The sensitivity of the land carbon cycle to changes in atmospheric CO2 concentrations and the physical climate can be characterised in terms of the carbon-concentration and carbon-climate feedback (Friedlingstein et al 2006, Boer and Arora 2009, Arora et al 2013).
Feedback analysis with earth system models (ESMs) has shown that the carbon-concentration feedback (βL ) is positive from the land perspective at the global scale, meaning that an increase in CO2 leads to an increase in carbon uptake by the land. On the other hand, the carbon-climate feedback (γL ) is thought to be negative at the global scale, because an increase in temperature generally decreases the capacity of the land to take up carbon. The quantification of the carbon-climate feedback assumes that changes in the physical climate can be expressed in terms of changes in the near-surface air temperature (Arora et al 2013).
Land carbon uptake and storage is not only dependent on environmental factors but is also controlled by the availability of nutrients such as nitrogen (N) and phosphorus (P), because they are able to constrain plant growth and photosynthesis (Vitousek and Howarth 1991, Vitousek et al 2010, Fleischer et al 2019). For example, a nutrient limitation can be diagnosed when additional N and/or P leads to an increase in plant growth. Due to the importance of nutrients, ESMs have begun to implement N limitation in land carbon cycle processes (Sokolov et al 2008, Thornton et al 2009). Nonetheless, only two ESMs used in the fifth Coupled Model Intercomparison Project (CMIP5) include N limitation and none include P limitation. Arora et al (2013) showed that the two N limited models in CMIP5 generally have a weaker carbon-concentration and carbon-climate feedback as compared to the models without N limitation.
In the most recent Coupled Model Intercomparison Project, CMIP6, the number of ESMs with N limitation has increased (i.e. six ESMs with N limitation as analysed in Arora et al 2020) and results demonstrate that as with CMIP5 the models that include a representation of the N cycle show a smaller feedback strength. However, the range of the feedbacks for both N limited and not N limited models in CMIP6 has also increased in comparison to CMIP5, although the range for the N limited models is generally smaller than the range for models that are not N limited. This demonstrates that large uncertainties remain in the quantification of the feedback strength and the impact of nutrients on land carbon uptake (Zhang et al 2014, Wieder et al 2015, Davies-Barnard et al 2020). Reducing these uncertainties is critically important for providing better estimates of future land carbon uptake and for developing suitable climate mitigation policies.
Although N limitation is now implemented in a number of ESMs, P limitation remains uncommon. In fact, there is only one ESM in CMIP6 that uses global N and P limitation (Wang et al 2010) in its standard configuration, which is the ESM version of the Australian Community Climate and Earth System Simulator (ACCESS), ACCESS-ESM1.5 (Ziehn et al 2020). ACCESS-ESM1.5 is a fully coupled ESM with components for atmosphere, land, ocean and sea-ice, including biogeochemical (i.e. carbon and nutrient cycle) modules for land and ocean. Here, we use ACCESS-ESM1.5 to analyse the impact of both N and P limitation on the land carbon uptake and consequently on the land carbon-concentration and land carbon-climate feedbacks. We aim to answer the following key questions:
- (a)By how much does nutrient limitation reduce the land carbon uptake, and the carbon-concentration and carbon-climate feedback strengths?
- (b)What are the relative roles of nitrogen limitation and phosphorus limitation to these reductions?
- (c)Do the effects of nitrogen and phosphorus limitations on carbon-concentration and carbon-climate feedbacks vary latitudinally?
- (d)How does nutrient limitation affect vegetation productivity and soil heterotrophic respiration and how does this impact both feedbacks?
2. Methods
2.1. Nutrient limitation in ACCESS-ESM1.5
In ACCESS-ESM1.5 (hereafter referred to as ACCESS) nutrient limitation influences photosynthesis and plant growth through a number of processes. For example, photosynthesis is a function of the maximum leaf carboxylation rate, which increases with leaf N concentrations and leaf P:N ratio. Maintenance respiration rate of a plant pool is proportional to the amount of N in that pool, while growth respiration increases non-linearly with leaf P:N ratio. Further, soil heterotrophic respiration is dependent on N and P states in litter and soil. The availability of nutrients to plants in our model is also dependent on temperature. For example, an increase in soil temperature leads to an increase in the decomposition of organic matter and therefore more nutrients become available for plant uptake. A detailed description of how N and P limitation is implemented in the land surface model component of ACCESS is provided in Zhang et al (2013).
An evaluation of nutrient limitation for the land surface model used in ACCESS is provided in Zhang et al (2014). The authors found that the simulated land carbon uptake over the historical period (1860–2005) and global canopy leaf area index (from 1981 to 2005) including both N and P limitation agreed better with the estimate by the global carbon project or remote sensing than without accounting for N or P limitation.
2.2. Feedback analysis
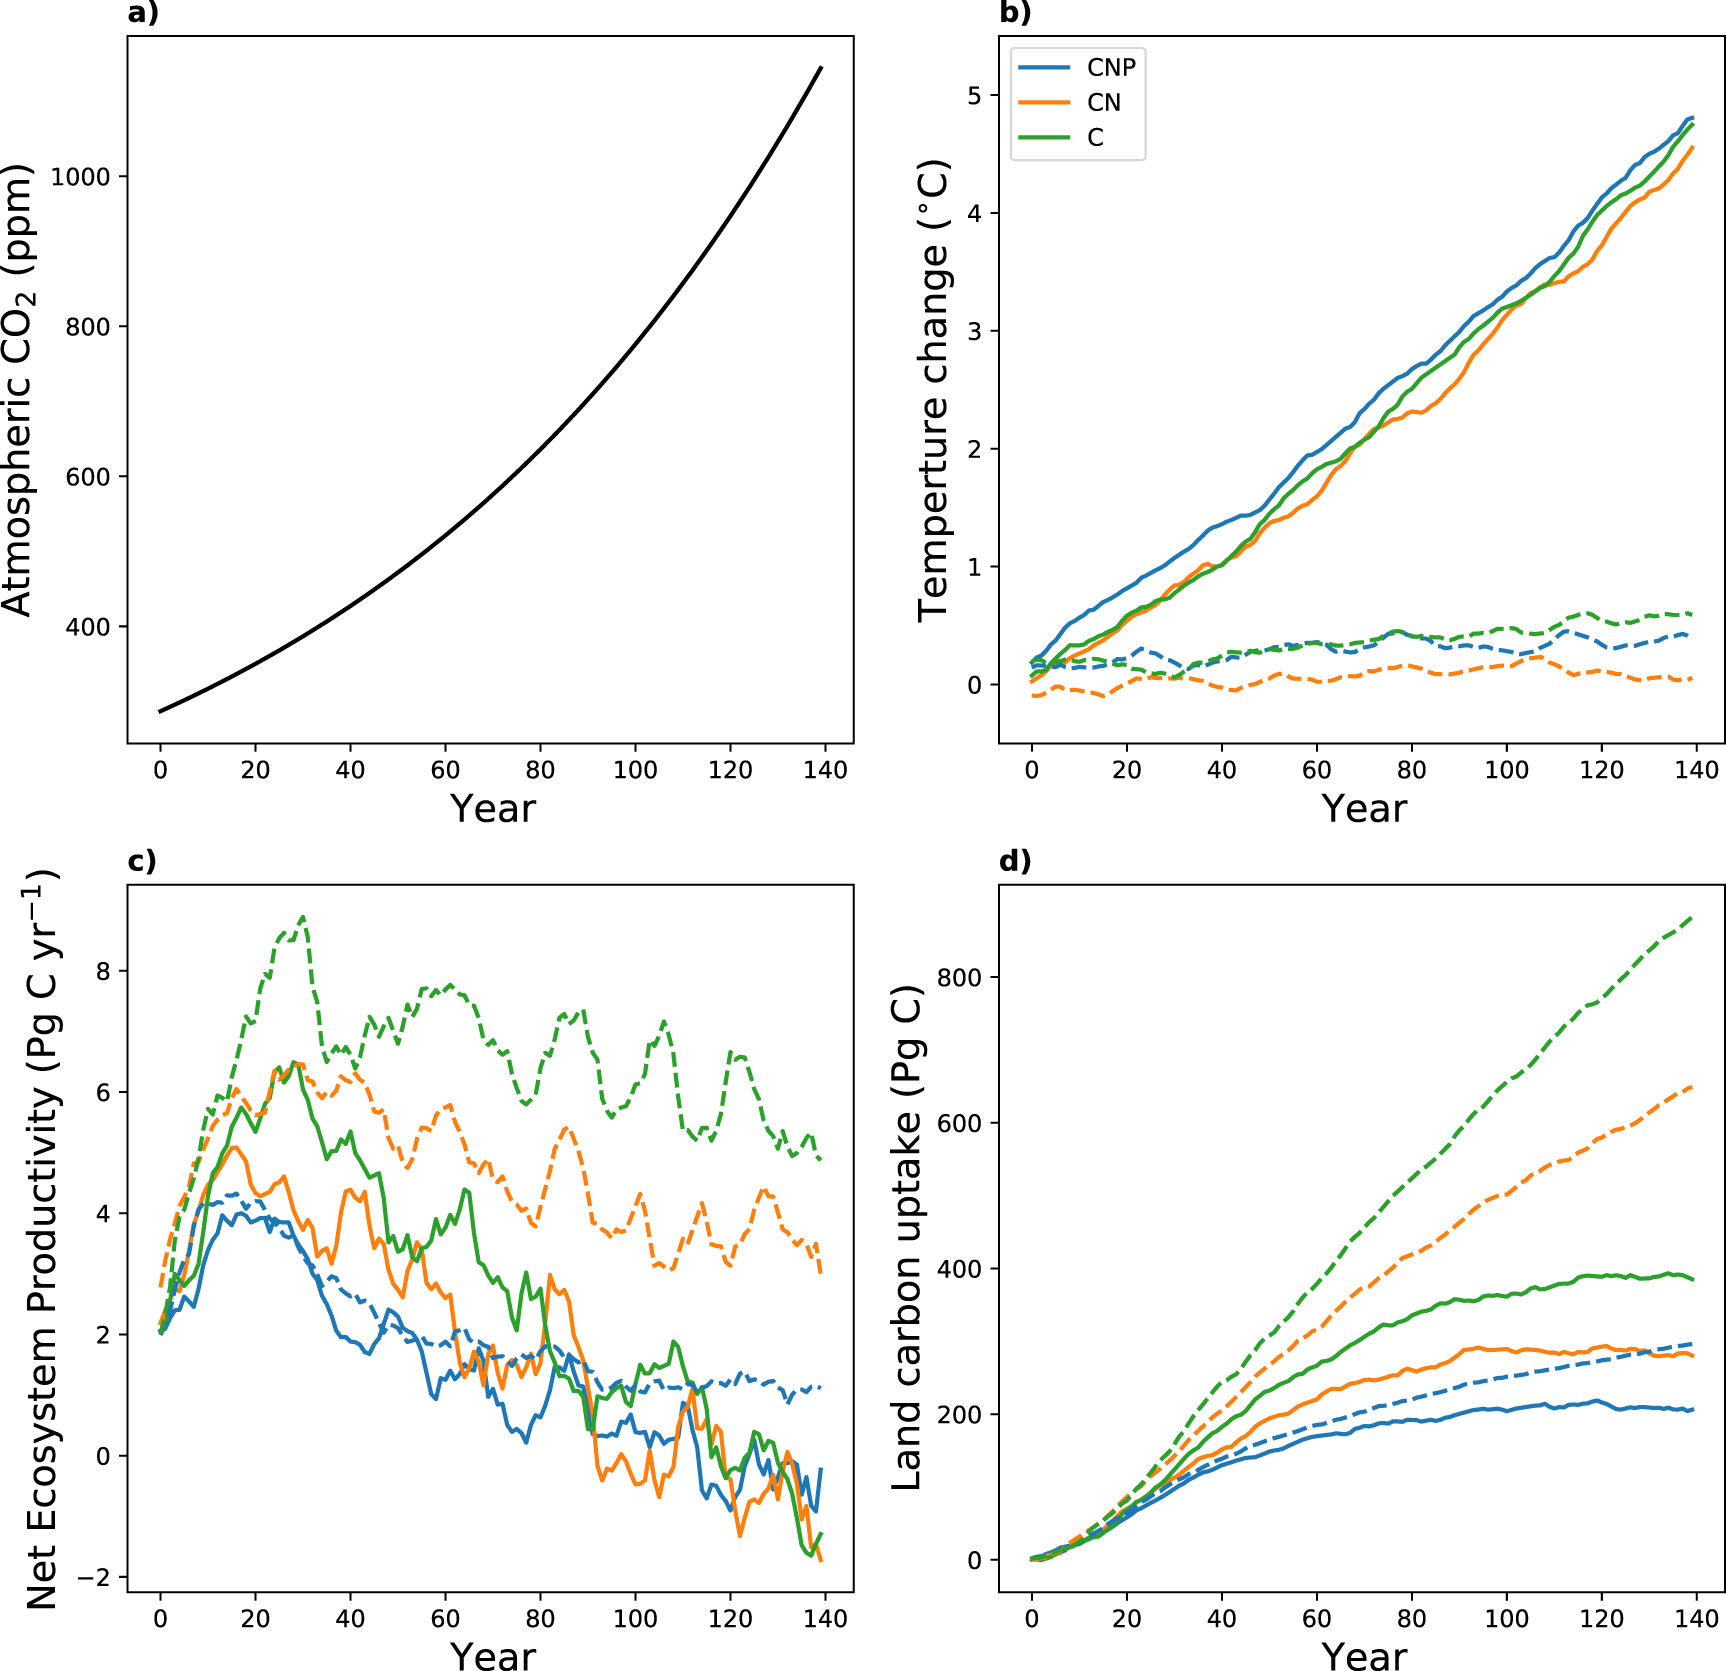
The feedbacks are derived from standardised '1pctCO2' experiments as part of the CMIP6 DECK (Diagnostic, Evaluation and Characterization of Klima) (Eyring et al 2016) and the Coupled Climate-Carbon Cycle Model Intercomparison Project (C4MIP) (Jones et al 2016), where prescribed atmospheric CO2 concentrations are increased by 1% per year from pre-industrial levels (corresponding to year 1850) over a 140 year period (figure 1(a)). Simulations are performed with a static land cover map representing 1850 conditions and therefore do not consider any land use and land cover change.
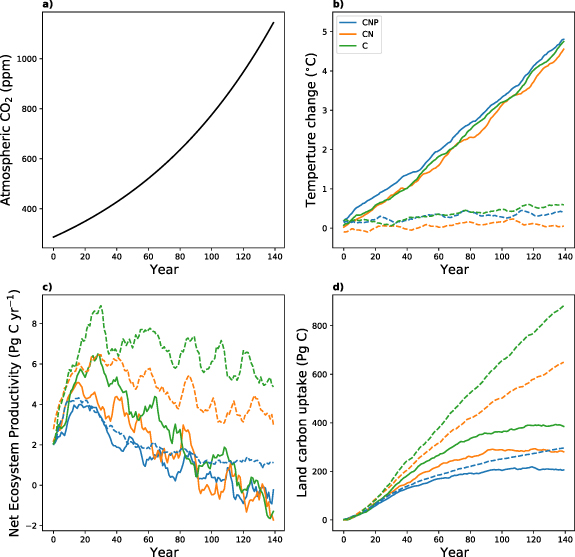
Figure 1. Change in (a) prescribed atmospheric CO2 concentrations, (b) global mean near-surface temperature (10-yr running mean), (c) Net Ecosystem Productivity (NEP; flux into the land, 10-yr running mean) and (d) land carbon uptake for the three configurations C (green), CN (orange) and CNP (blue). Results for the fully coupled runs (COU) are shown in solid lines and results for the biogeochemically coupled runs (BGC) are shown in dashed lines.
Download figure:
Standard image High-resolution imageOur feedback analysis is largely based on the framework used in Friedlingstein et al (2006) and Arora et al (2020) with the land carbon uptake defined as:

where Δc is the change in atmospheric CO2 concentrations, ΔCL stands for the land carbon uptake (or change in global carbon stocks) and ΔT for the changes in near-surface temperature. The feedback parameters, βL and γL , can be calculated using the results from any two combinations of fully coupled (COU), biogeochemically coupled (BGC) and radiatively coupled (RAD) simulations. In the BGC simulation only the biogeochemical processes for land and ocean respond to the increase in CO2, whereas in the RAD simulation only the radiative transfer calculations are impacted by the CO2 increase. The COU simulation combines both of these effects.
Under the assumption of a linear system all combinations would results in the same values for βL and γL . However, in practice this is not the case due to non-linearities in the models. On the land, this non-linearity can be associated with the different response of vegetation productivity and soil heterotrophic respiration to an increase in temperature in the presence or absence of increasing CO2 (Zickfeld et al 2011). The non-linear interactions in ACCESS and other CMIP6 models will be further investigated in a separate study.
Here we use the COU and BGC simulations to calculate the feedback parameters by successively solving equation (1) for βL and γL :


We consider three different configurations of ACCESS to quantify the impact of nutrient limitation on the feedbacks: (1) no nutrient limitation referred to as C, (2) nitrogen limitation referred to as CN and (3) nitrogen and phosphorus limitation referred to as CNP. Therefore, our analysis is based on three sets of simulations (COU-C and BGC-C, COU-CN and BGC-CN, COU-CNP and BGC-CNP). We also compare our results for land carbon uptake and the feedbacks for the C and CN configuration against the CMIP6 model mean as presented in Arora et al (2020). The feedback analysis in Arora et al (2020) is based on results from five ESM's using a C configuration and five ESM's using a CN configuration. ACCESS results are also included in this analysis, however only in the CNP configuration, which is our standard configuration.
2.3. Surrogate model
In order to provide a more detailed analysis of the modelled response of βL and γL for the three different ACCESS configurations we propose a simple model surrogate driven by net primary production (NPP) from the ACCESS simulations. The land carbon uptake (ΔCL ) can be expressed as the sum of changes in carbon stocks over a specified period of time or as the integrated net ecosystem productivity (NEP), which is also defined as the difference of integrated NPP and integrated soil heterotrophic respiration (Rh ):
To derive the model surrogate we rewrite the total land carbon uptake ΔCL in equation (4) as the sum of the changes in three carbon pools (a vegetation biomass pool Cv , a fast soil Cfs and a slow soil pool Css ):

Formulating this as a balance equation for each carbon pool leads to a total of eight parameters that can be optimised by minimising the mismatch between the surrogate carbon pools and the simulated ACCESS carbon pools. The eight parameters represent fractions of carbon allocated to the pools, rate constants and temperature coefficients and from these Rh can be derived for all three configurations.
A more detailed description including all surrogate model equations can be found in the supplementary material (available online at stacks.iop.org/ERL/16/074043/mmedia). Assuming a reasonable fit of the model surrogate, the calculation of βL and γL using the carbon pool changes based on the model surrogate should be close to those calculated from ACCESS.
The model surrogate then allows us to quantify how nutrient limitation affects vegetation productivity and carbon loss from soil heterotrophic respiration (as a function of the eight surrogate parameters) and how this relationship impacts the feedback parameters βL and γL . This type of analysis is not possible based on the ACCESS results alone, because in ACCESS we cannot easily apply nutrient limitation to only one specific process. With the surrogate we can, for example, separate NPP and Rh and analyse possible combinations of NPP (in C, CN or CNP configuration) with Rh (in C, CN or CNP configuration).
3. Results
3.1. Land carbon uptake and feedbacks
3.1.1. Global scale
The change in prescribed atmospheric CO2 concentrations and the corresponding change in global mean surface temperature for ACCESS are shown in figures 1(a) and (b). The temperature change in the COU simulation over the 140 years is about 4.5∘C for all configurations. For the BGC simulation the temperature change varies between 0.15 ∘C and 0.39 ∘C. The small increase in temperature for the BGC simulations can be attributed to changes in latent and sensible heat fluxes at the land surface due to changes in vegetation structure, coverage and composition. ACCESS does not have a dynamic vegetation model, but uses a prognostic leaf area index and climatic changes are therefore mainly due to increased radiation and reduced stomatal conductance in response to increasing atmospheric CO2 (Law et al 2017, Ziehn et al 2017).
Annual NEP and land carbon uptake are presented in figures 1(c) and (d). NEP is a relatively small flux, representing the difference of two large fluxes NPP and Rh . Depending on which of the larger fluxes dominates, NEP is either positive or negative. Variations in the climate lead to a large interannual variability in NEP, whereas the trend in NEP is determined by a change in the climate. For the COU simulations, we see an initial increase in NEP mainly due to an increase in NPP in response to the increase in CO2 concentrations (also known as CO2 fertilisation effect). Nutrients limit the increase in NPP in the CN and CNP configuration and we therefore see the largest increase in NEP for the C configuration. The increase in temperature also leads to a relative increase in Rh . However, this effect is delayed due to large carbon pool turnover times. We therefore see a peak in NEP between years 20 and 30 and then a strong decline for all three configurations. The NEP response for the BGC simulations is similar to the COU simulations at the beginning due to the increase in CO2 and consequently in NPP. In contrast, temperature does not increase significantly in the BGC simulations, which means that there is no temperature related increase in Rh . Therefore, NEP and land carbon uptake are larger for the BGC simulation for all three configurations compared to the COU simulations. In the COU simulation the land becomes a carbon source for all configurations after about 120 years mainly due to the relative increase in Rh . In the CNP configuration the differences in carbon uptake between COU and BGC are significantly smaller than in the C and CN configuration, which suggests that in the CNP configuration the temperature increase has an overall smaller (negative) impact on the land carbon uptake.
Table 1 also lists the global land carbon uptake over the 140 years including a comparison with the CMIP6 mean for models in C and CN configuration. In the COU-C simulation the land carbon uptake in ACCESS is 393 Pg C and 882 Pg C in the BGC-C simulation. This again suggests a large (negative) temperature feedback in ACCESS, which will be discussed later. When adding nitrogen limitation (CN configuration), we observe a reduction in land carbon uptake in ACCESS of about 30% in comparison to the C simulations in both, COU-CN (280 Pg C) and BGC-CN (645 Pg C).
Table 1. Land carbon uptake (Pg C) in COU and BGC for C, CN, CNP configuration. CMIP6 values expressed as mean ± 1 standard deviation are based on five models in C and five models in CN configuration. Numbers in brackets indicate the reduction in land carbon uptake with reference to the C and CN configuration respectively.
| ACCESS-ESM1.5 | CMIP6 mean | |||
|---|---|---|---|---|
| Configuration | COU | BGC | COU | BGC |
| C | 393 | 882 | 754 ± 268 | 1012 ± 335 |
| CN | 280 (−29%) | 645 (−27%) | 601 ± 103 (−20%) | 738 ± 120 (−27%) |
| CNP | 213 (−24%) | 306 (−53%) | — | — |
In the CNP configuration the carbon uptake in ACCESS is further reduced to 213 Pg C in COU and 306 Pg C in BGC. Whereas in COU the addition of P leads to a smaller but overall similar reduction in carbon uptake as the addition of N (about 25%), in the BGC simulation the reduction in carbon uptake is even more pronounced (about 50%) when adding P limitation. This is because when adding P limitation the carbon uptake is reduced over the whole latitudinal range, whereas when adding N limitation the carbon uptake is only reduced in the extra tropics, most strongly pronounced around 60∘ N. In the COU simulation reduction in carbon uptake due to N and P limitation occurs in the same latitudinal band, mainly around 60∘ N. Latitudinal differences will be further analysed in the next section.
The land carbon-concentration (βL ) and carbon-climate (γL ) feedbacks are shown in table 2. In the C configuration we calculate βL as about 1.1 Pg C ppm−1 and γL as about −123 Pg C ∘C−1. We observe a reduction of about 30% in the feedback strength for βL in the CN configuration (0.8 Pg C ppm−1) in comparison to the C configuration. For γL we also notice a reduction of 30%. When adding P limitation (CNP configuration), both feedbacks in ACCESS are reduced further to about 0.4 Pg C ppm−1 for βL and −22 Pg C ∘C−1 for γL . This corresponds to a reduction of more than 50% and more than 70% respectively in comparison to the CN configuration.
Table 2. Carbon-concentration (βL Pg C ppm−1) and carbon-climate feedback (γL Pg C ∘C−1) in COU and BGC for C, CN, CNP configuration. CMIP6 values expressed as mean ± 1 standard deviation are based on five models in C and five models in CN configuration. Numbers in brackets indicate the reduction in the feedbacks with reference to the C and CN configuration respectively.
| ACCESS-ESM1.5 | CMIP6 | |||
|---|---|---|---|---|
| Configuration | βL | γL | βL | γL |
| C | 1.11 | −122.77 | 1.20 ± 0.4 | −63.80 ± 63.1 |
| CN | 0.77 (−31%) | −85.40 (−30%) | 0.86 ± 0.14 (−28%) | −31.14 ± 21.9 (−51%) |
| CNP | 0.37 (−52%) | −22.34 (−74%) | — | — |
Overall, nutrient limitation (N and P together) in ACCESS reduces the global land carbon uptake by almost 50% (COU simulation), whereas the CO2 sensitivity (feedback βL ) and surface air temperature sensitivity (feedback γL ) are reduced by about 65% and 80% respectively.
3.1.2. Latitudinal scale
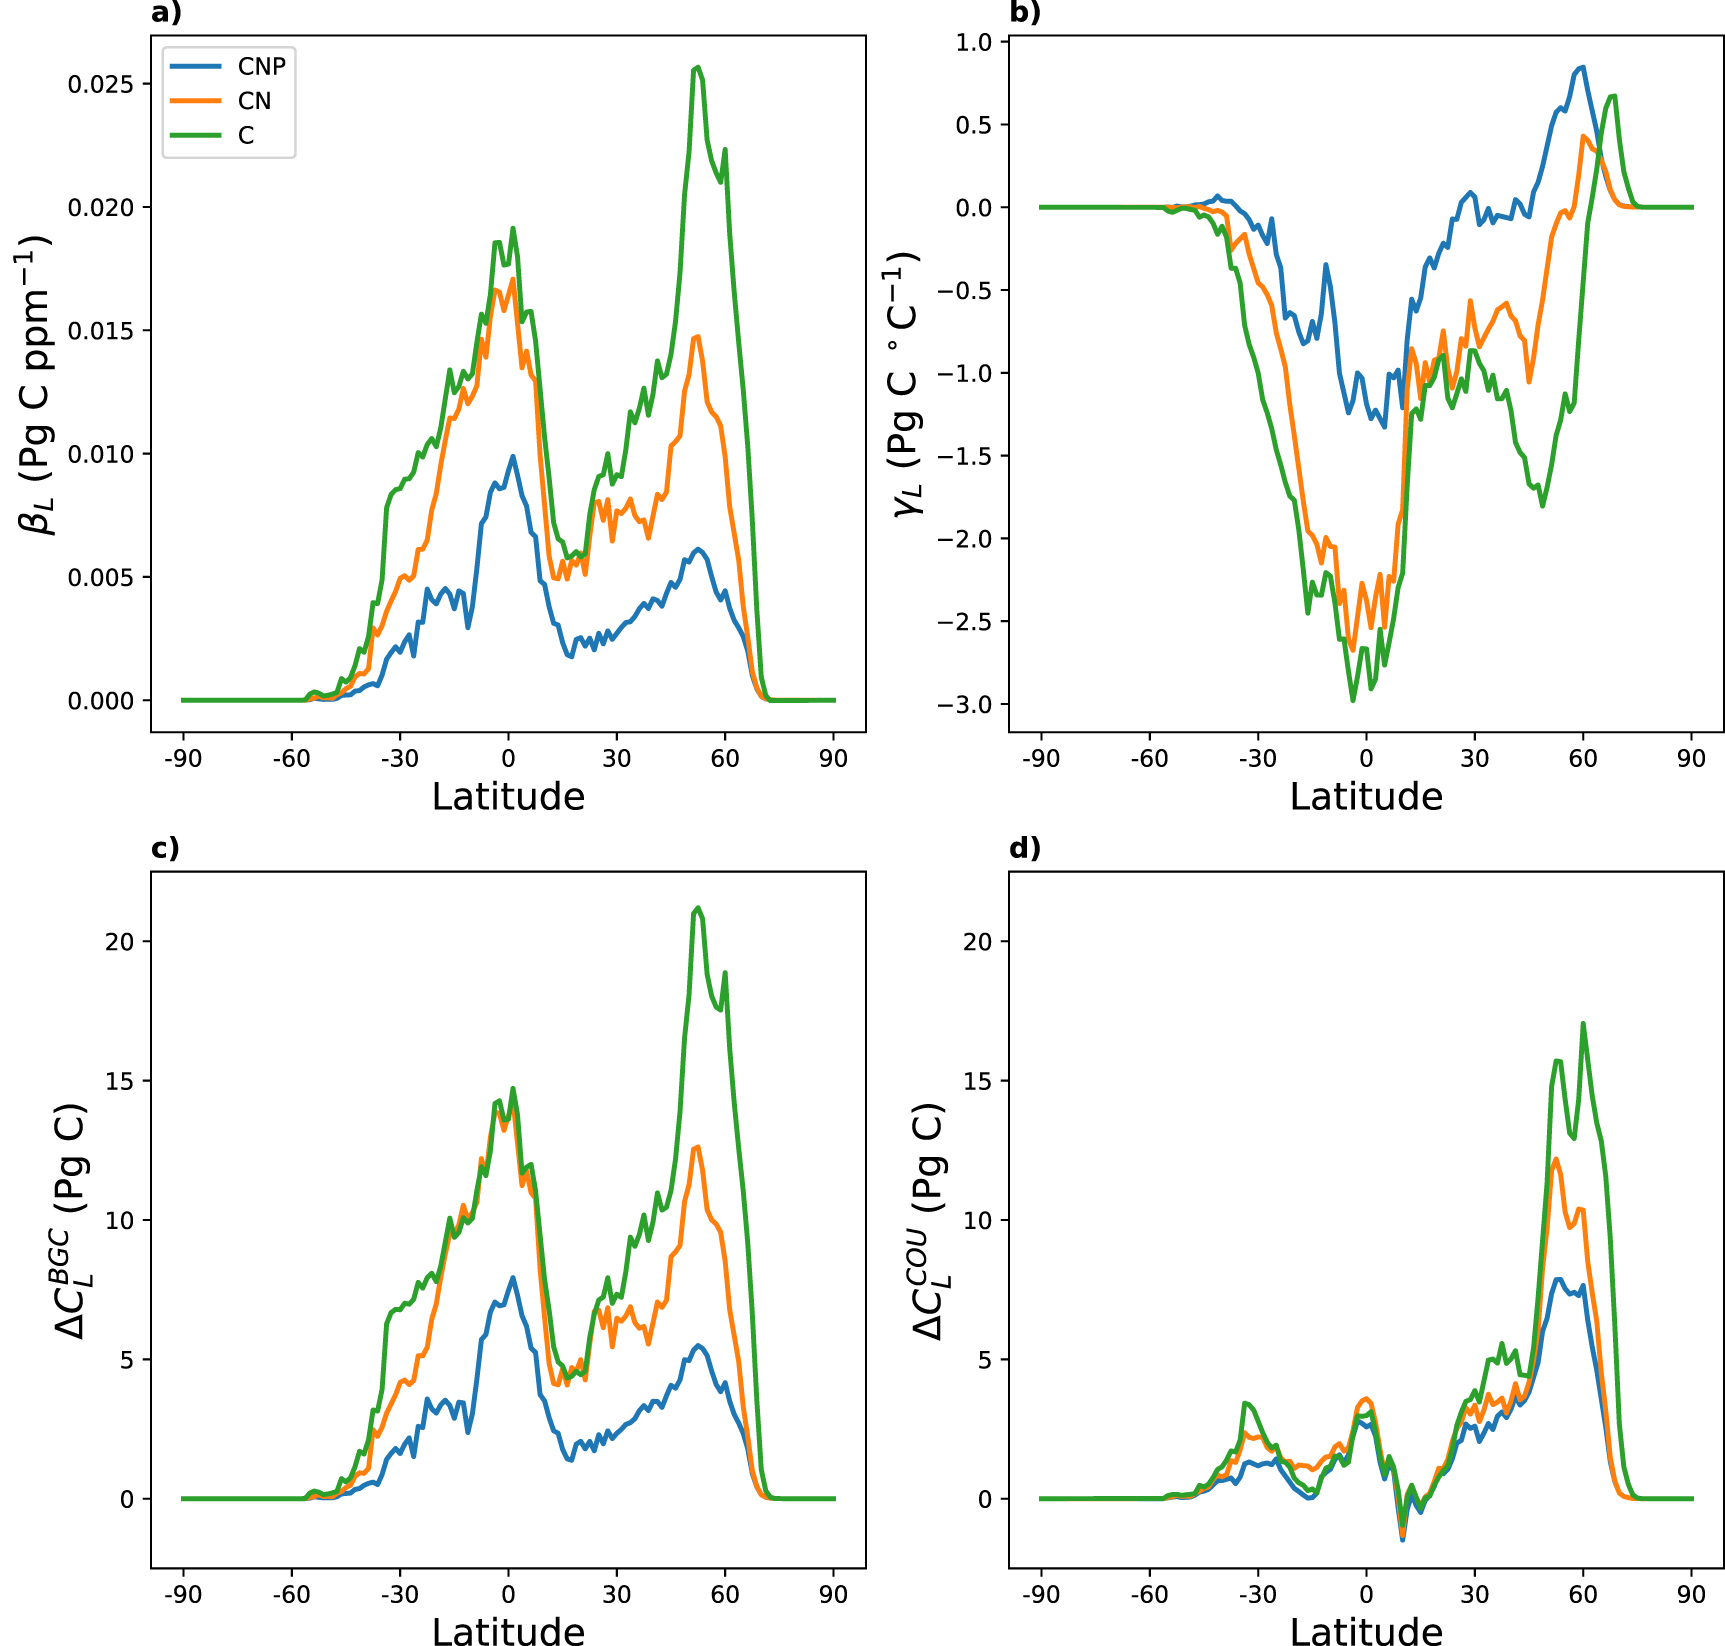
The latitudinal distribution of βL
is shown in figure 2(a). In the C configuration the carbon-concentration feedback is largest in the mid-northern latitudes (around 50∘ N), which also corresponds with the region of the largest land carbon uptake in both BGC and COU (figures 2(c) and (d) respectively). In fact, the latitudinal distribution of the land carbon uptake in COU is strongly correlated with βL
for all three configuration. This is because the calculation of βL
(equation (2)) mainly depends on the change in the land carbon pools for BGC if the temperature change in BGC is small (which it is in all three cases), scaled by the change in atmospheric CO2 concentrations, which is the same in all three configurations. For the CN configuration βL
and  show only small changes in the tropics in comparison to the C configuration, which indicates that tropical regions are not N limited in our model. In contrast, the difference between the C and CN configuration in the mid to high northern latitudes (30–70∘ N) for βL
and
show only small changes in the tropics in comparison to the C configuration, which indicates that tropical regions are not N limited in our model. In contrast, the difference between the C and CN configuration in the mid to high northern latitudes (30–70∘ N) for βL
and  is significant and N limitation obviously has a large impact here. The addition of P (CNP configuration) on the other hand seems to have a noticeable impact across all latitudes in ACCESS, however the reduction in βL
and
is significant and N limitation obviously has a large impact here. The addition of P (CNP configuration) on the other hand seems to have a noticeable impact across all latitudes in ACCESS, however the reduction in βL
and  in comparison to the CN configuration is largest in the tropics and the mid-northern latitudes.
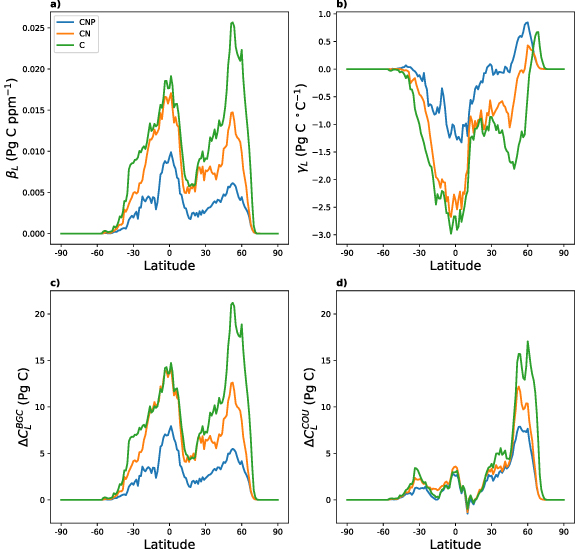
Figure 2. Latitudinal distribution of (a) the carbon-concentration (βL ) and (b) carbon-climate (γL ) feedbacks as well as the change in total land carbon stocks (over 140 years) for (c) the biogeochemically coupled runs (BGC) and (d) the fully coupled runs (COU) for C (green), CN (orange) and CNP (blue).
Download figure:
Standard image High-resolution imageThe carbon-climate feedback is mainly determined by the difference between  and
and  (see equation(3)) and scaled by the change in temperature in the COU simulation (again, assuming the temperature change in the BGC simulation is small). Therefore, if the carbon uptake in the COU simulation is smaller than in the BGC simulation γL
is negative, which is the case for all configurations for ACCESS at the global scale (see table 2). However, at the latitudinal scale (figure 2(b)) we can identify latitudinal bands with a positive γL
. For the C configuration these are the latitudes above 60∘ N and for the CN configurations the latitudes around 60∘ N. As with βL
the differences between the CN and C configurations are small for the tropics, but larger for the extra-tropics. The negative feedback is stronger for C in comparison to CN for latitudes between 30 and 60∘ N. This might be due to the fact that in the CN configuration more N becomes available for plants when temperature increases which in turn decreases the difference between
(see equation(3)) and scaled by the change in temperature in the COU simulation (again, assuming the temperature change in the BGC simulation is small). Therefore, if the carbon uptake in the COU simulation is smaller than in the BGC simulation γL
is negative, which is the case for all configurations for ACCESS at the global scale (see table 2). However, at the latitudinal scale (figure 2(b)) we can identify latitudinal bands with a positive γL
. For the C configuration these are the latitudes above 60∘ N and for the CN configurations the latitudes around 60∘ N. As with βL
the differences between the CN and C configurations are small for the tropics, but larger for the extra-tropics. The negative feedback is stronger for C in comparison to CN for latitudes between 30 and 60∘ N. This might be due to the fact that in the CN configuration more N becomes available for plants when temperature increases which in turn decreases the difference between  and
and  . In the latitudes above 60∘ N this even leads to a positive γL
with the carbon uptake in COU larger than in BGC due to the positive effect of temperature on productivity and nitrogen availability. In the CNP configuration γL
is smaller almost everywhere when compared with γL
from the CN configuration. The largest reduction in γL
can be observed in the tropics due to the large reduction in carbon uptake in BGC. Further north (above 20∘ N) γL
becomes slightly positive in the CNP configuration with larger positive values above 45∘ N, indicating that significantly more P becomes available to the plants in our simulations in those latitudinal bands when temperature increases. The carbon uptake in COU is similar in all three configurations, apart from latitudes above 45∘ N, which might suggest that overall the climate (temperature) is the limiting factor in those regions.
. In the latitudes above 60∘ N this even leads to a positive γL
with the carbon uptake in COU larger than in BGC due to the positive effect of temperature on productivity and nitrogen availability. In the CNP configuration γL
is smaller almost everywhere when compared with γL
from the CN configuration. The largest reduction in γL
can be observed in the tropics due to the large reduction in carbon uptake in BGC. Further north (above 20∘ N) γL
becomes slightly positive in the CNP configuration with larger positive values above 45∘ N, indicating that significantly more P becomes available to the plants in our simulations in those latitudinal bands when temperature increases. The carbon uptake in COU is similar in all three configurations, apart from latitudes above 45∘ N, which might suggest that overall the climate (temperature) is the limiting factor in those regions.
3.2. Contribution analysis
To better understand the change in the modelled response of βL
and γL
for the different ACCESS configurations (table 2), we use the three-pool model surrogate driven by NPP from the ACCESS simulations. The optimal parameter values and surrogate performance for all three configurations are presented in the supplementary material. The performance of the model surrogate is adequate ( for all three configurations) when compared against simulated pool sizes with ACCESS. This is confirmed by comparing βL
and γL
for all configurations from the surrogate model and from the ACCESS model (figure 3, cross-hatched bar compared with bar of matching colour). The feedbacks obtained from the surrogate are generally close to the those obtained from ACCESS as we would expect (errors
for all three configurations) when compared against simulated pool sizes with ACCESS. This is confirmed by comparing βL
and γL
for all configurations from the surrogate model and from the ACCESS model (figure 3, cross-hatched bar compared with bar of matching colour). The feedbacks obtained from the surrogate are generally close to the those obtained from ACCESS as we would expect (errors  ). Only γL
for the CNP configuration shows a larger discrepancy between ACCESS and the surrogate (around 30%), due to a larger mismatch in the soil carbon pool sizes for the BGC case (see supplementary material). However, this difference is still small compared to differences in γL
for the three different configurations. Thus, in order to investigate the response mechanisms between the various configurations this mismatch is not of great concern.
). Only γL
for the CNP configuration shows a larger discrepancy between ACCESS and the surrogate (around 30%), due to a larger mismatch in the soil carbon pool sizes for the BGC case (see supplementary material). However, this difference is still small compared to differences in γL
for the three different configurations. Thus, in order to investigate the response mechanisms between the various configurations this mismatch is not of great concern.

Figure 3. (a) Carbon-concentration (βL ) and (b) carbon-climate (γL ) feedbacks as calculated from ACCESS (black with hatched colours indicating the configuration: C (green), CN (orange) and CNP (blue)) and from the surrogate (solid coloured bars). To analyse the response of the feedbacks to the different configurations, we use the surrogate to combine NPP from each configuration with all three possible parameterisations of heteotrophic respiration (Rh ): C (green), CN (orange) and CNP (blue).
Download figure:
Standard image High-resolution image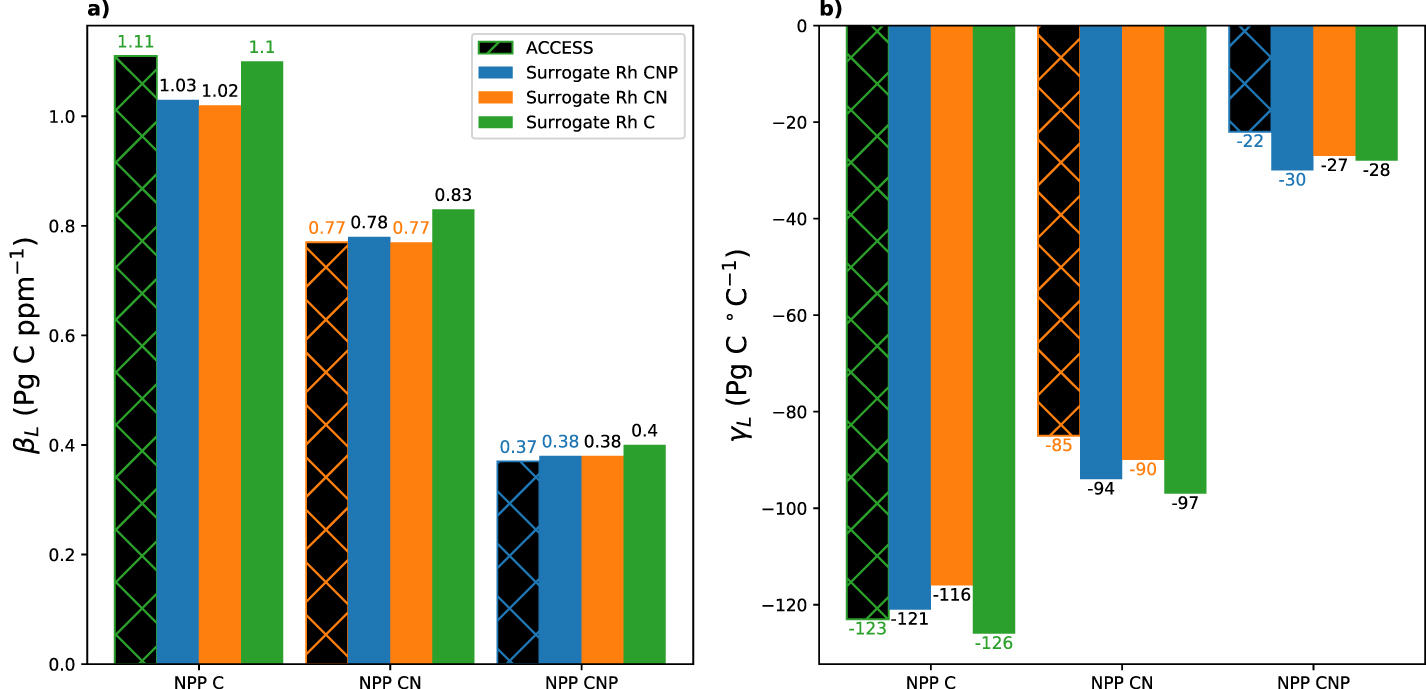
With the model surrogate we assess the various combinations of NPP (C, CN, CNP configuration from ACCESS) and Rh (C, CN, CNP parameterization in the surrogate) and the impact this has on the feedbacks (figure 3, crossed hatched bar compared against other colours). Our results show that a change in the Rh parameterization does not significantly impact the feedbacks. Overall this means that the feedbacks are independent of the underlying nutrient configuration of Rh with the feedback strength in our model entirely determined by the NPP configuration.
4. Discussion
The land carbon uptake in ACCESS without nutrient limitation (C configuration) is only about half of the corresponding CMIP6 mean uptake (see table 1). However, the range of land carbon uptake is large in the CMIP6 models due to differences in process representation in the land components of those models. These differences are caused by the type of processes included in the land component such as dynamic vegetation or fire, but also in the way processes are parameterised. Results are closer together in the BGC-C simulation (882 Pg C in ACCESS vs. 1012 Pg C for CMIP6).
For βL in the C configuration there is good agreement between the ACCESS results and the CMIP6 model mean (βL of about 1.1 and 1.2 Pg C ppm−1 respectively), although the range of the five CMIP6 models is large (0.6–1.8 Pg C ppm−1). On the other hand, γL in ACCESS is almost twice as large as the CMIP6 model mean (−124 vs. −64 Pg C ∘C−1). However, the range of γL for the models in the C configuration in CMIP6 is again very large with the two extremes at −163 and +16 Pg C ∘C−1 and therefore the ACCESS results still fall within this range.
Instead of only comparing the absolute values for land carbon uptake and feedbacks between ACCESS and the CMIP6 models in the C and CN configuration we can also compare the relative change (reduction). These estimates indicate a universal reduction in land carbon uptake (COU and BGC) and feedback strength (βL and γL ) due to N limitation of about 30% for ACCESS. Results based on the CMIP6 model mean (five models in C configuration and five models in CN configuration, tables 1 and 2) are more diverse. The reduction in land carbon uptake in COU is about 20%, whereas in BGC it is closer to 30%. Consequently, the reduction in the feedbacks for the CMIP6 models is about 30% for βL and 50% for γL . However, one of the CMIP6 models in the C configuration represents a strong outlier and removing this model from the calculation of the CMIP6 model mean leads to a more universal reduction of about 20% for both land carbon uptake and feedbacks.
Overall, the reduction in carbon uptake and feedback strength due to N limitation between ACCESS and the CMIP6 model mean shows good agreement. This is remarkable given the large differences in the representation of the N cycle and its impact on vegetation amongst the CMIP6 models, which is demonstrated by the large range of absolute land carbon uptake by those models (table 1).
The latitudinal analysis of the land carbon uptake and feedbacks has revealed that under climate change (COU simulations) mainly the extra-tropical northern latitudes become nutrient limited in ACCESS. For N, this is generally in agreement with meta-data analysis and observations (Vitousek and Howarth 1991, Terrer et al 2020). Phosphorus is assumed to be the key limiting nutrient in the tropics (Vitousek 1984) and the fact that the extra-tropics (mainly centred around 50∘ N, see figure 3(d) are also P limited in our simulations is somewhat surprising. For example, a simulation of the free-air CO2 enrichment experiment AmazonFACE with an ensemble of 14 land surface models showed that P availability reduced the biomass carbon growth in the Amazon region by about 50% compared to estimates from models in a C and CN configuration. However, the CO2 enrichment experiments were conducted over only 15 years and therefore do not take a change in temperature into account. In general, results from CO2 enrichment experiments are more comparable to our BGC results, where ACCESS in the CNP configuration does indeed show a strong reduction in carbon uptake and feedback strength in the tropics compared to the C and CN configuration.
The comparison of COU and BGC results demonstrates that in our model the climate (i.e. temperature) might be limiting the carbon uptake in the tropics. In the Amazon region this is mainly because temperature in the COU simulation exceeds the optimal temperature for photosynthesis and productivity therefore declines. A similar behaviour for this region was found in Ziehn et al (2020). A more detailed analysis of geographical differences (including the Amazon and other tropical regions) in land carbon uptake and feedbacks for the three different configurations in ACCESS will be provided in separate study.
Our result based on the model surrogate indicate that at the global scale, soil carbon is generally driven by vegetation productivity. This is in agreement with Todd-Brown et al (2013), who demonstrated that differences in simulated soil carbon across ESMs in CMIP5 were caused by NPP. Current ESMs do not explicitly simulate microbial dynamics due to its high computational requirements and lack of nonlinear response to carbon input. It is an arguable question whether the relationship of soil carbon and NPP is approximately linear over large spatio-temporal scales. At the global scale, as with other ESMs, soil carbon in ACCESS is largely driven by NPP, partly due to the smoothing effect over large regions.
5. Conclusions
Our analysis is based on simulations with a fully coupled ESM using a prescribed 1% yr−1 CO2 increase over 140 years for three different configurations: C (no nutrients), CN (nitrogen limited) and CNP (nitrogen and phosphorus limited). We find that nitrogen limitation reduces the land carbon uptake and the feedback strength in ACCESS for both the carbon-climate and carbon-concentration feedback by about 30%. Overall, this agrees well with the multi-model mean of CMIP6 models in the C and CN configuration, which shows a similar reduction. The addition of phosphorus limitation in ACCESS reduces the carbon-climate and carbon-concentration feedback further by about 50% and 75%, respectively. The total combined effect of nitrogen and phosphorus limitation in ACCESS leads to a reduction in the carbon-climate and carbon-concentration feedback by about 65% and 85%, respectively. Through the use of a surrogate model, we demonstrated that this reduction can be attributed mainly to a reduction in NPP. As a consequence, future land carbon uptake may not increase as much as projected by models without accounting for nutrient limitation, particularly in the temperate regions due to nitrogen limitation and across all latitudes due to phosphorous limitation. On the other hand, nutrient limitation also reduces the carbon-climate feedback via a reduction in carbon input to soil which in turn reduces soil heterotrophic respiration and additional surface warming. However, the reduction in surface warming and consequently the reduction in carbon emissions (due to the reduced carbon-climate feedback) are much smaller than the reduction of land carbon uptake due to nutrient limitation. Therefore, land-based carbon mitigation may not be as effective as projected by models without accounting for nutrient limitation. Ultimately this means, that a greater reduction in CO2 emission is required in order to limit global warming to below 2 ∘C.
Data availability statement
Any data that support the findings of this study are included within the article.