

Abstract
The frequency and intensity of high-temperature events continue to increase, resulting in a surge of pathogenicity and mortality. People with low levels of risk perception and adaptability, such as the elderly, suffer more from high temperatures. Effective intervention measures may lead to reduced levels of high temperature-related risk. The purpose of this study was to compare changes in temperature exposure, risk perception and coping behaviors under different intervention methods. Herein we conducted three different interventions including education, subsidies for electricity and uses of spray-cooling appliances as well as collected data about temperature exposure, risk perception, and coping behaviors. Before and after the experiment, we evaluated the intervention effectiveness with a number of variables related to alerting human responses under high temperatures. We conducted nonparametric tests for paired samples and generalized linear mixed effect models. Compared with subsidy support and outdoor spray-cooling methods, education is more effective as it leads to lower levels of temperature exposure, higher levels of risk perception, and more behavioral responses. The subsidy support intervention is useful in increasing risk perception and promoting home cooling practices as well. In comparison, spray cooling barely contributes to the reduction of personal temperature exposure. The encouragement of risk-related education and continued government subsidy may prevent elderly individuals from experiencing high-temperature exposure.
Export citation and abstract BibTeX RIS

Original content from this work may be used under the terms of the Creative Commons Attribution 4.0 license. Any further distribution of this work must maintain attribution to the author(s) and the title of the work, journal citation and DOI.
1. Introduction
The fifth assessment report of the Intergovernmental Panel on Climate Change has projected rising temperatures in the 21st century (IPCC 2014), as well as the increasing frequency and intensity of high-temperature events (IPCC 2012). With emerging evidences about the high-temperature related adverse health impacts (Robine et al 2008, Barriopedro et al 2011, Grumm 2011, Bai et al 2014, Sun et al 2014, Chen et al 2015), these high-temperature events are obtaining increasing public concerns. Influence from high-temperature hazards exists but is pretty limited for those with high risk perception and strong coping abilities for high temperatures (Liu et al 2013). In comparison, vulnerable groups such as the elderly are highly sensitive to high temperatures because of their decreased physical functions (Flynn et al 2005). Their relatively finite knowledge about risk from high-temperature exposure and low adaptability to high temperature further exacerbate this situation (Chen et al 2016). The 2020 Report of The Lancet Countdown on Health and Climate Change notes that both high-temperature events and heat-related mortality are rapidly increasing in the elderly population (Watts et al 2021). Under the current and forecasted climate status, effective methods are warranted to improve people's concerns about and promote their protective behaviors against high-temperature exposure.
The effectiveness of intervention is measured either as the reduction in mortality or the increase in the public response to high temperature (Bassil and Cole 2010, Toloo et al 2013). One example is the heat-health warning system, a prevalent measure reducing health impact from high temperatures (Kalkstein et al 2009). The system is implemented following the path of prediction, monitoring, warning and response planning (Mayrhuber et al 2018). Public health plans adopted for high temperatures are similar worldwide. Common measures include the installation of cooling equipment, the establishment of cooling centers, the granting of subsidies and education, etc (Bernard and Mcgeehin 2004, Kovats and Kristie 2006, Xu et al 2017). Studies conducted in Philadelphia, France, Wisconsin, Hong Kong and Shanghai have suggested a decline in heat-related mortality after applying the heat-health warning system (Palecki et al 2001, Weisskopf et al 2002, Ebi et al 2004, Tan et al 2007, Fouillet et al 2008, Chau et al 2009), but none of them have identified the causality between the system and mortality decline. For the evaluation of public responses, the elderly and socially isolated individuals tend to have limited access to public information and plans, which brings great challenges to the evaluation of the effectiveness of interventions (Martin 2016). The majority of intervention studies have been carried out in developed countries focusing on the general population while ignoring some vulnerable groups including the elderly (Lowe et al 2011, Martin 2016).
Given the lack in investigations concerning the effectiveness of specific intervention measures (Pawson et al 2005), we conducted a study consisting of one control group and three intervention groups that each used a different intervention method to compare changes in temperature exposure, risk perception and behavioral responses in Jiangsu Province, China. In Jiangsu, notable heat vulnerability exists, especially in rural areas (Chen et al 2016), where the future heat-related death burden could be three times greater than it is for now (Chen et al 2017). Selected interventions include education, subsidies for electricity and uses of spray-cooling appliances. Personal temperature exposure was monitored for elderly individuals, while questionnaires concerning their perceptions and behaviors were also collected. We tested the effects of the interventions via within- and between-group comparisons. Based on the findings, we aimed to provide theoretical support for the government to select practical and efficient intervention measures so as to protect rural residents from high-temperature exposure in a time of rapid climate change.
2. Methods
2.1. Survey description
Xinyi is located in the north of Jiangsu Province, China (figure S1 (available online at stacks.iop.org/ERL/16/055029/mmedia)). It belongs to the temperate monsoon climate zone with hot summer and concentrated rainfall (Xinyi Yearbook 2018). High-temperature exposure level for elders in rural areas, together with non-climate vulnerability factors such as the high physiological sensitivity, weak physical condition, potential social isolation and adaptive capacity jointly make them more susceptible to high-temperature exposure (Turner et al 2003, Hajat and Kosatky 2010, Chen et al 2016). There are about 887 elderly residents over 50 years old in the selected village. A total of 100 residents were selected by using simple random sampling, 80 of whom agreed to participate in our experiment. After excluding patients with chronic diseases, a total of 44 elderly individuals were determined to participate in this study. We randomly assigned 44 subjects to three intervention groups and one control group (n = 11 for each group) through the function of sample based on R software and verified that there were no significant differences in basic demographic characteristics among groups. Before the questionnaire survey, the informed consent of each participant was obtained. Three participants dropped out of the study in the middle because of personal reasons. Therefore, 41 subjects completed the whole period of intervention. The protocol of this study was approved by the Ethics Committee of School of the Environment, Nanjing University.
We conducted the study from 17 to 25 of July in 2019, the summer in Xinyi. The duration of study period depends on the occurrence of high-temperature weather. We captured the high-temperature period during 21st to 25th. The first four days was designed as the pre-intervention period and the rest as post-intervention period. Three different interventions were applied. One is education intervention, during which we gave a lecture about the definition, cause, harm and preventive measures of high temperature on 21 July, gave out high-temperature exposure related handbooks on 22 July, sent reminding messages on 23 July, and paid home-visits to provide suggestions on high-temperature prevention behaviors on 24 July. These education measures were carried out by 8 a.m. every day. The second intervention was grant of subsidies. We provided 10 yuan every day to cover the electricity spending on use of fans and/or air conditioners in hope that they would use these appliances more often during the hot weather. Galvanometers were installed to monitor the use of appliances. The last intervention was applied with an atomized spray-cooling appliance integrated with a timer, a micro pressure pump, ten nozzles and a pipe of 15 m in length while 8 mm for inner diameter (figure S2). The pipe was hung 2 m high while nozzles were installed with a distance of 1.5 m between each other (figure S3). We set the cooling system to spray for 5 min each half an hour from 9 a.m. to 5 p.m. Meanwhile, we offered 5 yuan as subsidy per household per day for the use of energy. Subsidies for the latter two groups were provided one day in advance. Participants in the control group received no suggestions on high-temperature prevention and were assumed to continue their life styles. The pre-intervention questionnaire survey was conducted on 17 July while a post-intervention questionnaire survey was employed on 25 July (figure 1).

Figure 1. Study design of the intervention. Shows the different groups and overall process of intervention experiment.
Download figure:
Standard image High-resolution image2.2. Temperature exposure
Individual temperature exposure levels were measured every 5 s with a wearable thermometer in the study period. The temperatures were rounded to hourly averages for analyses. Indoor and outdoor temperature were calculated by combining individual temperature exposure and time-activity log. Hourly ambient temperatures recorded by the nearest monitoring station (No. 581410) were downloaded from the website of National Climatic Data Center (NCDC).
2.3. Questionnaire
Both pre- and post-intervention questionnaires consisted of three parts: demographic and socioeconomic information (table S1), risk perception of high temperatures (table S2), as well as behavioral responses to high temperatures (table S3). Specifically, questions for risk perception measurements were designed based on a psychological paradigm method regarding natural hazards (Slovic 1987, Huang et al 2013, 2018). This psychological paradigm measures individual's subjective cognition and attitude towards given environmental risk based on their intuition and experiences (Slovic 1987). The enrolled risk perceptions and corresponding questions used in this study are: controllability ('Do you agree that human beings can take a series of measures to control the impact of high temperature?'), effect ('How much do you think the high temperature affect you?'), familiarity ('Are you familiar with the cause of the high temperature?') and concern ('Are you concerned about the risk associated with high temperature?'). Adaptation includes protective measures to avoid, get ready for, or respond to high temperatures. The focus of mitigation efforts is to reduce sources and emissions of greenhouse gases (Semenza et al 2008). As seen in table S3, adaptation included three outcome variables (home cooling practices: two items, learning: three items and outdoor protection: two items) and mitigation consisted of eight items. Responses were scored from 1 to 5 to distinguish participants' levels of perception and behaviors. Responses for each question enrolled in risk perception and behavioral responses were scored from 1 to 5 to distinguish participants' perception or response levels. The adaptation and mitigation scores were derived from the average of the specific item scores. Time-activity patterns were also recorded by each participant (table S4).
2.4. Statistical analysis
A descriptive statistical analysis was conducted to show the basic demographic characteristics in four groups. Kruskal–Wallis test (for continuous variables) and chi-square test (for categorical variables) was used to identify the differences in personal basic demographic characteristics among groups. Multiple mediation analysis was applied to examine the indirect effects of temperature exposure on risk perception, and then on behavioral responses for the control group with PROCESS procedure version 3.0 within SPSS (version 22.0, IBM, New York) developed by Preacher and Hayes (Hayes 2013). Personal overall temperature exposure was the independent variable. The model included the response scores of three types of adaptation as dependent variables, and four dimensions of risk perception of high temperatures were input into the model as mediating factors. Nonparametric test (Wilcoxon) of paired samples was conducted to compare within group changes in temperature exposure, risk perception, and behavioral responses before and after intervention (SPSS, version 22.0, IBM, New York). We verified the effects of intervention on outcome variables with generalized linear mixed-effect models that included temperature exposure, scores of risk perception and scores of adaptation as dependent variables using 'lme4' package (version 3.1.0) in R software (version 3.5.2, R Foundation for Statistical Computing, Vienna, Austria). Group (control, education, subsidy, and spray), period (pre-intervention and post-intervention), and the interactions between group and period were fixed effects in the model. The personal temperature exposure, age, gender, income, air-conditioning and health status were controlled as additional covariates. We set the participants' id as a random effect to solve the problem of repeated measurement data. When the interaction effects of group and period were significant, we further computed the differences of outcome variables between intervention group and control group in different periods by summarizing the results of the mixed effect models with 'emmeans' package (version 1.5.4) in R software. In addition, we have also conducted modeling with control of time and intervention method only to verify the results. The figures were plotted with ggplot2 package (version 3.1.0) in R and Visio software (version 16.0, Microsoft Corporation, Washington, America).
3. Results
3.1. Descriptive statistics
A p-value of lower than 0.05 indicates a significant difference. Here in our study, all among-group differences were insignificant with p-values higher than 0.1. The average age of each group was between 57.9 and 60.1 years, the sex ratio was balanced, and those with a low-level of education comprised more than 60% of the respondents in each group and 63% overall. More than 85% of the respondents were farmers and had air conditioner in their homes. All the participants reported that they had no chronic diseases. Together, we detect no significant difference in the basic demographic characteristics among the four groups (table 1).
Table 1. Baseline characteristics of the study population by groups.
| Characteristics | Control group | Educatio group | Subsidy support group | Spray-cooling group | p-value a |
|---|---|---|---|---|---|
| Number (N) | 10 | 10 | 11 | 10 | — |
| Sex | |||||
| Male (N) | 4 | 3 | 5 | 4 | 0.910 |
| Age | 57.9 ± 6.57 | 58.4 ± 6.42 | 58.8 ± 6.66 | 60.1 ± 7.40 | 0.881 |
| Education | |||||
| Low level (N) | 6 | 6 | 8 | 6 | 0.917 |
| Medium level (N) | 4 | 4 | 3 | 4 | |
| Annual income per capita (yuan) | 15330 ± 9777 | 15690 ± 8442 | 13982 ± 4020 | 15050 ± 7920 | 0.967 |
| Farming | |||||
| Yes (N) | 9 | 8 | 9 | 9 | 0.877 |
| Air-conditioning | |||||
| Yes (N) | 8 | 9 | 10 | 8 | 0.825 |
| Health | |||||
| Moderate (N) | 3 | 4 | 3 | 4 | 0.894 |
| Good (N) | 7 | 6 | 8 | 6 | |
| Temperature exposure (°C) | |||||
| Overall exposure | 28.8 ± 0.78 | 28.5 ± 0.85 | 28.1 ± 0.54 | 28.5 ± 0.94 | 0.248 |
| Indoor exposure | 28.6 ± 0.77 | 28.4 ± 0.96 | 28.1 ± 0.55 | 28.4 ± 1.05 | 0.380 |
| Outdoor exposure | 29.1 ± 1.15 | 28.5 ± 1.06 | 28.2 ± 0.78 | 28.8 ± 1.09 | 0.227 |
a Difference among groups.The format of data in the table is mean ± standard deviation.Kruskal–Wallis test (for continuous variables), chi-square test (for categorical variables).
3.2. Changes in temperature exposure following the intervention
During the study, the maximum ambient temperature measured by the nearest monitoring site increased from 29.4 °C before the intervention to 34.3 °C after the intervention (figure S4). Before the intervention, the overall temperature exposure was similar among the three intervention groups and the control group (all around 28.5 °C, p = 0.248) (table 1). When the ambient temperature rose in the later stage of the intervention, the overall temperature exposure increased significantly in both the control group and the group using the cooling spray intervention (p = 0.005, 0.005). In comparison, the overall post-intervention temperature exposure only slightly increased for the group with the subsidy support intervention (29.1 °C, p = 0.062) but remained unchanged for the group with the education intervention (p = 0.721). Concretely, there was no significant change in individual indoor temperature exposure in either the education group or the subsidy group (p = 0.721, 0.248). The difference in personal temperature exposure in the outdoor environment was finite for the education group but noticeable for the other three groups (table 2 and figure S5).
Table 2. Temperature exposure changes during the intervention in four groups.
| Group | Overall temperature (°C) | Indoor temperature (°C) | Outdoor temperature (°C) | ||||||
|---|---|---|---|---|---|---|---|---|---|
| Pre-intervention | Post-intervention | p-value | Pre-intervention | Post-intervention | p-value | Pre-intervention | Post-intervention | p-value | |
| Control group | 28.8 ± 0.78 | 30.8 ± 0.43 | 0.005** | 28.6 ± 0.77 | 30.4 ± 0.70 | 0.007** | 29.1 ± 1.15 | 31.4 ± 0.93 | 0.017* |
| Education group | 28.5 ± 0.85 | 28.5 ± 1.25 | 0.721 | 28.4 ± 0.96 | 28.5 ± 1.27 | 0.721 | 28.5 ± 1.06 | 28.8 ± 1.49 | 0.374 |
| Subsidy support group | 28.1 ± 0.54 | 29.1 ± 1.33 | 0.062 | 28.1 ± 0.55 | 28.7 ± 1.41 | 0.248 | 28.2 ± 0.78 | 30.1 ± 1.42 | 0.011* |
| Spray-cooling group | 28.5 ± 0.94 | 30.4 ± 1.11 | 0.005** | 28.4 ± 1.05 | 30.3 ± 1.17 | 0.005** | 28.8 ± 1.09 | 31.1 ± 1.17 | 0.007** |
The format of data in the table is mean ± standard deviation.Overall temperature: the average temperature exposure across the study period, including indoor and outdoor exposure.Non-parametric tests of paired samples within the groups.*p < 0.05, **p < 0.01.
The results of mixed effect model showed that there were significant interactions between groups and periods for the individual temperature exposure, which indicated that different groups have different effects on temperature exposure before and after intervention (p = 0.002, 0.006, 0.010). Specifically, in the pre-intervention period, there was no significant difference in the individual temperature exposure between the intervention groups and the control group. In the post-intervention period, on average, the impacts of education on overall temperature exposure, indoor temperature exposure and outdoor temperature exposure were 2.27 °C (95% CI: −3.15 to −1.39), 1.95 °C (95% CI: −2.89 to −1.00), and 2.63 °C (95% CI: −3.70 to −1.55) lower than those in the control group, respectively (p < 0.001). The impacts of subsidy support on overall temperature exposure and indoor temperature exposure decreased significantly compared with the control group (p < 0.001) (table 3). In addition, the intergroup comparisons between intervention groups showed that, compared with the cooling-spray group, the overall temperature exposure and indoor temperature exposure of the education and subsidy group were significantly reduced. Significant differences of the outdoor temperature exposure were also found between the education group and the cooling spray group (table S11).
Table 3. Intergroup differences in temperature exposure in different periods between the control group and the intervention groups.
| Response variable | Group × period | Period | Group | ||
|---|---|---|---|---|---|
| Education group vs control group | Subsidy support group vs control group | Spray-cooling group vs control group | |||
| Overall temperature | 5.99** (0.002) | Pre-intervention | −0.24 (−1.12, 0.64) | −0.62 (−1.48, 0.25) | −0.24 (−1.12, 0.64) |
| Post-intervention | −2.27*** (−3.15, −1.39) | −1.63** (−2.49, −0.77) | −0.36 (−1.23, 0.52) | ||
| Indoor Temperature | 4.79** (0.006) | Pre-intervention | −0.20 (−1.14, 0.74) | −0.53 (−1.46, 0.39) | −0.25 (−1.19, 0.69) |
| Post-intervention | −1.95 *** (−2.89, −1.00) | −1.70** (−2.63, −0.78) | −0.16 (−1.10, 0.79) | ||
| Outdoor temperature | 4.40** (0.010) | Pre-intervention | −0.52 (−1.57, 0.53) | −0.98 (−2.03, 0.08) | −0.28 (−1.32, 0.77) |
| Post-intervention | −2.63*** (−3.70, −1.55) | −1.23 (−2.28, −0.17) | −0.30 (−1.35, 0.74) | ||
The data format of the group column in the table is estimated value (95% confidence interval).The data format of the group × period column in the table is F value (p value).*p < 0.05, **p < 0.01, ***p < 0.001.
3.3. Changes in risk perceptions following the intervention
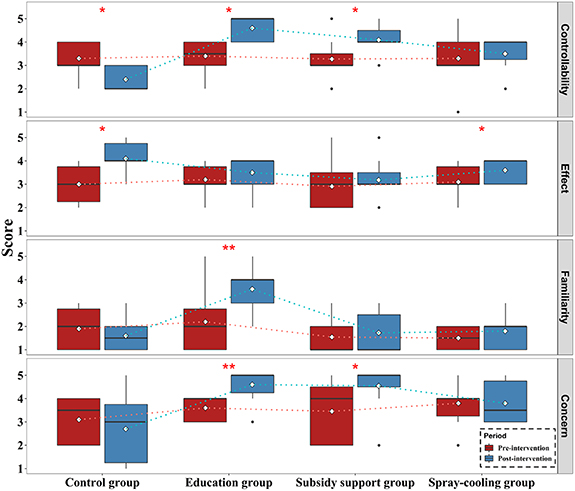
During the intervention, the perceived effect increased significantly as the temperature increased in both the control group and the spray-cooling group (p = 0.026, 0.025) but barely changed for the remaining two groups. In comparison, the perceived controllability demonstrated a large decrease for the control group (p = 0.021) compared with the pre-intervention level, but it increased significantly for those with the educational (p = 0.016) and subsidy support interventions (p = 0.024). Education and subsidy measures can effectively improve perceived Concern (p = 0.008, 0.030). For familiarity, a significant increase was only found for the educational intervention group (p = 0.008) (figure 2 and table S5). We also noticed that overlaps appeared in general between the pre- and post-intervention risk perception distributions when the change in a given perception was not significant. For example, extensive overlaps were observed for the pre- and post-intervention effect levels for education group while there was no or very limited overlaps for controllability, familiarity or concern levels for the same group of participants. The only exception was effect for spray-cooling group.
Figure 2. Variations in risk perception of high temperature determined in samples in four groups along with intervention time. Each plot represents a dimension of risk perception; the y-axis represents perception scores and the x-axis shows the study's group.
Download figure:
Standard image High-resolution image
The results of mixed effect model showed that there were significant interactions between groups and periods for the perceived controllability, familiarity and concern, which indicated that different groups have different effects on risk perception before and after intervention (p = 0.001, 0.001, 0.003). Specifically, in the pre-intervention period, there was no significant difference in the risk perception of high temperature exposure between the intervention groups and the control group. In the post-intervention period, on average, the impacts of education on perceived controllability, familiarity and concern were 1.81 (95% CI: 1.02–2.59), 2.29 (95% CI: 1.37–3.20), and 2.54 (95% CI: 1.54–3.54) higher than those in the control group, respectively (p < 0.001). The impacts of subsidy support on controllability and concern increased significantly compared with the control group (p < 0.001) (table 4).
Table 4. Intergroup differences in risk perception of high temperature in different periods between the control group and the intervention groups.
| Response variable | Group × period | Period | Group | ||
|---|---|---|---|---|---|
| Education group vs control group | Subsidy support group vs control group | Spray-cooling group vs control group | |||
| Controllability | 6.22** (0.001) | Pre-intervention | −0.02 (−0.66, 0.63) | 0.08 (−0.56, 0.72) | −0.02 (−0.66, 0.62) |
| Post-intervention | 1.81*** (1.02, 2.59) | 1.72*** (1.03, 2.41) | 1.02* (0.38, 1.66) | ||
| Effect | 0.94 (0.432) | Pre-intervention | 0.28 (−0.36, 0.93) | 0.17 (−0.47, 0.81) | 0.16 (−0.48, 0.80) |
| Post-intervention | −0.06 (−0.84, 0.71) | −0.43 (−1.12, 0.26) | −0.41 (−1.06, 0.23) | ||
| Familiarity | 6.60** (0.001) | Pre-intervention | 0.40 (−0.38, 1.19) | −0.24 (−1.02, 0.54) | −0.37 (−1.15, 0.41) |
| Post-intervention | 2.29*** (1.37, 3.20) | 0.31 (−0.52, 1.14) | 0.26 (−0.52, 1.04) | ||
| Concern | 5.58** (0.003) | Pre-intervention | 0.60 (−0.22, 1.43) | 0.64 (−0.18, 1.46) | 0.70 (−0.12, 1.52) |
| Post-intervention | 2.54*** (1.54, 3.54) | 2.38*** (1.50, 3.27) | 1.14* (0.31, 1.96) | ||
The data format of the group column in the table is estimated value (95% confidence interval).The data format of the group × period column in the table is F value (p value).*p < 0.05, **p < 0.01, ***p < 0.001.
3.4. Changes in behavioral responses following the intervention
Nonparametric tests of the paired samples showed that education can raise people's awareness of taking long-term mitigating actions to slow climate warming (p = 0.005). Changes in mitigation behaviors in the other three groups fluctuated mildly before and during interventions without a specific pattern (table S5 and figure S6).
For adaptive behaviors, it was conformed that different levels of significant increases were related to adaptive behaviors for the four groups during the intervention period (p = 0.007, 0.005, 0.003 and 0.008 for control, education, subsidy support, and spray-cooling group, respectively). However, as showed in figure S7, the natural pattern in which temperature affects behavioral adaptation through the perceived effect interfered with the assessment of the interventions' impacts on behavioral adaptation. Specifically, home cooling practices and outdoor protection behaviors within the four groups all significantly increased from the beginning of interventions (table S6). The behavioral response to learning for the educational intervention group was significantly higher during the intervention period than during the pre-intervention period (Levelpre-int = 2.90, Levelpost-int = 3.70, p = 0.007). This outcome was not observed in the other three groups.
Further analysis showed that there were significant interactions between groups and periods for the adaptive behavioral responses (p < 0.001, p = 0.001, 0.017). Specifically, in the pre-intervention period, there were no significant differences found regarding the adaptation to high temperatures between the intervention groups and the control group. In the post-intervention period, on average, the response scores in the educational intervention group were the highest. Compared with the control group, the increased levels were 0.76 (95% CI: 0.33–1.19, p = 0.006), 1.04 (95% CI: 0.65–1.43, p < 0.001) and 0.64 (95% CI: 0.10–1.18, p = 0.105) for home cooling practices, learning and outdoor protection behaviors, respectively. The adaptation scores for the subsidy support intervention group were 0.55 (95% CI: 0.17–0.93, p = 0.031) higher than those for the control group in regard to home cooling practices (table 5).
Table 5. Intergroup differences in adaptive behavioral responses of high temperature in different periods between the control group and the intervention groups.
| Response variable | Group × period | Period | Group | ||
|---|---|---|---|---|---|
| Education group vs control group | Subsidy support group vs control group | Spray-cooling group vs control group | |||
| Home cooling practices | 7.04*** (<0.001) | Pre-intervention | 0.03 (−0.33, 0.39) | −0.02 (−0.37, 0.34) | 0.34 (−0.02, 0.69) |
| Post-intervention | 0.76** (0.33, 1.19) | 0.55* (0.17, 0.93) | 0.10 (−0.25, 0.46) | ||
| Learning behaviors | 6.40** (0.001) | Pre-intervention | 0.27 (−0.05, 0.60) | 0.21 (−0.12, 0.53) | 0.14 (−0.19, 0.46) |
| Post-intervention | 1.04*** (0.65, 1.43) | 0.26 (−0.08, 0.61) | 0.26 (−0.07, 0.58) | ||
| Outdoor protection | 3.83* (0.017) | Pre-intervention | 0.07 (−0.39, 0.53) | 0.33 (−0.12, 0.78) | −0.08 (−0.53, 0.37) |
| Post-intervention | 0.64 (0.10, 1.18) | 0.04 (−0.44, 0.53) | −0.19 (−0.65, 0.26) | ||
The data format of the group column in the table is estimated value (95% confidence interval).The data format of the group × period column in the table is F value (p value).*p < 0.05, **p < 0.01, ***p < 0.001.
4. Discussion
In the control group, high levels of perceived effect suggested that the elderly had already realized the impacts of high temperatures, meanwhile, their low levels of perceived concern, familiarity and controllability indicated that they had ignored the danger and felt powerless in preventing themselves from the risk of high-temperature exposure. However, we found that elderly individuals spontaneously adjust their behaviors due to the change in perceived effect under high temperatures. Previous findings also support the idea that risk perception is a mediating effect factor for the relationship between risk exposure and behavioral changes (Chen et al 2013, Ban et al 2019). Temperature exposure could hardly be controlled without intervention. It might be insufficient to adopt coping behaviors by relying only on 'common sense' and changes in somatosensory temperatures, especially when considering that high temperatures could quickly pose dreadful effects on the elderly and the isolated people (Toloo et al 2013). Thus, it is necessary to take effective interventions to promote protective responses.
Interventions play an important role in preventing people from being exposed to high temperatures. Education intervention is a highly effective intervention method in reducing temperature exposure, improving perception levels and increasing behavioral responses. This is probably because that the marginal benefit of education is larger for elderly individuals with low education levels enrolled in our study. The subsidy support intervention also had a positive effect on improving concern and encouraging home cooling practices, both of which could help reduce the indoor temperature exposure level for elderly individuals in poor economic status. In the sensitivity model, we found that persisting significant influence from the education and subsidy support interventions even there were changes in specific values (tables S8–S10). Knowledge levels and attitudes towards risks could be promoted by interventions such as high-temperature subsidies and adjusting work hours according to the daily peak temperature (Xu et al 2017). However, the encouraged use of certain cooling appliances (e.g. air-conditioner) due to subsidy support may lead to increase in greenhouse gas emissions. Subsidy support therefore shall not be the first choice for high-temperature prevention except for the protection of vulnerable groups (Martinez et al 2019). As for the spray-cooling intervention, its influence on behavioral responses was unfortunately limited. The improper spray setting is partially responsible for this inefficiency. With limited coverage areas and an intermittent spray pattern, the spray could only slightly reduce the temperature in the yards and cool down the participants when they were outside. Based on the improvement in perception levels and behavioral responses due to interventions, there might be health benefits present as well. The rising levels of risk perception and the implementation of protection/cooling actions significantly reduce the amount of personal temperature exposure during high temperatures, with a resultant decline in adverse heat impacts (Liu et al 2013). One example is the heat-health action plans that are currently applied in Europe (Martinez et al 2019). Up to a 68% reduction in expected mortality in France in 2006 was closely related to these action plans (Fouillet et al 2008). A study of 23 Italian cities observed that heat prevention was conducive to improving heat adaptation and response behaviors for local citizens, which led to a decline in the health effects related to high temperatures (De'donato et al 2018).
Being the least expensive and the most convenient application format, education tends to be the most effective intervention method compared with the other intervention methods. Effective interventions should enhance risk perception levels and maximize the transformation of perception into actions that can prevent heat-related illness. Considering the varied intervention methods, it is important to determine easily accessible interventions for people, especially vulnerable groups. The empirical evidence from our study suggests that education can help people to understand, be concerned about and eventually take action regarding dealing with high-temperature events. Education interventions could be conducted in many formats, such as lectures, posters, videos, home visits and even intergenerational learning (Ma et al 2016, Lawson et al 2019). To adapt to global warming, it is suggested that specific health education measures about high temperatures be conducted for the rural elderly population. Education would be more helpful when fully explaining different aspects of high-temperature exposure, such as explaining what high temperatures are, how such temperatures affect certain individuals, where to obtain information, and clear behavioral changes (Ma et al 2016, Wang et al 2018). Our study provides a reference for the development of heat-related prevention policies and/or disciplines.
We acknowledge the existing limitations in this study. First, the recruited sample size was small, and the study duration was also slightly limited. However, this study is only a preliminary trial, and the personal monitoring used in our study offered more accurate temperature data. The acknowledgment of the long-term impacts of the examined interventions still calls for follow-up studies, especially for the most vulnerable groups in rural areas. Second, most of the recruited participants examined herein were illiterate and thus may not have been able to develop a comprehensive understanding of the questionnaire and/or the following interventions. The educational information obtained from interviewers could have helped the participants better understand the questionnaire and other provided information, thereby strengthening the reliability and validity of our results. In the end, the fact that only a single village was studied may place restrictions on the generalizability of the conclusions.
5. Conclusion
There is growing concern about how to protect vulnerable groups from high-temperature exposure. Our study demonstrates the possibility of improving risk perception and behavioral responses with proper interventions to reduce temperature exposure among elderly individuals. Compared with those who received the subsidy support or spray-cooling interventions, temperature exposure increased the least when the ambient temperature rose for the elderly participants who received the education intervention. The elderly population's overall risk perception, adaption and mitigation levels also increased the most after the education intervention. However, subsidies also helped prevent elderly people from experiencing high temperatures by promoting home cooling practices and increasing their levels of risk perception. In contrast, the elderly participants barely benefited from the spray-cooling intervention. Thus, our study reveals the importance of providing high-temperature related guidance for undereducated populations, such as elderly individuals. Targeted subsidies could also help increase such awareness. This study also provides practical references for the future development of health-related high-temperature policies.
Acknowledgments
The authors declare no competing interests. The ideas for this paper were conceived by Lei Huang and Tiantian Li. Jianing Lou and Jie Ban analyzed the data. Jianing Lou and Ting Zhang wrote the paper. Jianing Lou, Ting Zhang, Jie Ban, Peng Wang, Yangyang Wu and Jun Bi contributed to the discussion of the results and methods. This work was supported by the Chinese Natural Science Foundation (41822709 and 71921003) and the Fundamental Research Funds for the Central Universities.
Data availability statement
The data that support the findings of this study are available upon request from the authors.
The data generated and/or analyzed during the current study are not publicly available for legal/ethical reasons but are available from the corresponding author on reasonable request.
Statement
The authors have confirmed that any identifiable participants in this study have given their consent for publication.