

Abstract
Buildings energy consumption is one of the most important contributors to greenhouse gas (GHG) emissions worldwide, responsible for 23% of energy-related CO2 emissions. Decarbonising the energy demand of buildings will require two types of strategies: first, an overall reduction in energy demand, which could, to some extent, be achieved at negative costs; and second through a reduction of the carbon content of energy via fuel switching and supply-side decarbonisation. This study assesses the contributions of each of these strategies for the decarbonisation of the buildings sector in line with a 1.5°C global warming. We show that in a 1.5°C scenario combining mitigation policies and a reduction of market failures in efficiency markets, 81% of the reductions in buildings emissions are achieved through the reduction of the carbon content of energy, while the remaining 19% are due to efficiency improvements which reduce energy demand by 31%. Without supply-side decarbonisation, efficiency improvements almost entirely suppress the doubling of emissions that would otherwise be expected, but fail to induce an absolute decline in emissions. Our modelling and scenarios show the impact of both climate change mitigation policies and of the alleviation of market failures pervading through energy efficiency markets. The results show that the reduction of the carbon content of energy through fuel switching and supply-side decarbonisation is of paramount importance for the decarbonisation of buildings.
Export citation and abstract BibTeX RIS

Original content from this work may be used under the terms of the Creative Commons Attribution 4.0 license. Any further distribution of this work must maintain attribution to the author(s) and the title of the work, journal citation and DOI.
1. Introduction
Buildings energy demand accounts for 31% of global final energy use, 8% of energy-related CO2 emissions and 23% of emissions if indirect emissions due to electricity generation are taken into account (Rogelj et al 2018). Without stringent climate policies, buildings energy demand is expected to increase due to demographic trends and socio-economic developments (Lucon et al 2014, Levesque et al 2018), raising the pressure on the energy system to decrease its emissions. Limiting global warming below 1.5°C or 2°C by 2100 therefore requires strong actions to reduce the impact of buildings activities.
There are essentially two complementary strategies to decrease emissions induced by activities in buildings: through a reduction of the level of energy demand, or through a reduction of emissions per unit of energy demand.
The first strategy—reducing energy demand—has long attracted the attention of energy analysts since some of its potential could be reached at negative costs, i.e. given the prevailing prices, individuals and organisations would benefit from investing more into energy efficiency (Hausman 1979, Rosenfeld et al 1993, Brown et al 2008, Ürge-Vorsatz and Novikova 2008, Granade et al 2009, Nauclér and Enkvist 2009, Lovins 2018). Based on a wealth of case studies, the Fifth IPCC Assessment report (Lucon et al 2014) thereby concludes that cost-effective technologies already exist to decrease energy demand significantly, but that this potential was not tapped due to market failures and implementation barriers. This phenomenon is known as the energy efficiency gap (Jaffe and Stavins 1994, Gillingham and Palmer 2014, Gerarden et al 2017). The debate on the depth of the energy efficiency gap is however still ongoing (Allcott and Greenstone 2012, Gillingham et al 2012, Davis et al 2014, Levinson 2016, Hoffman et al 2017, Kotchen 2017, Fowlie et al 2018).
The second strategy—decreasing the emission intensity of energy consumption—combines a decrease in the emission intensity of energy carriers with a switch towards low-emission energy carriers. A pre-condition for this strategy to be successful is that energy supply decarbonises; in particular, that electricity, district heating and cooling or hydrogen are produced with low carbon technologies. Buildings emissions can then be reduced by raising the market shares of these low-carbon energy forms (Connolly et al 2014, Paardekooper et al 2018). Integrated assessment models (IAMs) are appropriate tools to investigate this second strategy (Clarke et al 2014, Rogelj et al 2018), as they adopt an energy system perspective.
A host of studies has investigated the contribution of buildings emission reductions to global warming mitigation. Some studies concentrated on the role of energy demand reductions, without taking energy supply evolutions into account (Hens et al 2001, Ürge-Vorsatz et al 2007, 2009, 2012, Mata et al 2013). Other studies included exogenous energy supply changes (Sandberg and Brattebø 2012, Subramanyam et al 2017a, 2017b, Novikova et al 2018, Tan et al 2018, Zhou et al 2018, Goldstein et al 2020), however often giving little detail on the supply-side assumptions and sometimes leading to inconsistent degrees of ambition between energy demand reductions and supply transformations. By contrast, studies based on IAMs do integrate energy supply endogenously, but energy efficiency improvements mostly result from exogenous assumptions (Eom et al 2012, Chaturvedi et al 2014, Chaturvedi and Shukla 2014). Paardekooper et al (2018) and Bürger et al (2019) integrate both energy demand and supply endogenously, but they do not decompose the respective roles of supply and demand in the decarbonisation of the sector, while Wang et al (2018) and Edelenbosch et al (2020) focus mainly on direct emissions. Langevin et al (2019) undertook such a decomposition for the US building sector, with however exogenous assumptions for the supply sector. There is therefore a strong need for a global analysis of the decarbonisation of buildings within a modelling framework integrating both demand and supply with endogenous responses, and within the context of a stringent climate target. The modelling framework presented here allows such an analysis.
In addition, buildings energy demand is faced with two major economic energy-related issues: the efficiency gap mentioned above and the global warming externality that is not properly reflected in energy prices. These two challenges call for different types of policies: policies addressing market failures in efficiency markets on the one hand, and carbon pricing policies on the other hand. From the studies cited before, none has performed a systematic assessment of both types of policies. While in the literature, some scenario exercises model both the efficiency gap and carbon prices (Koomey et al 2001, Capros et al 2016), they do not assess the distinct impact of solving both challenges on buildings energy demand and emissions.
Our study provides an assessment of the individual contributions of energy demand reductions and of reductions in the carbon content of energy for the decarbonisation of buildings' activities within a 1.5°C scenario. Moreover, the study performs a transparent assessment of two types of economic challenges highly relevant for the decarbonisation of buildings energy demand: reducing the efficiency gap and carbon pricing. Specifically, we address the following question: what is the respective importance of energy demand reductions and carbon content reductions for the decarbonisation of buildings, in line with a global 1.5°C climate target and considering the impact of both carbon pricing and reducing the energy efficiency gap? The study further details the analysis by considering the influence of useful energy demand and of final to useful energy efficiency on the one hand, and of fuel switching and energy supply decarbonisation on the other hand. In addition, and in contrast with other IAM studies assuming exogenous efficiency improvements, this study explicitly accounts for the costs of efficiency measures in the buildings sector by representing efficiency capital stocks.
2. Methods
2.1. Decomposing the strategies to decrease buildings emissions
When analysing the emissions from the buildings sector, it is important to consider not only direct emissions from on-site combustion of fossil fuels, but also the impact that buildings energy demand exerts on energy supply emissions. Emissions from energy use in buildings can be decomposed straightforwardly between the influence of useful energy  , the conversion intensity
  and the emission intensity
  (equation (1)). Useful energy corresponds to the amount of energy that comes out of a conversion appliance and is available to provide an energy service. In the case of space heating, useful energy is the energy delivered by the boiler to the room to be heated. Final energy is the energy bought on markets or collected by consumers (e.g. electricity or traditional biomass). The ratio between final and useful energy gives the conversion intensity. To compute the resulting emissions, one needs to take the emission intensity into account (equation (2)). The latter can be disaggregated into the shares of each energy carrier (
 ), and the individual emission intensity of energy carriers
  :
:
From this decomposition, four strategies emerge to decrease buildings emissions (table 1), which we can regroup into two broad categories: reductions in energy demand, and reductions in the carbon content of energy.
Table 1. Summary of the strategies leading to a decarbonisation of buildings energy services.
| General strategy | Detailed strategy |
|---|---|
| Reducing energy demand | Useful energy : decreasing the amount of useful energy either through a reduction of the level of energy service (Levesque et al 2019)—reducing the amount of hot water needed to take a shower, adapting the indoor room temperature to outdoor temperature—or by improving the efficiency of passive systems (Cullen and Allwood 2010) that convert the amount of useful energy into an energy service. In buildings, this concerns primarily the building shell which determines the amount of useful energy needed to provide a given indoor temperature Conversion efficiency : improving the conversion efficiency of appliances. |
| Reducing the carbon content of energy | Electrification and fuel switch : switching to energy carriers whose carbon content is low, in particular via electrification, district heat or hydrogen. This strategy requires the energy supply to be decarbonised. Supply decarbonisation : decarbonising energy carriers in the energy supply sector. The potential for decarbonisation varies greatly across energy carriers. |
In this study, we are interested in estimating the individual contributions of each of these four detailed strategies on the evolution of buildings emissions, especially in the context of mitigation scenarios. To that end, we decompose the change in emissions following equation (3) (details in supplementary note 6 (available online at stacks.iop.org/ERL/16/054071/mmedia))

With  the effect of useful energy,
  the effect of the conversion efficiency,
  , the effect of electrification and fuel switching and
  the effect of supply decarbonisation. The effect of energy demand reduction is summarised by combining the effects of useful energy and of the conversion efficiency.
2.2. Modelling framework
We use the IAM REMIND (Luderer et al 2013, ADVANCE 2016) to analyse the role of buildings energy demand in the context of the whole energy system. REMIND is a general equilibrium model which includes representations of the economic, energy and climate systems. It is used to conceive of possible pathways to curb climate change, but also to assess the social and environmental implications of these pathways. REMIND represents 12 regions 3 covering the global energy demand and GHG emissions. In REMIND the macroeconomic output is a function of the inputs labour, capital and aggregated energy services. The aggregated energy services derive from the energy consumption in three sectors: buildings, industry and transport. Each sector requires final energy carriers to provide the sector-specific energy services. The economic output is used for consumption, trade, investments into the macroeconomic capital stock, and energy system expenditures. The energy supply system provides the energetic inputs required by the economic system. The energy supply explicitly represents vintage capital stocks for more than 50 conventional and low-carbon energy conversion technologies and tracks energy flows from primary through secondary to final energy. The macroeconomic and the energy system modules are hard-linked via final energy demand and costs incurred by the energy system. Energy production and final energy demand are determined by market equilibrium (supplementary note 1).
The representation of buildings energy demand has been considerably strengthened in order to reproduce the energy efficiency dynamics in this sector. In REMIND, energy efficiency results from endogenous decisions to invest into energy end-use capital—e.g. efficient air conditioners or LEDs fixtures—, and thereby to reduce energy consumption and expenditures. The optimal ratio between end-use capital and energy consumption depends on the price of capital, the price of energy as well as the elasticity of substitution between both factors—a parameter characterising the ease of substituting capital intensive technologies for energy intensive technologies. Formally, the trade-off is represented through a constant elasticity of substitution function. The elasticity of substitution plays a central role in determining the response of efficiency improvements to changes in relative prices. We calibrated the elasticities of substitution based on technological data (supplementary note 3). These investment dynamics concern three energy service categories—appliances and lighting, insulation, and space cooling. In addition, the choice of conversion technologies like electric resistances or heat pumps for space heating as well as for water heating and cooking are determined by a multinomial logit on the basis of the capital and operating costs of each technology (supplementary note 5). A relatively cheap net present value will translate into a high market share for a conversion technology.
The model also represents barriers to the economically efficient implementation of energy efficiency measures. Representing these barriers is essential to account for real-world market failures, as well as to enable a meaningful discussion of currently implemented and conceivable future policies to address these barriers. We follow the approach of representing under-investment into efficiency measures in terms of an implicit discount rate, as already established in the scientific literature (Koomey et al 2001, Wilkerson et al 2013, Capros et al 2016). Implicit discount rates are the discount rates that make observed purchasing decisions coherent with decisions taken according to the net present value of alternatives (Hausman 1979, Train 1985, Schleich et al 2016). It is therefore a convenient way to integrate behaviours that do not seem economically rational into models assuming rational agents. As energy efficient technologies have lower operating costs but higher initial capital costs, high discount rates give inefficient technologies a competitive edge over efficient ones. Following this approach, policies alleviating barriers are mimicked in REMIND via their impact on the implicit discount rate.
In REMIND, the macroeconomic discount rate is computed endogenously. To model the implicit discount rate in buildings, we impose a tax on the end-use capital and recycle the tax revenues in a lump-sum fashion. This pro rata tax increases the macroeconomic discount rate additively and results in an end-use specific implicit discount rate. For instance, if the macroeconomic discount rate is 7% and the tax on end-use capital is 10%, the full discount rate on end-use capital will be 17%. Early studies showed large ranges of estimates for implicit discount rates (Hausman 1979, Train 1985, Sanstad et al 1995). More recent studies suggested lower estimates (Cohen et al 2015), which can be explained by improvements in estimation techniques (Houde 2014, Cohen et al 2015), or by the effect of existing information policies (Min et al 2014). We have therefore opted for target implicit discount rates (table 2) that are consistent with the lower bound of early estimates. More information on the buildings module can be found in the supplementary information (notes 2–5).
Table 2. Values for the implicit discount rates. The abbreviation pp stands for percentage points. The endogenous macro-economic discount rate is approximately 7% in equilibrium. Considering this rate, we taxed the efficiency capital by a tax rate which will yield an overall endogenous discount rate for these capital stocks close to implicit discount rates from the literature.
| Increase in the discount rate (tax ratio on the efficiency capital) | Target implicit discount rate (based on an assumption of a 7% endogenous discount rate) | |
|---|---|---|
| Insulation | 5 pp | 12% |
| Space heating | 5 pp | 12% |
| Space cooling | 5 pp | 12% |
| Water heating and cooking | 5 pp | 12% |
| Appliances and Lighting | 20 pp | 27% |
Using an IAM allows investigating buildings energy demand in the global context of the energy system and in a framework consistent with the 1.5°C climate target. But these benefits come at the cost of some limitations regarding the buildings representation in REMIND. First, the module represents buildings energy demand as an aggregate for the whole sector and does not distinguish for instance between residential and commercial buildings, or between urban and rural demand. This aggregation presents the important advantage of reducing the computational requirements of the model, but sub-sectoral dynamics, policies and results cannot be displayed as a consequence. Second, and related to this, the choice of energy carriers is, as in other IAMs (e.g. van Ruijven et al 2010, Eom et al 2012) represented through a multinomial logit function. However, multinomial logit functions are only an imperfect representation for the drivers behind the heterogeneity of the market. As a result the energy carrier choice as a response to changes in prices might not fully represent the technically optimal solution. Nevertheless, these limitations do not affect the main results from this study, which remain general in scope.
2.3. Scenarios
The scenarios run in this study (table 3) evaluate the impact of two types of policies. First, a standard carbon pricing policy is implemented in order to rein in global warming below 1.5°C ('1.5°C' scenario). The carbon price is adjusted so that the global emissions remain within the limits of a 1.5°C carbon budget as presented in the IPCC Special Report on the Global Warming of 1.5°C (Rogelj et al 2018). Carbon pricing is the central tool for achieving climate targets as it would allow—barring other market failures—to identify the most economical solutions. Carbon pricing encourages higher energy efficiency by raising the cost of energy. But it does not address market failures pertaining to energy efficiency such as the split incentives between landlords and tenants or the lack of information on the energy consumption of appliances. We therefore design a second scenario ('EG') which represents the impact of lifting efficiency barriers on energy efficiency investments. While we do not model explicit efficiency policies (e.g. information policies), we model the impact such policies could have in terms of reductions in the implicit discount rate of various end-uses and technologies. In real-world conditions, these policies are extremely varied as they address very diverse barriers: policies targeting market failures (e.g. rental contracts allowing landlords to raise rents following an efficiency investment, or labelling programs), policies based on building standards which are a popular mean of raising energy efficiency but do not necessarily follow economic optimality principles, feedback campaigns (Allcott and Rogers 2014, Asensio and Delmas 2015), etc. In addition to these two first scenarios, we run a third scenario ('1.5°C-EG') which combines the assumptions from the '1.5°C' and 'EG' scenarios. Finally, the 'Baseline' scenario serves as a counter-factual to assess the impact of the various policies. The 'Baseline' scenario, on which all others are based, follows the SSP2—Middle of the Road—economic and demographic projections (Dellink et al 2017, KC and Lutz 2017, O'Neill et al 2017), which project a global population of more than 9 billion people in 2050 and a growth in global income per capita from US$2005 11 500 in 2015 to US$2005 25 000 in 2050.
Table 3. Description of scenarios.
| Scenario | Description |
|---|---|
| Baseline | Continuation of historical trends without climate or efficiency policies along the lines of the SSP2—Middle of the Road—scenario from the Shared Socio-economic Pathways framework (O'Neill et al 2017, Dellink et al 2017, KC and Lutz 2017). Global buildings energy keeps rising as a response to higher income levels and population dynamics, most notably in developing countries. Implicit discount rates range from 12% for heating and cooling to 27% for appliances and lighting. The baseline energy demand trajectories are calibrated to the results from the buildings-specific model EDGE (Levesque et al 2018) which displays a greater level of sectoral detail. |
| 1.5°C | After 2020, a global carbon price is implemented and rises continuously so as to keep the 2018–2100 carbon budget below 320 Gt CO2eq. This budget corresponds to a 1.5°C budget of 420 Gt CO2eq (Rogelj et al 2018), to which we withdraw 100 Gt CO2eq to account for potential Earth system feedbacks (e.g. the permafrost thawing). The carbon price starts at 100$/tCO2 in 2025 and increases at 5% yr−1 to reach 380$/tCO2 in 2050. Implicit discount rates are kept to the baseline levels. The energy service demand in buildings is kept at the level of the baseline. |
| EG—efficiency gap | After 2020, dedicated policies address the various market failures and behavioural barriers pervading in energy efficiency, thereby reducing all discount rates for buildings-related investments to equal the endogenous macroeconomic discount rate at about 7%. The energy service demand in buildings is kept at the level of the baseline. |
| 1.5°C-EG | Policies address both the climate change issue and the energy efficiency gap in an effort to improve people's welfare while keeping global warming below 1.5°C. Assumptions from the '1.5°C' and 'EG' scenarios are combined. The energy service demand in buildings is kept at the level of the baseline. |
Both the climate policy and the reduction of efficiency market failures are extremely ambitious in the model. For instance, the global carbon price starts at 100$/tCO2eq in 2025 and the 'EG' scenario assumes that all barriers will be lifted by 2025. The goal of these scenarios, and the stylized policies in place, is to depict a world that would be on track with the 1.5°C target and undertake all necessary policies in order to achieve this goal at the lowest possible cost, including through the removal of efficiency barriers.
3. Results
3.1. Development of buildings energy demand
The scenarios clearly show (figure 1(a)) that lifting efficiency barriers has an impact on final energy demand that is of similar scale to carbon pricing policies. The combined effect of carbon pricing and reduced efficiency barriers ('1.5°C-EG') reaches 31% of demand reduction by 2050 in comparison to the 'Baseline'. While scenarios with no or single-focus policies show an increase in energy demand until mid-century, the '1.5°C-EG' scenario is the only one to curb energy demand to its 2015 level by 2050 (−3%). By contrast, the demand increases by 41% until 2050 in the 'Baseline' scenario and by 16%–21% in the single-focus policy scenarios. In the short term, the impact of carbon pricing on energy demand is particularly important as the energy supply has had no time to complete its decarbonisation. As a response to the introduction of carbon prices, final energy prices increase by 26%–58% in 2025 compared to the baseline. In the 'EG' scenario on the other hand, prices drop by 27% (supplementary note 10).
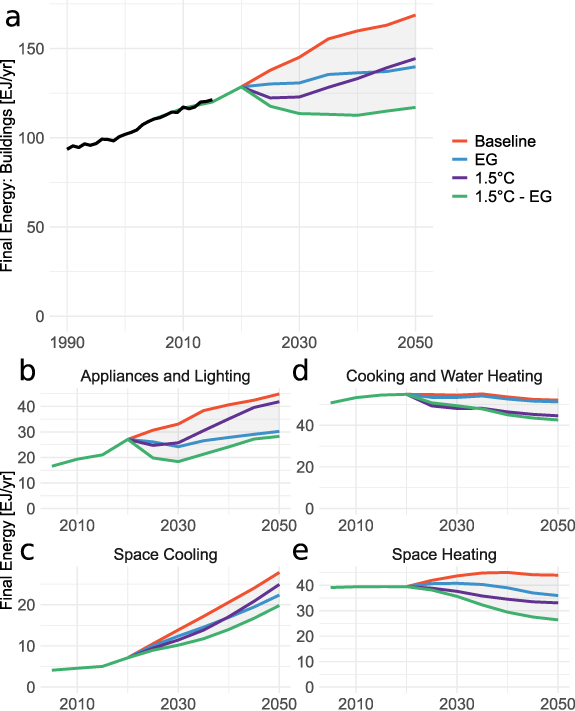
Figure 1. Final energy demand projections at the global level for the aggregate buildings energy demand (a) as well as for the four categories of end-uses represented in REMIND (b)–(e).
Download figure:
Standard image High-resolution imageThe reaction to policies varies strongly across end-uses. Space heating and space cooling are the most sensitive end-uses. They are affected by both improvements in the building shell and by efficiency gains in technologies converting final into useful energy (air conditioners, boilers, etc). The compound effect of buildings envelope upgrades and conversion efficiency improvements yields stark decreases in the demand for these end-uses (−29% for space cooling and −40% for space heating by 2050 compared to the baseline). The other end-use to strongly react to policies is appliances and lighting (−37% by 2050). However, unlike space heating and cooling, this drop is predominantly led by efficiency policies. The 'EG' scenario translates into a decrease of 33% against 6% if only carbon pricing is implemented. The reasons behind this are, one the one hand, the assumed stronger market inefficiencies in the demand for appliances and lighting technologies, and on the other hand, the lower effect of climate policies on the long-term price of electricity, which is the main energy carrier used for appliances. Cooking and water heating have the least possibilities to reduce energy demand in the model and therefore show the least reductions (−18% in '1.5°C-EG'). In particular, the energy efficiency policies do not address the large-scale use of traditional biomass, which is energetically inefficient. The recourse to inefficient traditional biomass in REMIND is driven more by income than by energy prices and discount rates. Reducing the use of inefficient traditional biomass for more efficient modern fuels would therefore necessitate policies affecting income rather than policies addressing market failures in the efficiency markets as in the 'EG' scenario.
In order to locate the degree of ambition of the '1.5°C-EG' scenario in terms of energy demand reductions, we compare it with scenarios from the 1.5°C scenario database (Huppmann et al 2018). These scenarios underpin the IPCC Special Report on a Global warming of 1.5°C (Rogelj et al 2018) and reflect the latest improvements of IAM scenarios. We here select 1.5°C scenarios which had a reference scenario to be compared with (figure 2). We also added the 'Beyond Two Degrees' scenario from the IEA Energy Technology Perspectives (International Energy Agency 2017). Our '1.5°C-EG' scenario clearly belongs to the most ambitious scenarios available in the database. We can also notice that the current REMIND version with the detailed buildings sector shows more ambition than previous versions (Luderer et al 2018). Supplementary note 8 compares the results with non-IAM scenarios from the literature and confirms the impression that the '1.5°C-EG' is ambitious in terms of energy demand reductions, while not being the most optimistic.
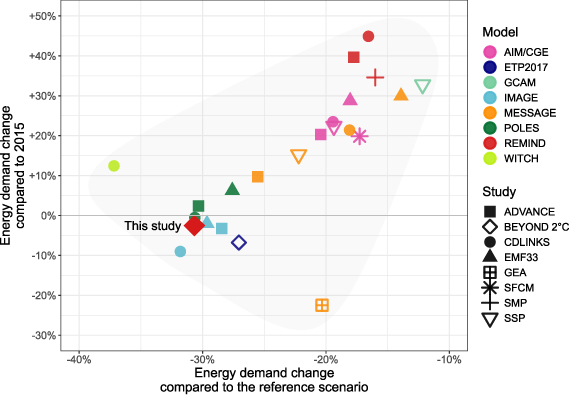
Figure 2. Comparison of buildings final energy demand for 2050 in the '1.5°C-EG' scenario from this study and from scenarios in the 1.5°C scenario database underlying the Special Report on Global Warming of 1.5°C (Rogelj et al 2018). For scenarios where the 2015 data point was not available, we interpolated with the 2010 and 2020 values. For the ETP scenario, we took the 2014 value. GEA: Global Energy Assessment. SSP: Shared Socio-economic Pathways. ADVANCE, CDLINKS, EMF33 are IAM-intercomparison projects. See supplementary note 13 for further details on the literature references behind the scenarios displayed.
Download figure:
Standard image High-resolution imageBeyond the change in the level of global energy demand, the scenarios project important changes in the regional structure of the demand (figures 3 and 4). While the demand in the Global North is projected to slightly increase or decline, in the Global South, the demand is projected to increase even under the most ambitious policy scenario (+27% compared to 2015). In the Global South, the demand for end-uses like space cooling or appliances and lighting, which run primarily on electricity, will represent a greater share of the demand than in the Global North. Consequently, the share of electricity in the Global South is expected to be larger than in the Global North (65%–82% compared to 42%–61% by 2050, respectively).
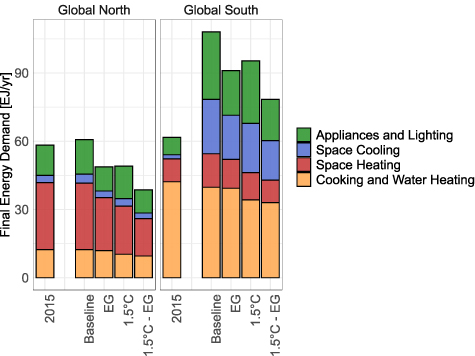
Figure 3. Final energy demand in the Global North and South regions, in 2015 and 2050, disaggregated by end-use.
Download figure:
Standard image High-resolution image
Figure 4. Final energy demand in the Global North and South regions, in 2015 and 2050, disaggregated by energy carrier.
Download figure:
Standard image High-resolution image3.2. Contributions of demand and supply to the decarbonisation of buildings energy demand
Following equation (3), figure 5 shows the decomposition of changes in emissions induced by buildings energy services across the four strategies identified above: reductions in the level of useful energy, improvements in the useful to final energy conversion, switch towards low-carbon energy carriers and decarbonisation of energy carriers. Figure 5(a) clearly shows that the large growth in useful energy of 160% in the 'Baseline' scenario between 2015 and 2050, which reflects the improvement of living standards, exerts an important pressure on emissions (+127%) which is largely compensated by the progress in efficiency (−85%). Overall however, emissions increase by 54%. When only efficiency barriers are lifted (figure 5(a), 'EG'), improved efficiency almost entirely compensates for the impact of useful energy demand growth that would otherwise double emissions. The influence of supply-side factors is much lower than that of demand side factors on the change in emissions in the 'Baseline' and 'EG' scenarios between 2015 and 2050.

Figure 5. Decomposition of direct and indirect emissions from buildings energy demand between 2015 and 2050 (a) for the 'Baseline' and 'EG' scenarios (see supplementary note 11 for the decomposition of other scenarios), between the 'Baseline' scenario and other scenarios at the global level (b), and between the 'Baseline' scenario and the '1.5°C-EG' scenario for the Global North and South regions. Negative emissions from carbon capture and storage have been excluded from the accounting. The percentage values refer to the grey bars.
Download figure:
Standard image High-resolution imageThe opposite is true when considering the change in 2050 emissions between the 'Baseline' and 1.5°C scenarios (figure 5(b)). Demand side factors account at most for a decline in emissions of 18%, while measures decreasing the carbon content of energy contribute as much as a 74% decline in buildings emissions in the '1.5°C-EG' scenario. That is, in this scenario, reducing the carbon content of energy contributes a share of 81% of the total 91% reduction in emissions. According to the decomposition, the 31% reduction of final energy demand in '1.5°C-EG' compared to 'Baseline' translates into a 19% contribution to emission reductions. As the scenario 'EG', which only removes market failures in efficiency markets, does not envisage any policy targeted at CO2 emissions, fuel switching and supply decarbonisation do not contribute at all to the decline in emissions in this scenario. Accordingly, the achieved emission reductions correspond to the level of energy demand reductions (−16% and −17%, respectively). A strategy that exclusively consists in removing barriers to energy efficiency is thus very unlikely to achieve emission reductions sufficient for the Paris climate targets.
Interestingly, despite the differences in the composition of demand in the Global North and Global South regions, carbon content reductions remain the primary driver of decarbonisation in both cases (figure 5(c)). Carbon content reductions contribute 74% of the decarbonisation in the Global North and 84% in the Global South. As the demand in the Global South is provided by a larger share of electricity, it is clear that the role of supply-side decarbonisation is more important than in the Global North where fossil fuels play a more important role. Conversely, in the Global North, demand reductions lead to a larger proportional emission decrease than in the Global South (23% against 15%). Overall however, despite the fact that emissions in the Global South are almost twice as important as in the Global North in the 'Baseline', in the '1.5°C-EG' scenario, they drop below the level of the Global North.
Looking into the details of the individual factors of equation (1) at the global level (figure 6), we observe that while the reduction in useful energy demand is limited to 10% and the reduction in energy intensity to 23%—leading to an aggregated drop in final energy demand of 31%—, the drop in the emission intensity factor reaches almost 90% in the '1.5°C' and '1.5°C-EG' scenarios. Several energy carriers can almost fully decarbonise (figure 7): electricity and district heating. Residual emissions therefore stem to a large extent from the remaining demand for gases, whose share is still 11% in the '1.5°C-EG' scenario (figure 8). By 2050, the share of electricity is already above 60% in the 'Baseline' and rises to 75% in the most ambitious scenario. Accordingly, 74% of all 2050 buildings emissions stem from electricity in the 'Baseline' (supplementary note 9), making the decarbonisation of electricity a fundamental requirement to reducing buildings sector emissions.

Figure 6. Changes across scenarios in the individual factors explaining the decline in buildings emissions (equation (1)). Final to useful energy intensity is below one mostly because of air conditioners and heat pumps whose intensity can decrease below one, and to some extent to the treatment of appliances efficiency improvements (supplementary note 7).
Download figure:
Standard image High-resolution image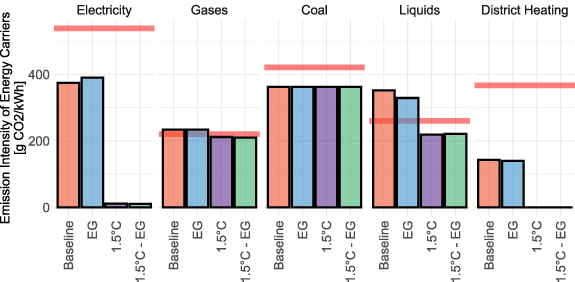
Figure 7. Emission intensity of energy carriers in buildings by 2050. The red line shows the emission intensity in 2015. The increase of the emission intensity for liquids in 'Baseline' and 'EG' are due to a gradual adoption of coal-to-liquids (supplementary note 12). The emission intensity of biomass is assumed to be zero in the energy system (land-use change emissions are not taken into account on the energy side), and is therefore not shown.
Download figure:
Standard image High-resolution image
Figure 8. Shares of buildings energy carriers in 2015 and 2050.
Download figure:
Standard image High-resolution image
4. Discussion
The main insight from our study is that the decarbonisation of buildings energy demand is prominently driven by the reduction of the carbon content of energy and to a lesser, but significant, extent by the reduction of energy demand. Importantly and despite the fact that our scenario counts among the most ambitious 1.5°C IAM scenarios in terms of energy demand reductions, the reduction of the carbon content of energy accounts for 81% of the emission reductions in the sector compared to a baseline scenario without policy intervention. The remainder is explained by energy demand reductions. These results hold for both the Global North and Global South regions. Because the share of non-electric fuels in the Global North is larger than in the Global South, the contribution of energy demand reductions is slightly larger, but carbon content reductions still account for 74% of the decarbonisation.
In response to carbon pricing, some energy carriers like electricity or district heating can almost entirely decarbonise. The strategy consisting in switching energy carriers towards low-carbon sources shows thereby a high leverage to decrease emissions. To illustrate, holding everything else equal, a decrease in energy demand by one further per cent in the '1.5°C-EG' scenario would decrease emissions by only 12 MtCO2 yr−1 (24 MtCO2 yr−1 if all the decrease happens in space heating), because more than half of the saved energy would already be emission-free. By contrast, raising the share of electricity or district heating by one percentage point at the expense of gas would decrease emissions by 65 MtCO2 yr−1 in '1.5°C-EG', as it would reduce gas demand, which is responsible for 62% of residual emissions (supplementary note 9), by 10%. The success of electrification and fuel switching to decarbonise buildings energy demand however crucially depends on the ability of the energy supply sector to decarbonise electricity and other energy forms like heat from district heating networks.
Nevertheless, energy demand reductions remain an important element of climate strategies: our scenarios show that the alleviation of market failures pertaining to efficiency markets raises the opportunities to decrease energy demand cost-effectively, and reduce the impact of carbon pricing on energy prices (supplementary note 10). In addition, efficiency improvements greatly moderate emission increases in the baseline, and strongly reduce the demand for decarbonised energy carriers in the '1.5°C-EG', thus limiting the externalities in form of land and resource use (Luderer et al 2019). Furthermore, energy efficiency is related to other co-benefits like positive health impacts (Thema et al 2019). But energy demand reductions, beyond their direct impact on emissions, are also important in their interactions with the other strategies to decrease emissions, especially electrification and fuel switching. For instance, by improving the insulation of buildings envelopes, and for a constant indoor temperature, the temperature of radiators can be reduced and the efficiency of heat pumps increased (Hesaraki et al 2015), further enabling the penetration of heat pumps. Higher energy efficiency also impacts the economics of district heating or the peak demand of electricity (Vaishnav and Fatimah 2020). It should be noted, however, that the representation of the interactions and synergies between energy efficiency and fuel switching remains limited in large-scale models, and thus is an important domain for future research.
These results are in line with findings from the literature which rely on a more detailed representation of buildings: Langevin et al (2019), as well as Goldstein et al (2020), estimate that U.S. building CO2 emissions could be decreased by 78% below 2005 levels by 2050. In the scenarios from Langevin et al (2019), the decarbonisation of the supply sector accounts for the vast majority of the buildings' decarbonisation, despite the fact that the share of renewables reaches only 45% in the electricity mix. The reduction of primary (not final) energy demand reaches 35% below 2005 levels, which is coherent with the reductions in final energy demand in the Global North in this study. With a historical perspective, Sandberg et al (2011) also show the importance of supply-side transformation and fuel switching for the decarbonisation of the Norwegian buildings sector. Despite a growth in energy demand per capita of 55% between 1960 and 2004, buildings emissions per capita were halved over the period. The authors attribute this strong reduction to the electrification of the sector, in a country where most of the electricity is produced with hydropower.
Though significant, the reductions in energy demand presented in this study fall short of those showed in the most ambitious low-energy demand scenarios published recently (Grubler et al 2018, Levesque et al 2019). The difference is striking when comparing the scenario results with the historical energy demand. Compared with 2015, the scenario with the highest demand ambition presented in this study displays only a 3% decrease of demand by 2050. In Grubler et al (2018) by contrast, buildings energy demand falls by 46% compared to historical values. The gap between these results derives primarily from the different perspectives adopted to address the topic of energy demand. Here, we were concerned with the optimal economic response to both efficiency market failures and climate change. These very ambitious scenarios rely instead on deep shifts in technologies, social norms, cultures, and tastes for which the political tools remain to a large extent unexplored.
Similarly, some scenarios based on technological improvements also show greater energy demand reductions than in our study. Ürge-Vorsatz et al (2012) for instance project a global decrease in the demand for space heating, cooling and water heating of 29% in 2050 compared to 2005 in their most ambitious scenario. Bürger et al (2019) show decarbonisation scenarios for the German buildings sector which cover a wide range of final energy reductions 4 : from 20% to 60% compared to 2008. While these scenarios are more ambitious than the one presented here in terms of energy demand reductions, they tend to prove the technical feasibility of our scenarios.
This paper follows recent efforts to improve the representation of demand-side policies in IAMs to include policies and barriers that go beyond carbon pricing (McCollum et al 2018). The improvements in the modelling and policy representation however come with some limitations. To depict the energy efficiency market failures and behavioural barriers, we applied the concept of implicit discount rates. The latter is, however, only an imperfect approximation for a variety of drivers explaining the divergence between observed and seemingly optimal behaviours. In addition, we deliberately kept consumers' service demand constant across scenarios. Only the choice of technology options to fulfil this demand was left to the model. This, however, forgoes two important effects. The service demand might decrease in response to carbon pricing, because the latter increases the costs of energy services. On the other hand, the service demand might increase in response to energy efficiency policies, because the higher efficiency reduces the costs of energy services—the rebound effect. Our choice to fix the energy service demand probably overestimates the reaction to energy efficiency policies and underestimates the reduction of demand following carbon pricing.
5. Conclusion
The decarbonisation of buildings will be driven by both energy demand reductions and reductions in the carbon content of that consumed energy. This study makes clear how important the reduction of the carbon content of energy is for the decarbonisation of buildings energy demand. We find that 81% of the reductions in buildings emissions stem from the strategy reducing the carbon content of energy, i.e. from a decline in the emission intensity of energy carriers combined with fuel switching in favour of decarbonised energy carriers. These results apply to both the Global North and Global South regions, despite different structures in end-uses and energy carriers. Nevertheless policies removing barriers to energy efficiency are important as they allow tapping into a cost-effective potential.
Our results point to the important leverage that a successful decarbonisation of the energy supply-side offers to decarbonise buildings. Future research will further detail to which extent the use of hydrocarbon fuels in buildings can be reduced through the recourse to decarbonised electricity, district heating, cooling and on-site renewables (e.g. Paardekooper et al 2018). Complementary to the research agenda investigating deep reductions in energy consumption (Creutzig et al 2018, Grubler et al 2018) and low-energy buildings (Cabeza and Chàfer 2020, Mata et al 2020, Ürge-Vorsatz et al 2020), further research on the potential for electrification and fuel switching could also help reducing the reliance on controversial negative emissions technologies. In addition, energy efficiency plays the role of an enabler for the reduction of the carbon content of energy, a dynamics we did not reflect here and that would deserve further investigation in large-scale scenarios.
Acknowledgments
This work was supported by the European Union's Horizon 2020 research and innovation programme under Grant Agreements Nos. 730403 (INNOPATHS) and 821124 (NAVIGATE).
Code availability
The code of the energy–economy–climate model REMIND can be accessed at github.com/remindmodel/remind (in particular modules/36_buildings/services_putty). The scenarios displayed in this study use a slightly adapted model version.
Data availability statement
The data that support the findings of this study are available upon reasonable request from the authors.
Authors' contributions
AL, RCP and GL designed the research. AL performed the modelling with support of LB. AL wrote the manuscript with contributions from all authors.
Footnotes
- 3
Further below, we aggregate these regions into two groups: the Global North (EU (27 + 1), Japan, USA, Non-EU Europe, countries from the former Soviet Union, Canada-New Zealand-Australia) and the Global South (China, India, Latin America, Sub-Saharan Africa, Other Asian countries, Middle East-North Africa).
- 4
Unlike in our study however, the authors include ambient heat used by heat pumps into their final energy accounting. The energy demand reductions would therefore be much higher if using an accounting similar to ours.