

Abstract
Decision makers increasingly recognise the importance of lifestyle changes in reaching low emission targets. How the mitigation potential of changes in mobility, dietary, housing or consumption behaviour compare to those of ambitious technological changes in terms of decarbonisation remains a key question. To evaluate the interplay of behaviour and technological changes, we make use of the European Calculator model and show that changes in behaviour may contribute more than 20% of the overall greenhouse gas (GHG) emission reductions required for net-zero by 2050. Behaviour and technology-oriented scenarios are tested individually and in combination for the EU plus the UK and Switzerland. The impacts of behavioural change vary across sectors, with significant GHG emission reduction potential and broader benefits. Changes in travel behaviour limit the rising demand for electricity, natural resources and infrastructure costs from the electrification of passenger transport. Adopting a healthy diet reduces emissions substantially compared to intensifying agricultural practices, while at the same time making cropland available for conservation or bioenergy crops. The trade-offs between energy and food may be substantially alleviated when deploying technological and behavioural changes simultaneously. The results suggest that without behavioural change, the dependency of Europe on carbon removal technologies for its net-zero ambitions increases. Structural changes will be necessary to achieve full decarbonisation by 2050, yet changes in lifestyles are crucial, contributing to achieving climate targets sooner.
Export citation and abstract BibTeX RIS

Original content from this work may be used under the terms of the Creative Commons Attribution 4.0 license. Any further distribution of this work must maintain attribution to the author(s) and the title of the work, journal citation and DOI.
1. Introduction
Policy makers increasingly recognise that achieving low-carbon pathways requires some degree of societal change in addition to technological and policy measures (European Commission 2018a). Such societal changes are often framed under the term sustainable lifestyles (Evans and Abrahamse 2009). However, the literature has focused on providing comprehensive economic, policy and technology instruments for decarbonisation (Luderer et al 2013, Edenhofer et al 2014, Grubler et al 2018). Yet, the profile of demand-based solutions for mitigation is now sharpening (Creutzig et al 2018), and the role of lifestyle changes is moving from the fringes of the climate debate to occupy a more central role. Underpinning this shift is emerging research on the abatement potential of lifestyle-related changes in mobility, housing, diet and overall consumption (Springmann et al 2016, van de Ven et al 2018, Vita et al 2019, Ivanova et al 2020). While the mitigation potential from lifestyle changes has been reported to be broadly complementary to that brought by efficient and clean technologies (van Sluisveld et al 2016), a multi-sectoral investigation of the interlinkages between infrastructure, technologyand behavioural changes remain underexplored, especially in the context of rapid technological advances.
In this article, the authors report the abatement potential of lifestyle changes throughout the production, consumption, energy and land systems by investigating behavioural and technological changes both independently and simultaneously. Lifestyles can be defined as 'clusters of habits and patterns of behaviour embedded in a society and facilitated by institutions, norms and infrastructures that frame individual choice' (Akenji and Chen 2016). Accordingly, changes in lifestyles are often an umbrella term for changes in both individual behaviour and related changes in technology and infrastructure. The boundary between what constitutes changes in behaviour and technology can be blurry as the latter influences many of the former, such as automobility. As explained recently by Saujot et al (2020) quantifying the impacts of lifestyle changes alone in mitigation pathways is no simple tasks. The authors innovate by accounting specifically for behavioural and/or technological changes, and integrating lifestyles from the very beginning of the modelling exercise.
To evaluate this interplay between behavioural and technological changes, the European Calculator (EUCalc 9 ) was used. The model runs at an intermediate level of complexity to facilitate the evaluation of trade-offs and synergies arising from changes in multiple sectors (e.g. buildings, transport, agriculture, etc). Moreover, the model accounts for individual behaviour choices with varying levels of ambition, across 15 energy-relevant decisions including activities, goods and services (e.g. living space, distance travelled, diet and food waste). The impacts of changes in any sector or activity are evaluated in socio-economic, emissions, land and resources terms. Simultaneously, multiple pathways in the adoption of over 50 sectoral technologies and changes in energy supply (e.g. increasing shares of district heating, changing nuclear capacity) can be selected. As a result, the EUCalc allows the investigation of behavioural and technological changes independently and in combination to isolate the persistent effect of lifestyle changes in greenhouse gas (GHG) emission reductions. In addition, the model's user interface—the transition pathways explorer (TPE) (http://tool.european-calculator.eu)—allows users to visualise the GHG emissions, energy and resources consumption, as well as socio-economic impacts associated with individual actions. This also provides critical insights for policy and decision makers to steer structural changes, which enable and incentivise behavioural choices towards climate mitigation.
Making use of the versatility of the EUCalc model, three scenarios are simulated, with varying intensities of behavioural and technological changes. The authors then compare the sectoral GHG emissions due to behavioural or technological changes, before discussing how lifestyles changes can specifically contribute to reaching the EU's net-zero target.
2. Methods
The EUCalc models energy, resources, production and food systems at the European Union (EU) and Member-State (MS) levels plus UK and Switzerland (EU27 + 2). It runs on a yearly time span, but the outputs are computed using 5 year time steps between 2020 and 2050 to reduce computation time. The modelling approach was inspired by the family of so-called 2050 Calculators which were spearheaded by the call for more transparent approaches to address the challenge of reducing carbon emissions (MacKay 2009, Wright 2016). Calculators have been used in global and country-level assessments of decarbonisation potentials (Strapasson et al 2017, Berger et al 2020) and to capture public preferences for energy pathways (Demski et al 2017). A key defining feature of the Calculators is the use of so-called levers, representing potential changes towards decarbonisation across sectors, each of which can be set at different level of ambition. These levers and levels prescribe the model with 2020–2050 trajectories for both behavioural (e.g. time spent using a computer or dietary choices) and technologies (e.g. the fuel mix in passenger transport or the intensification of agricultural production), see full list of levers in table 3 of the SI (available online at stacks.iop.org/ERL/16/044057/mmedia). Levels range on a continuous scale from 1 to 4 where level 1 is typically equivalent to the continuation of past trends and level 4 represents the transformation of societal norms and preferences and/or the deployment of disruptive technologies that reduce carbon emissions and energy consumption (see table 1 for a set of examples and SI section 1.2 for details on lever and level definition). The resulting trajectories of activities, technologies or practices are inputs to the model from which the associated energy, emissions and resources are calculated.
Table 1. Summary specifications of the scenarios investigated and relevant assumptions and average key indicators in the EU27 + 2 by 2050. Full scenario settings can be accessed via the EUCalc's web interface—the transition pathways explorer (TPE).
| Life | Tech | Tango | ||
|---|---|---|---|---|
| Individual behaviour set to level 4 and technology deployment to LTS-Baseline. | Technology and fuels are set to level 4 and individual behaviour to LTS-Baseline. | Both individual behaviour and technology levers set to maximum ambition | ||
| Behaviour | Passenger distance | 11 520 pkm cap−1 yr−1 | 15120 pkm cap−1 yr−1a | |
| Computer | 1.3/household | 2.5/household a | ||
| Cooled living space | 10.6% | 21.8% a | ||
| Meat in diet | 81 kcal cap−1 d−1 | 276 kcal cap−1 d−1a | ||
| Technology | Zero-emission vehicles | 46% of new car sales a | 100% of new car sales | |
| Appliances efficiency | 65% improvement a | 89% improvement | ||
| Renovation rate | 1.3% yr−1a | 3% yr−1 | ||
| Material switch | Concrete by timber in buildings 10% a | Concrete by timber in buildings 60% | ||
| Energy and Carbon Capture and Storage (CCS) | No CCS and nuclear power capped at LTS Baseline level | CCS deployed and nuclear power further increases | ||
| CC in energy | 0% a | 80% | ||
| CC in steel | 0% a | 40% | ||
| Nuclear capacity | 90 GW a | 100 GW | ||
| Renewable energy balanced to meet specific demand. | ||||
| Power oversupply capped at <50% of the annual storage capacity | ||||
| Resources and land | Agriculture systems adopt agroecology standards | Agriculture systems are further intensified | Same as the Life scenario | |
| Synthetic fertilizer use | 0 kg ha−1 | 200 kg ha−1 | ||
| Animal based products wastes and losses | 0.9% | 5.2% | ||
| Freed land to forest | 100% | 0% | ||
| Other | Population, urbanisation and EU trade are kept roughly at LTS-Baseline levels | |||
| Population | 538.4 millions a | |||
| Urban population | 75.7% a | |||
| Product manufacturing | 12% net import/demand ratio a | |||
| Lever settings in the TPE b | Link | Link | Link | |
a Best match of inputs in the EUCalc to those of the LTS-Baseline (see also section 2.1 of the SI). The reader can observe how different the Life, Tech and Tango are from the LTS Baseline by comparing the values in the same row. b The parametrisation for the Life, Tech and Tango scenarios (as well as the LTS-Baseline) can be obtained from the drop-down menu in the EUCalc's web-interface: http://tool.european-calculator.eu.
Levels of ambition can be associated with the outcomes of particular sectoral policies at EU or MS level. For example, the lever 'building envelope' (table 3 of the SI) can be related to the directive on the energy performance of buildings, which sets the minimum requirements for buildings and building components that are subject to major renovation (European Parliament 2010). Levers serve as inputs to the modules in figure 1. This includes the installed capacity of renewable energy, as well as the energy consumption mix in buildings, transport and manufacturing sectors, which other models generate endogenously in response to energy demand, investment, carbon market price and technological change (Bauer et al 2016, Krey et al 2019). We emphasise therefore that the EUCalc is driven by exogenous lever inputs that do not affect or contradict other model parameters.
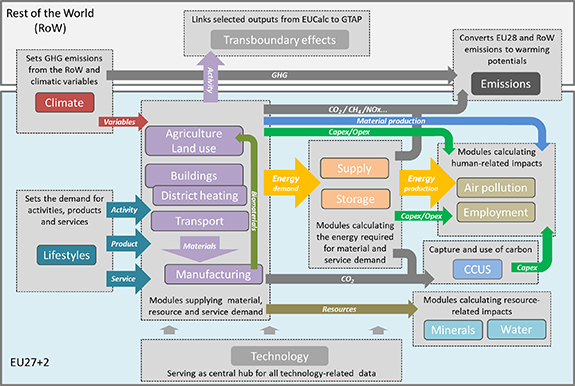
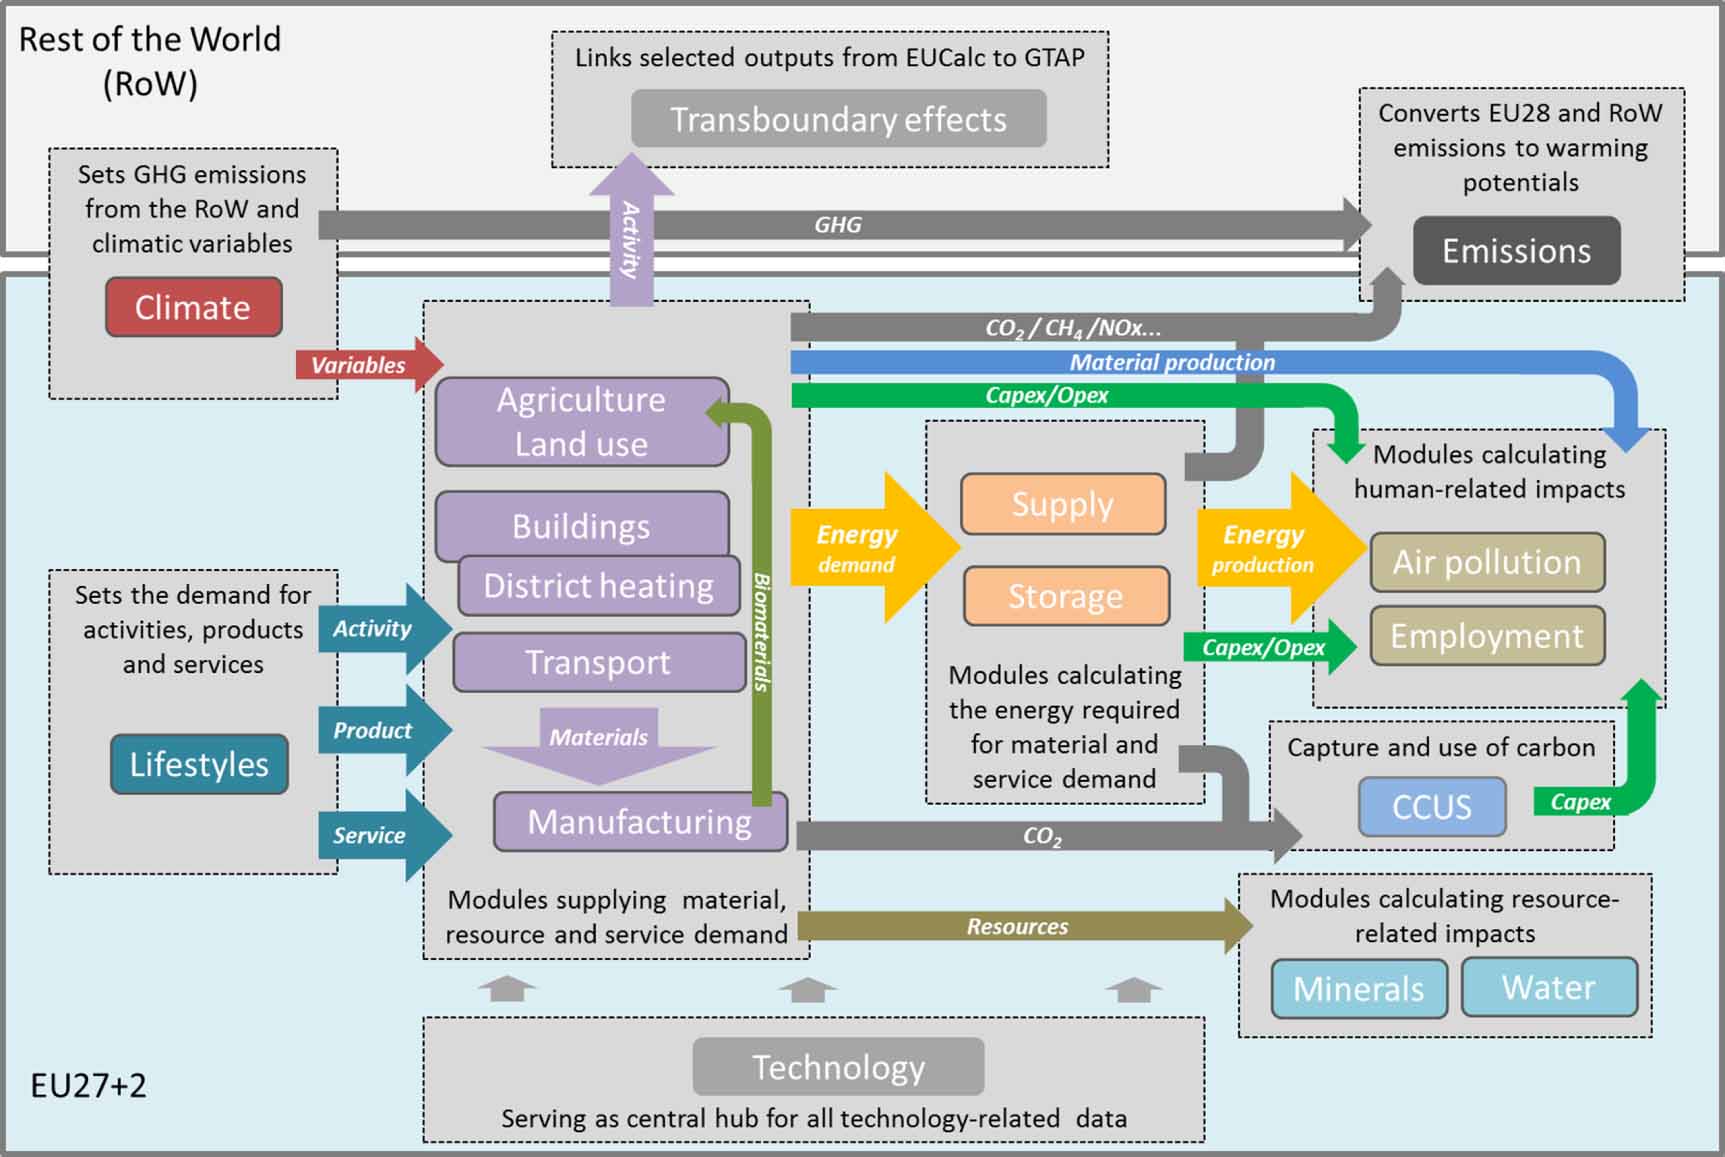
Figure 1. Main flows of energy, materials and emissions and sectoral connections in the EUCalc model.
Download figure:
Standard image High-resolution image2.1. Modular structure
As shown in figure 1, the EUCalc consists of 15 inter-dependent modules representing the supply and demand sides of activities, materials, energy and emissions; as well as different interfaces of the energy system with society and the environment. The lifestyle module calls upon the other modules for the supply of activities, goods and services (Costa et al 2020). Emissions from the energy system are converted in global warming potential via the emissions module to derive a consistent climate impact and account for the effects of mitigation actions within the EU27 + 2 (Price et al 2019). The impacts of trade between the EU27 + 2 and the rest of the world (RoW) as well as embodied emissions are modelled with a modified version of GTAP (Global Trade Analysis Project) in the transboundary effects module (Clora and Yu 2020). Intra and extra EU27 + 2 trade dynamics was shown to have a significant impact on emissions, comparable with the territorial emissions of EU Member States (Costa and Moreau 2019). A description of each module, their main outputs and interlinkages is provided in section1.5 of the SI.
2.2. The EUCalc and the abatement potential of behavioural change
In models referencing standard economic theory—such as integrated assessment and general equilibrium models—consumption choices are endogenously determined by income and prices and hence they cannot easily reproduce and evaluate the effects of significant modifications in consumer behaviour conducive to climate change mitigation, because large behavioural changes can only be induced by drastic changes in income and/or prices or through ad hoc modifications of consumer preferences. Accordingly, the abatement potential of particular behaviour changes might remain unknown as they are not easily implemented without resorting to a number of extra assumptions, such as high carbon tax levels that are deemed politically infeasible (Latka et al 2021). Attempts have been made to apply more flexible functional forms and/or to design ad hoc rules for more 'realistic' behaviour changes (Yu et al 2004, Woltjer et al 2014, Ho et al 2020). However, the extent of behavioural changes remains limited by the underlying consumer preferences; in the latter case, ad hoc updates of consumer preferences need to be guided by 'desired' behaviour changes. In the EUCalc model this is a core feature and both behavioural and technological changes can be imposed without being bound by the usual constraints of optimisation models. This gives the model more flexibility to implement and evaluate a wider array of desirable behaviour changes, informing their possible contributions in net-zero pathways for Europe. Such changes are used in the EUCalc model for conducting policy simulations rather than a policy optimisation strategy in order to capture a wider solution space for decarbonisation. Moving from optimisation to simulation has also been followed by others (Lamontagne et al 2019). Such a direct approach can also be reconciled with recent research. For example, social identity was shown to motivate climate action, in addition to factors such as personal benefits and costs (Bamberg et al 2015). The heterogeneity in behaviour remains a challenge for established classes of models in accounting for broader lifestyle changes (van den Berg et al 2019).
The EUCalc introduces varying ambitions for key behavioural changes (simultaneously and individually) derived from a literature review (see complete list of in Costa et al (2020)) and discussed through expert consultations (see SI section 1.2.1). Once the level of behavioural change is defined at the European level it is disaggregated to national values using the concepts of convergence and compression (see section 1.2.2 of the SI). For example, in every country meat consumption decreases linearly to comply with the healthy dietary guidelines reported by the WHO et al (2003) and WCRF (2007) by 2050. In contrast, residential floor area decreases in proportion to each country's 2015 value until the EU27 + 2 reaches the decent standards of 37 m2 cap−1 as suggested in Rao and Min (2018). For countries below this level in 2015 residential floor area is allowed to increase. Changes in behaviour in the EUCalc affect activities including passenger transport demand (Francke and Visser 2015), food demand, residential floor space demand and cooling, appliances demand and use (Bucksch et al 2016), packaging and paper demand (Moran et al 2020), see also additional references in Costa et al (2020). The EUCalc model then tracks the effects in terms of materials energy and emissions throughout a tightly coupled energy system (see figure 1).
2.3. Life, Tech and Tango scenarios
To investigate the contribution of lifestyle changes to Europe's mitigation efforts, three different configurations of the EUCalc model called Life, Tech and Tango are simulated (see table 1). The scenarios explore the potential of ambitious behavioural change; of rapid technological change; and the combined emission abatement of both technological and behavioural change in addition to that reported in the LTS Baseline (European Commission 2018b)—the EU's reference scenario to evaluate current policies on energy and emissions.
In the Life configuration, the ambition levels of individual behaviours are raised from those representing the LTS Baseline (see section 2.1 of the SI) to the maximum level assumed in the EUCalc (see table 12 in the SI for all lever levels). This essentially means smarter and more selective consumption of products and energy services. The ambition levels related to Technology and fuels in the Life scenario correspond to those in the LTS Baseline. Changes in resources and land are made in favour of achieving the maximum feasible agroecology standards in crop and livestock production as well as the sustainable management of forests. In addition, land freed from agricultural production is dedicated to forest while bioenergy capacity is capped at LTS Baseline level.
In the Tech scenario, levers related to individual behaviours are kept at LTS Baseline while those related to Technology and fuels are set to higher ambition levels as found to be technically feasible. For example, the renovation rate of buildings increases to 3% yr−1, the ambition required to renovate the majority of the buildings between today and 2050 (European Commission 2018a), and Zero Emission Vehicle reach 100% of car passenger sales in 2050. The exceptions are levers setting renewable energy capacities in Europe that do not increase substantially beyond the LTS Baseline, otherwise it would lead to an oversupply of electricity due to large gains in efficiency assumed in transport, buildings and manufacturing sectors. Crop and livestock production systems explore all the potential for further intensification.
Lastly, in the Tango scenario, both behavioural and technological changes are combined. In this configuration, behaviour related levers are increased to the maximum ambition levels. The same takes place for resources, land and technology and fuels, while power generation is balanced to avoid oversupply. For all scenarios the settings on demographics and domestic supply dimensions of the EU27 + 2 (see table 1) are kept at the LTS Baseline levels.
Simulating other scenarios to understand the system dynamics in the model is possible through the TPE (http://tool.european-calculator.eu). This web interface to the EUCalc model allows users to swiftly visualise model outputs, highlight inter-sectoral synergies, and explore a broad range of decarbonisation options (Hezel et al 2019). Full scenarios settings used in this paper and results can be accessed via TPE following links provided in table 1.
3. Results
Results from the Life and Tech scenarios show that changes in individual behaviour alone can bring substantial reductions in GHG emissions by 2050 in addition to those of the LTS Baseline, see table 2. This is particularly visible in the agriculture, power and transport sectors. Model outputs supporting this paper are made available at DOI: http://doi.org/10.5281/zenodo.4450345.
Table 2. Additional GHG reductions (without negative emissions) in 2050 to those of the LTS Baseline (in %).
| Sector | Life | Tech |
|---|---|---|
| Agriculture | 53.3 | 6.4 |
| Buildings | 11.8 | 65.6 |
| Manufacturing | 26.7 | 54.7 |
| Power | 82.2 | 89.8 |
| Transport | 48.4 | 76.4 |
| EU27 + 2 | 42.9 | 58.7 |
| (1304 Mt CO2eq) | (943 Mt CO2eq) |
Changes represented in the Life scenario would lead to a 43% reduction in GHG emissions in the EU27 + 2 in 2050 given technological developments foreseen in the LTS Baseline. By 2050, GHG emissions in EU27 + 2 are circa 2280 Mt CO2eq under the EUCalc's reproduction of the LTS Baseline scenario. The sectoral reductions highlight the role of behavioural change vs technology. While GHG savings in the agriculture sector under the Tech scenario are marginal compared to the LTS Baseline, they are substantial in the Life scenario. In transport the additional reductions in the Life scenario are similar in magnitude to those observed for the Tech scenario.
In the case of buildings, the low reductions under the Life scenario shows that technology and fuel assumptions for building under the LTS Baseline are important drivers of emission reductions but also that some of the emission benefits of individual behaviour in homes are reflected in other sectors. For example, smaller living spaces require lower material use which reduces emissions in the manufacturing sector. The implications of the scenarios are discussed for each sector, emphasising the multiple benefits of lifestyles changes.
3.1. The transport sector
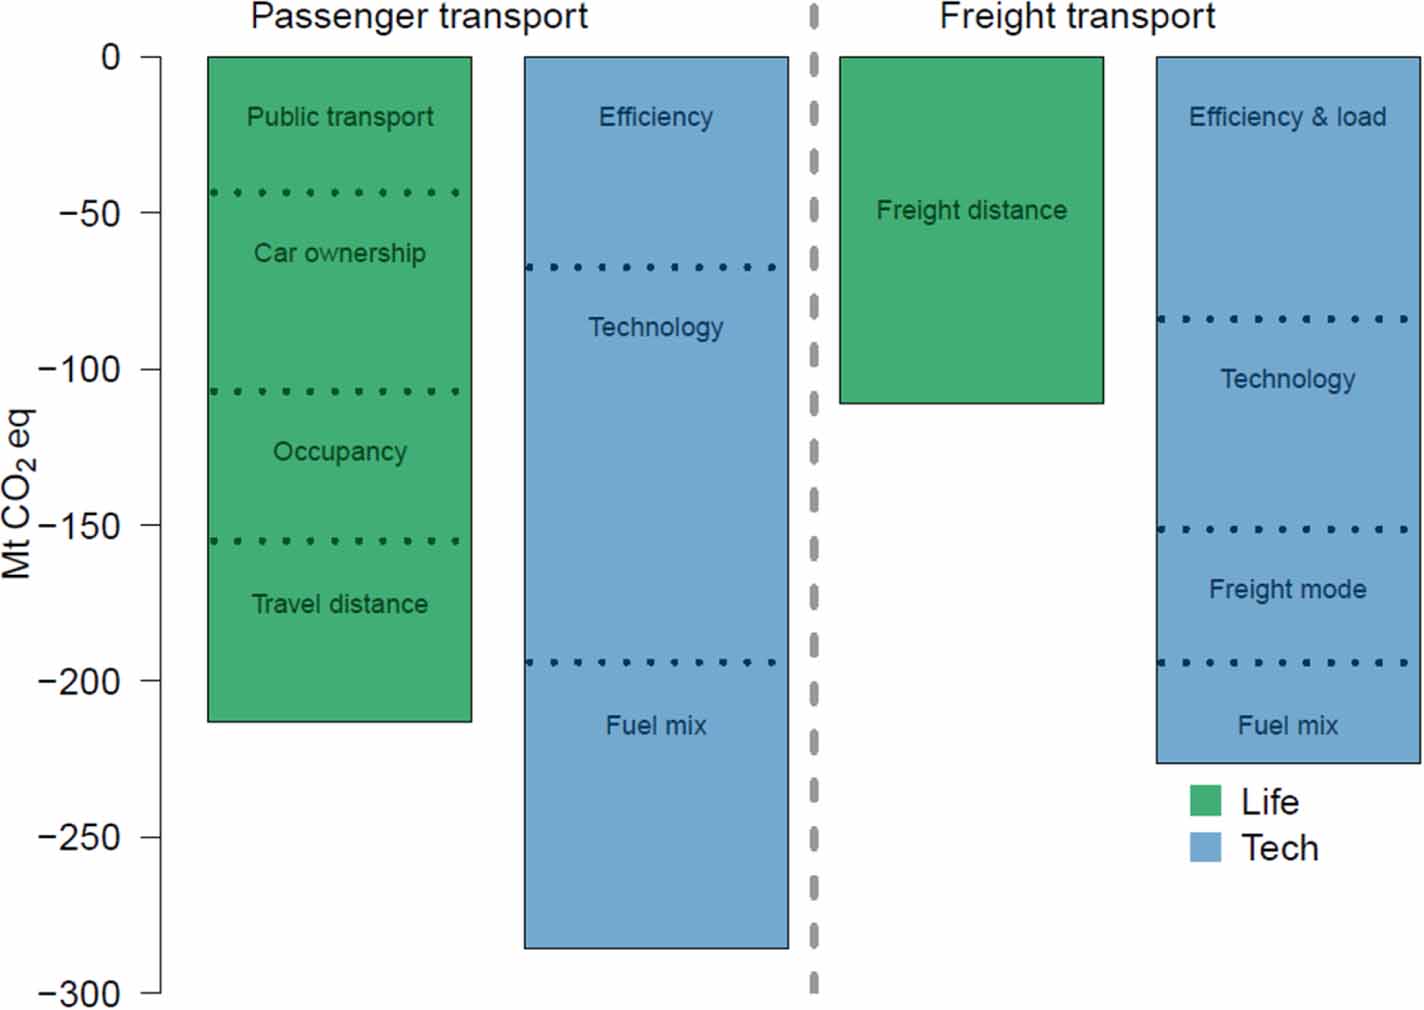
Changes in travel behaviour are expected to result in large emission reductions. The Life scenario leads to GHG emission reductions of circa 220 Mt CO2eq in passenger transport and 110 Mt CO2eq in freight by 2050 (see figure 2). Again, this is with technology levers set according to the LTS Baseline. In comparison, the Tech scenario reduces emissions by circa 280 and 220 Mt CO2eq for passenger and freight transport respectively. By changing an individual behaviour or technology from Life/Tech setting to the LTS Baseline setting (while keeping all the other settings unchanged) the EUCalc allows for a breakdown of abatement potentials, see dashed line in figure 2. Because of the independence of lever trajectories, the full mitigation potential of behavioural changes in transport is the sum of the contributions of the individual levers. What changes is the relative contribution of each lever depending on the order in which the levers are set. This is ultimately a societal choice and multiple combinations are possible, hence the individual shares reported in figure 2 are only an example in which we sequentially assume decreasing passenger distance, followed by lower car ownership, followed by an increased occupancy and finally shifting transportation mode.

Figure 2. Transport GHG emissions reduction in 2050 in the Life and Tech scenarios compared to LTS Baseline. Dashed lines indicate the individual contribution of particular levers.
Download figure:
Standard image High-resolution imageIncreasing the share of public transportation for trains and buses to 18.5% and 17.3% respectively and increasing the occupancy of cars and buses to 2.6 and 27.2 persons/vehicle respectively in the Life scenario (see levers passenger modal and occupancy in Taylor et al (2019)), would result in emission reductions slightly larger than those expected from vehicle efficiency gains in the Tech scenario (where the energy consumption of cars, buses, train and planes decreases respectively by 50%, 30%, 45% and 30%, see Taylor et al (2019)). In the case of freight transport, a 22% reductions of freight demand (in tonne km) due to reduced consumption and sourcing products locally results in GHG savings roughly equivalent to half of those obtained from ambitious technological deployment in the freight transport sector by 2050.
Reducing passenger and freight transport emissions in the Tech scenario, amid rising demand for travel, requires substantial electrification of the transport fleet. This is already the case in the LTS Baseline scenario (see figure 3(A)) with demand from passenger transport peaking at circa 300 TWh in 2050. Given that in the Life scenario vehicle technology is kept at the LTS Baseline, their respective electricity demand curves almost coincide up to 2035 (see also SI section 2.1 Passenger technology lever). In the long run, however, shorter travel distance, higher utilisation and occupancy rates of vehicles curb the demand for electricity to below 180 TWh between 2035 and 2050. Improvements in vehicle efficiency in the Tech scenario (absent in the Life scenario) cannot compensate for the rising electricity demand, driven by longer travel distances and higher shares of zero-emission vehicles (ZEVs). As a result, electricity demand grows to about 460 TWh in 2050.
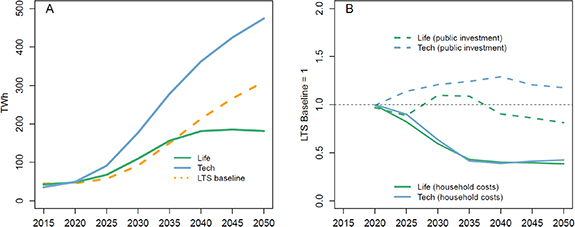
Figure 3. Electricity demand (A) and investments (B) in passenger transport for the evaluated scenarios.
Download figure:
Standard image High-resolution imageFigure 3(B) shows the associated, non-discounted, household costs (vehicle and fuel purchases) and public investment (buses, trains and infrastructure). For both scenarios, household costs and public investment are expected to run lower than the LTS Baseline. In the Life scenario, the drop in private household costs is driven mostly by fewer vehicles purchases and lower (fossil) fuel costs from declining travel demand. On one hand, the high penetration of ZEVs in the Tech scenario means that household (fossil) fuel costs are expected to constitute about 36% of those in the Life scenario in 2050. On the other hand, without modal shift to more public transport, the household costs for vehicle purchases in the Tech scenario nearly double (192%) compare to those in Life by 2050. Moreover, public investment in the Tech scenario run consistently higher than that in the LTS Baseline driven mostly by investments in infrastructure which more than double by 2050 compared to 2020. In the Life scenario public investment slightly exceeds that in the LTS Baseline between the 2030 and 2035 due to increased procurement of trains and buses. Infrastructure investment also grows in the Life scenario but at a slower pace (153% higher in 2050 than in 2020) than in Tech. As a result, from 2040 onwards, public investment in the Life scenario remains below the LTS Baseline. New vehicles and infrastructures not only mean new investments but also additional materials such as minerals and metals. Changes in the demand for aluminium, lithium, nickel and copper in the EU27 + 2 are very different whether the transport sector follows the Life or Tech scenario (see section 3 and figure 49 of the SI). Demand for minerals and metals in the Tech scenario is expected to be 100%–220% higher than in the LTS Baseline, compared to circa 50% lower in the Life scenario.
3.2. The agriculture sector
Dietary changes are increasingly seen as paramount in reducing the overall GHG emissions and the resource footprint of agricultural systems. The interlinkages in the EUCalc model between calorie demand for human consumption, agricultural practices, land-use and the carbon cycle, allow for the evaluation of the agricultural sector's role as an integral part of the EU's decarbonisation strategy.
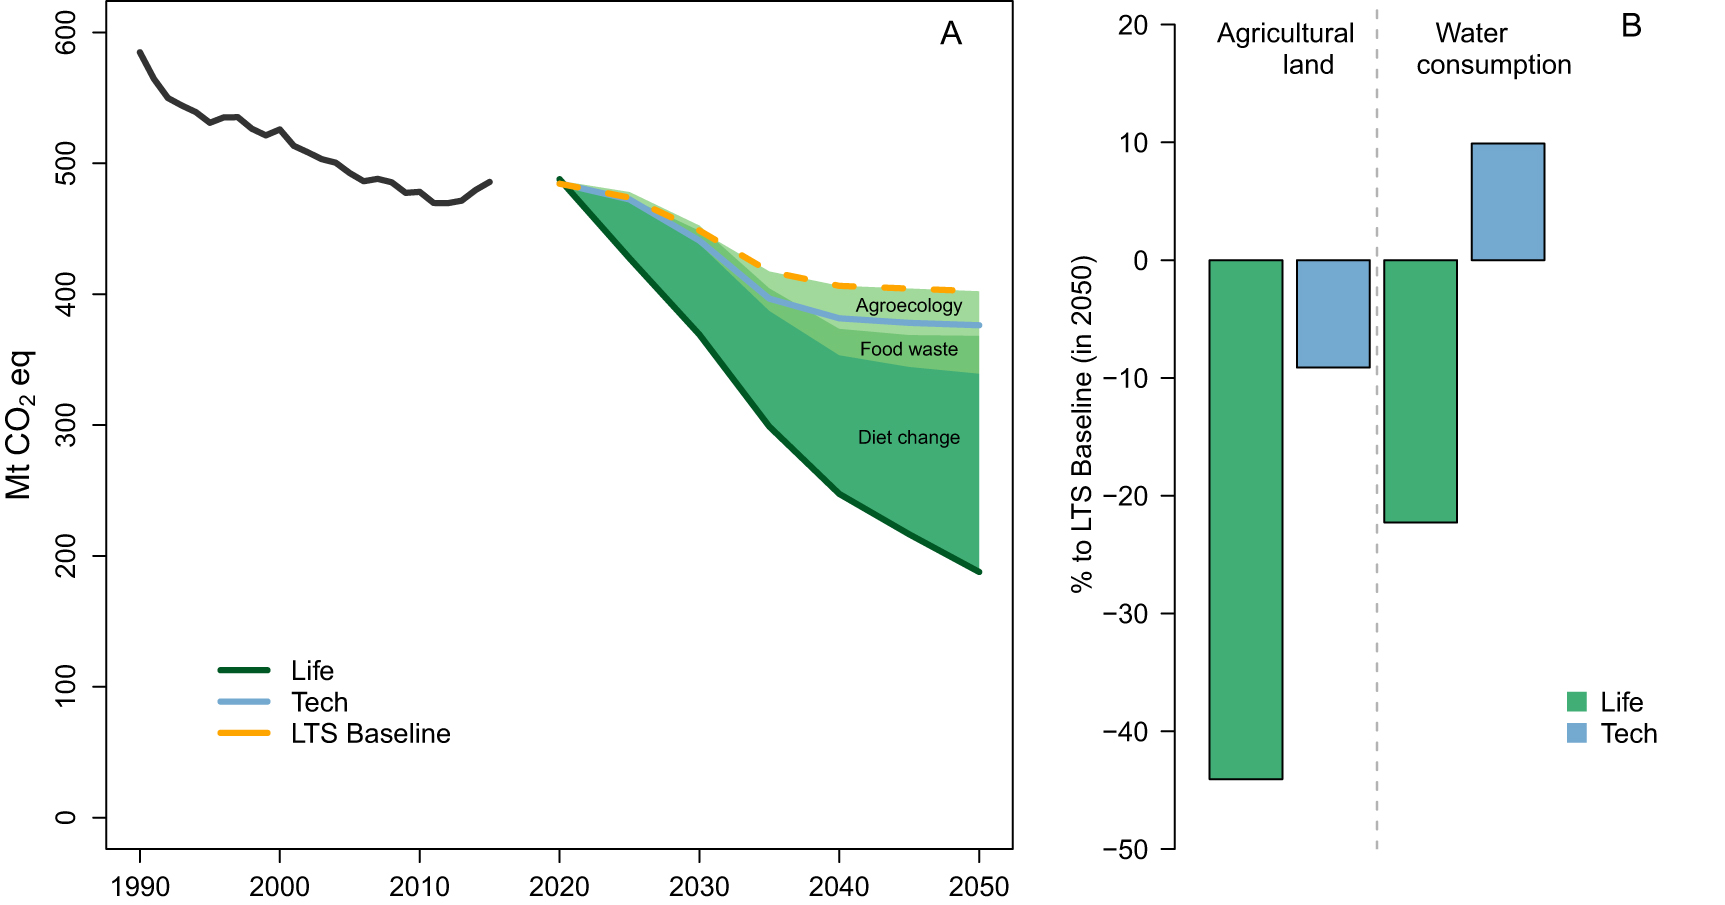
The generalised adoption of healthy diets as recommended by the WHO et al (2003) as well as less food waste, and a move towards agroecology practices would result in GHG emissions of circa 190 Mt CO2eq in 2050 in the Life scenario (see figure 4(A)). This is a 53% reduction compared to the LTS Baseline and a further 18% less than agricultural emissions reported in the LTS 1.5 LIFE scenario for 2050 (European Commission 2018b)—the most ambitious in terms of dietary and agricultural practices of the LTS report. Changes in individual behaviour regarding dietary preferences results in the largest GHG saving in the agricultural sector accounting for approximately 71% of total emission reduction potential in 2050 (see figure 4(A)). That said there are also savings due to a reduction in food waste and the adoption of agroecology practices. More importantly, without dietary shifts, moving towards agroecology alone (see blue line figure 4(A)) will only yield a small decrease in GHG emissions. In fact, the abatement potential of agroecology without dietary shifts is marginally better than that of the Tech scenario in which agricultural systems are further intensified.

Figure 4. Contributions of behavioural change and agricultural practices in GHG emissions (A) and agricultural-land and water consumption (B) in the EU27 + 2. Black line show historical 1990–2015 emissions. Simulation period starts in 2020.
Download figure:
Standard image High-resolution imageApproximately 45% of agricultural land (35% of cropland) can be freed up by adopting healthier diets, in particular less meat and dairy, as in the Life scenario, compared to the LTS Baseline (see figure 4(B)). Savings in cropland alone—circa 34.5 Mha (about the area of Finland)—indicates that the production of food for healthily nourishing the growing population in EU27 + 2 can co-exist with other uses such as conservation or the production of energy crops. At the global level, large-scale bioenergy production of 300 EJ from ambitious climate mitigation targets would require an area of 636 Mha for bioenergy crops. This represents 38% of current global cropland (Humpenöder et al 2018) and, in relative terms, compares to the share of cropland freed in Europe due to dietary changes in the Life scenario. Two comprehensive reviews estimated the 2050 European bioenergy demand and land requirement for energy crops at 3–56 EJ yr−1 and 13–33 Mha respectively (Ovando and Caparrós 2009, Bentsen and Felby 2012). Thus, in terms of area alone, freed cropland in the Life scenario could contribute to bioenergy production without interfering with food production. By default, the Life scenario allocates freed-up land to forests in order to enhance carbon storage (see SI section 2.1 Land management lever). The long standing conflict between land use for food/feed and energy crops (Popp et al 2014), can therefore be formulated as a trade-off between sustaining current excess food consumption/waste and having the opportunity for bioenergy and biodiversity.
3.3. The power sector
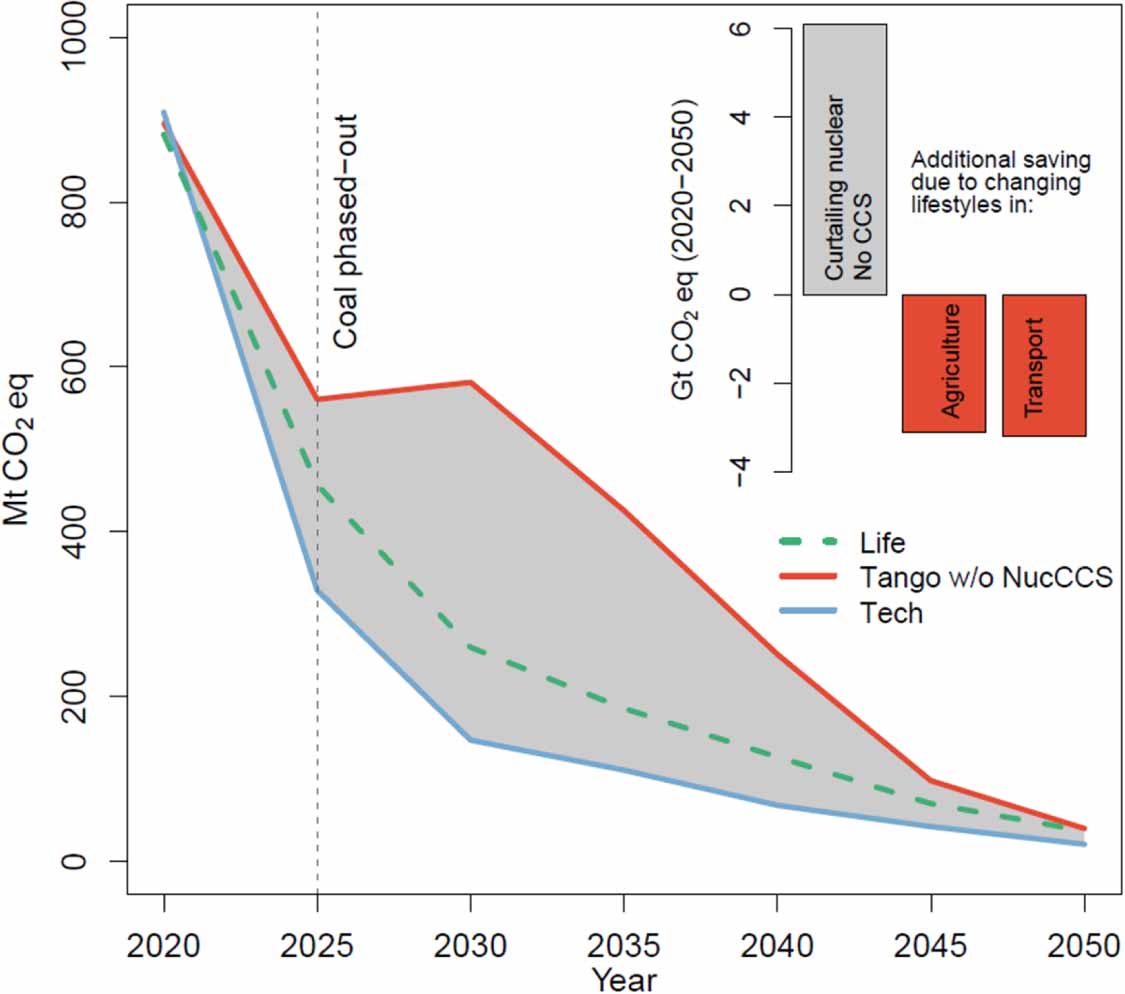
GHG emissions from the power sector are projected to fall by 98% in 2050 with respect to 2015, to just over 20 Mt CO2eq in the case of the Tech scenario (see figure 5 main). During the same period, the Life scenario results in circa 96% reduction, albeit at a slower pace, meaning that between 2020 and 2050 an additional 2 Gt CO2eq would be emitted compared to the Tech scenario. This is partly due to the absence of Carbon Capture and Storage (CCS) in the technologies portfolio of the power generation sector in the Life scenario. Nevertheless, changes in behaviour accelerate the decarbonisation of the power sector since the emission reduction in the LTS Baseline is 74% between 2015 and 2050 (see also SI section 2.1, Power levers).
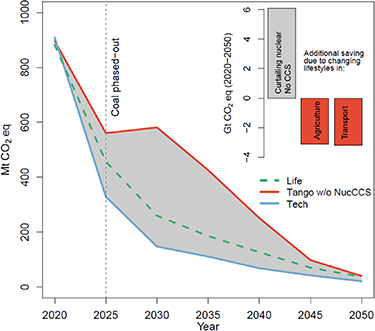
Figure 5. GHG emission in the power sector under the Life, Tech and Tango w/o NucCCS configurations (main). Cumulative emissions of curtailing nuclear power and additional GHG savings in transport and agriculture sectors due to lifestyle changes (inset).
Download figure:
Standard image High-resolution imageThe EUCalc results stress the imperative of phasing out coal by the end of the 2020s as shown by others (Rockström et al 2017). The continued phasing out of coal use would dominate emission reductions between 2020 and 2025 and account for 50%–65% of the total GHG emission reduction in the power sector by 2050 for the Life and Tech scenarios respectively.
In both Life and Tech scenarios, nuclear capacities remain substantial, respectively at 90 and 101 GW, while CCS is deployed to its full technical potential in the Tech scenario. These option are seen as particularly divisive in the public opinion in regard to their role in climate change mitigation (Abdulla et al 2019). The EUCalc allows testing the GHG consequences of a future in which these technologies are scaled down or not deployed. To do so the Tango scenario—which combines the highest decarbonisation ambitions of the Life and Tech (see table 1)—can be tweaked so that nuclear power capacity is scaled down to 11 GW by 2050 and CCS for fossil fuel electricity generation is not deployed. We call this Tango w/o NucCCS.
The GHG implications of Tango w/o NucCCS are visible in the sudden jump in 2030 as substantial share of nuclear production goes offline. The loss in production is then compensated by natural gas generation (see section 3 and figure 50 of the SI). As in Bauer et al (2012), decommissioning nuclear power might come at the expense of more emissions from the power sector, either because equivalent renewable capacities cannot be deployed within 5 years or as reserves to account for their intermittency. Between 2020 and 2050 this would imply an additional 6 Gt CO2eq compared to the Tech scenario in the EU27 + 2 (see grey area of figure 5 main and inset). However, it should be noted that the original Tango scenario accounts for all behavioural changes in the Life scenario and all ambitious technical improvements in the Tech scenario. These synergistic reductions in GHG emissions, attributable to lifestyles changes, result in cumulative savings of 3.1 and 3.2 Gt CO2eq in the agriculture and transport sectors respectively between 2020 and 2050 (see inset in figure 5). These emission savings would be enough to compensate the loss of abatement from nuclear power.
Cumulative and non-discounted investment in power generation associated with the Tango w/o NucCCS scenario between 2020 and 2050 are about 10% lower than the ones obtained under the LTS Baseline. The difference is mostly driven by a substantial drop in operational (OPEX) and capital expenditures (CAPEX) of nuclear (see section 3 and figure 51 of the SI). OPEX in gas generation is above the LTS Baseline and the highest among all considered scenarios. By contrast, cumulative investment in the Tech scenario would be 50% higher than that in the LTS Baseline and driven mostly by CAPEX for new offshore wind capacity and CCS.
3.4. Accelerating to net-zero
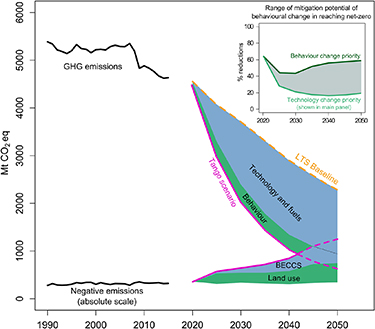
Figure 6 summarises the GHG emissions of the Tango scenario, highlighting the share of reductions associated with behavioural change and technological development. Note that because the order in which levers are set matters for their relative contribution to total reductions (see also results for figure 2), the main panel of figure 6 reports only the contribution of behavioural change in case technology deployment is prioritised. Therefore, this is a lower bound of the potential contribution of behavioural changes to the decarbonisation of the EU27 + 2. Should behavioural changes be prioritised, their full potential would be closer to 60% reduction in emissions by 2050, as shown in the inset of figure 6.
Figure 6. The role of behaviour and technological changes in the decarbonisation of the EU27 + 2. Black lines show historical 1990–2015 GHG emissions and negative emission from land-use. Negative emissions are plotted in an absolute scale. Inset shows the range of % of reductions associated with behavioural change in reaching net-zero. Simulation period starts in 2020.
Download figure:
Standard image High-resolution image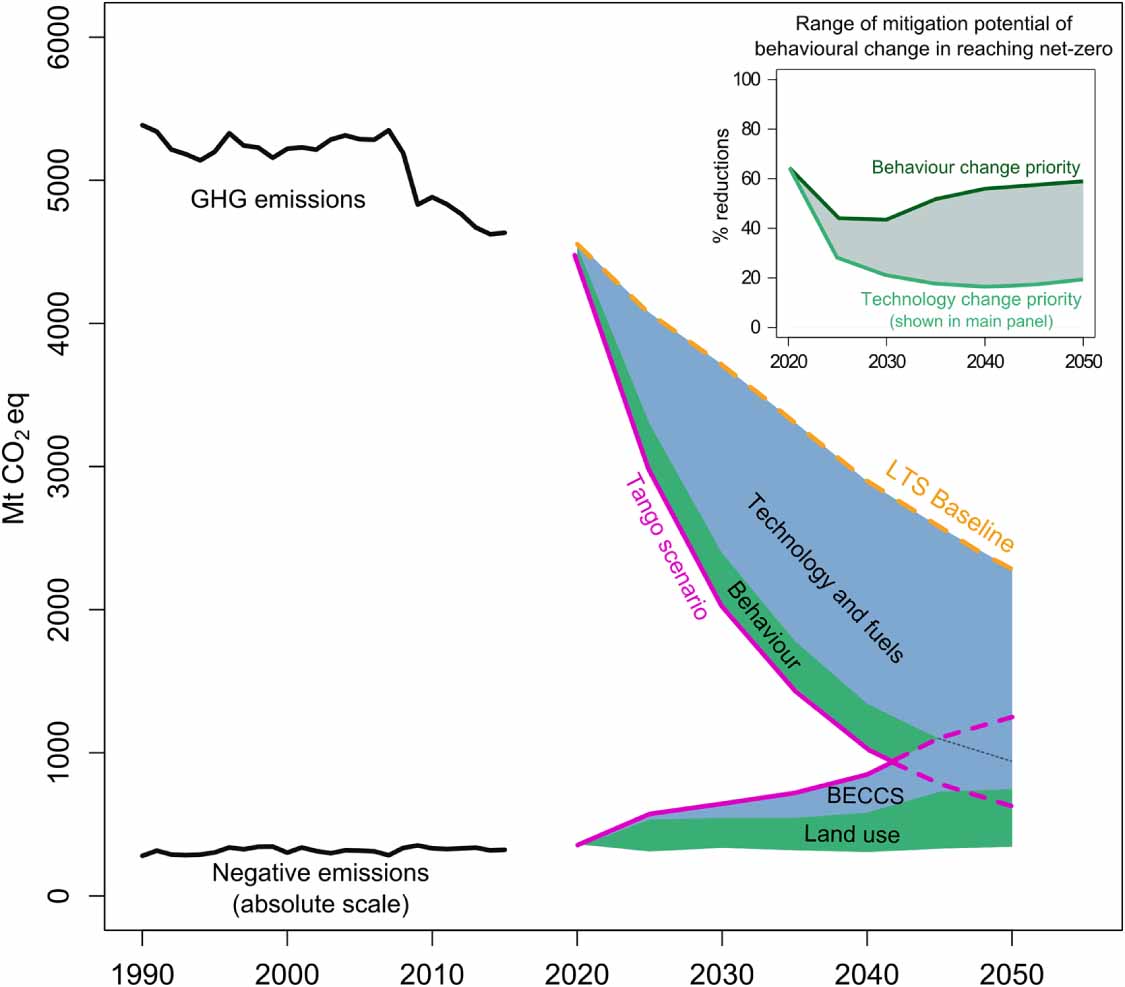
The Tango scenario would make it possible for the EU27 + 2 to reach net-zero by approximately 2040 (see intersection of the magenta lines in figure 6). Between 2025 and 2050 the contribution of behaviour change to GHG emission reductions remains small but persistent, averaging circa 20% of potential reductions in the most ambitious Tango scenario (see inset of figure 6). These reductions have important effects on the timing for reaching key climate targets. Without the behavioural reduction wedge, GHG emissions would be 16% higher in 2040 and the negative emissions from land-use due to dietary change would decline (that is, fewer removals) to about 40% of the Tango potential. As a result, achieving net-zero would be postponed to 2050. In the LTS Baseline scenario (orange line in figure 6), the 55% reductions target by 2030 of the European Commission's Green Deal would be reached by 2043 while in the Life scenario (which incorporates the technological development of the LTS Baseline) the target would be reached by 2035.
The technology and fuels wedge provides the largest share of potential emission reductions, emphasising the need for structural changes in all sectors. Yet, changes in behaviour—as described in this paper—provides the EU27 + 2 with an important opportunity to avoid high cost and/or high risk technologies in pursuit of decarbonisation. Net-zero would still be technically feasible by 2050 even in the absence of bioenergy with carbon capture and storage (BECCS) as long as the decarbonisation wedge from the Life scenario is realised (see figure 6). Without behavioural change, the EU27 + 2 would require carbon removal and storage of 6.3 Gt CO2eq between 2020 and 2050. Although this value is higher than in the LTS 1.5 scenarios reaching net-zero (European Commission 2018b), it is below estimates of the role of BECCS in Europe's energy sector (Solano Rodriguez et al 2017) and its territorial storage potential (Pozo et al 2020).
4. Discussion
The definition of the Life, Tech and Tango scenarios are rooted in the LTS Baseline as they share important commonalities (see table 1). It is therefore important to evaluate how closely the EUCalc model can reproduce the GHG evolution of EU's main benchmark scenario. After configuring EUCalc's inputs to match the evolution of activities, technologies, fuel mix and efficiencies found in the LTS Baseline scenario (see sections 2 and 2.1) we obtain a difference in total GHG emissions of +3.1% in the year 2050 (median of +8.3% over 2020–2050, see section 2.2, table 11 and figure 48 of the SI for sectoral comparison) compared to those reported by the European Commission (2018a).
The ability to investigate scenarios of broad and deep behavioural change makes the EUCalc a suitable model to explore a world of increasing uncertainty. The SARS Cov-2 pandemic has shown that lifestyle changes can occur rapidly, albeit not entirely voluntarily, with significant emissions reductions over the short-term (le Quéré et al 2020). When looking to the future it is impossible not to consider the long term socio-economic effects of changes in consumer behaviour introduced by the pandemic which are not expected to be short-lived (IEA 2020). We have observed that in the Life scenario, employment, measured in total working hours decreases in transport, industry, agriculture, and power sectors as individuals travel less, purchase less vehicles/appliances and consume less food, material and energy (see section 3 and figure 52 of the SI). However, the monetary savings on energy, vehicle and food expenses means that more income can be allocated to service activities (e.g. local tourism and cultural activities). This increase compensates for the loss of employment in other sectors in 2050, the Life scenario is neutral in employment terms, increasing overall employment by only 0.05% over that of the LTS Baseline. This also corroborates existing research on the employment impacts of energy transition, with a small but net positive effect (Füllemann et al 2020).
Finally, the tight sectoral integration of the EUCalc model allowed exposing a range of co-benefits associated with the Life scenario. This leads to lower pressure on natural resources such as water consumption (figure 5) and mineral extraction (see figure 49 of the SI). It also highlights the broader sustainability of trajectories towards net-zero emissions that incorporate a high degree of behavioural change.
5. Conclusions
The EUCalc model was used to evaluate the combined and individual role of ambitious behavioural and technological changes in Europe in reducing GHG emissions and reaching net-zero by 2050. In doing so we uncovered the existence of a crucial role for behavioural change in alleviating three challenges surrounding the decarbonisation of Europe. Firstly, ambitious behavioural changes in combination with technological changes would allow for reaching net-zero targets by approximately 2040. The results emphasise the need to consider combined behavioural and technological changes in decarbonisation pathways because the former can deliver early emissions reductions, equivalent to lower hanging fruits than technological changes (see inset in figure 6). Relying exclusively on technological changes for decarbonisation would likely push this target to around 2050. Secondly, because the mitigation potential of behavioural changes is in some cases equivalent (or even superior) to that of technologies/practices, decision makers can more clearly judge where to deploy the most ambitious policies. For example, the cross-sectoral mitigation potential associated with changes in behaviour was quantified as large as that expected from the large-scale deployment of BECCS, a divisive option among experts and the public opinion. Third, the over reliance on technology deployment as a cornerstone of Europe's climate ambitions limits the potential for broader co-benefits of decarbonisation. Europe's water consumption, land requirements and mineral demand are considerably reduced when behavioural changes are considered in the pathway towards net-zero. These insights and the underlying lifestyle and technological changes can then be explored further in policy-making to determine actionable economic and political priorities in achieving full decarbonisation.
Acknowledgments
All authors acknowledge funding from the European Union's Horizon 2020 research and innovation programme under Grant Agreement No. 730459 (EU Calculator: trade-offs and pathways towards sustainable and low-carbon European societies). We acknowledge the full team of the EUCalc project particularly Vincent Matton, Julien Pestiaux and Michel Cornet (CLIMACT) for the model architecture, technical and strategic deliberations, and Katja Firus (T6 ecosystems S.r.l.) for coordination and dissemination activities. Vincent Moreau further acknowledges funding from the Swiss National Science Foundation, under Project Agreement Number PZENP2_173635. The publication of this article was partially funded by the Open Access Fund of the Leibniz Association.
Data availability statement
The data that support the findings of this study are openly available at the following URL/DOI: https://zenodo.org/record/4450345.