

Abstract
Recent wildfires in the western United States have led to substantial economic losses and social stresses. There is a great concern that the new climatic state may further increase the intensity, duration, and frequency of wildfires. To examine temporal and spatial features of historical wildfire trends and future changes, a common fire index, the Keetch–Byram Drought Index (KBDI), is calculated over the contiguous United States (CONUS) and Alaska. We introduce an efficient initialization method and calculate 36 years (1982–2017) of historical KBDI at 4 km using a high-quality observational dataset. KBDIs are also calculated at 12 km using regional climate models and extended into the mid- and late-21st century. Based on the observational data, annual mean (and 95th percentile) KBDI over forested regions in the southwestern and northwestern CONUS has risen since 1982 at a rate of 5.2 (4.0) and 2.9 (3.3) per year, respectively, indicating a persistent drying trend fostering fire activities; the number of days exceeding the top 5% historical KBDI has increased by 16 and 25 d in the 36 years. Multiple regional climate model simulations project increasing wildfire potential and longer fire seasons over broader areas based on the estimated KBDI for the mid- and late-21st century. By the end of the century, most of the CONUS would experience about 90–189 more days per year exceeding the historical local maximum KBDI; areas with high KBDI (>600), whose occurrence correlates with large burned area, are projected to broaden by nearly 60 times in the southern CONUS. While both temperature and precipitation contribute to future KBDI changes, warming is the main driver of more frequent, intense and wide-spread extreme wildfires indicated by high KBDIs in future projections.
Export citation and abstract BibTeX RIS
1. Introduction
Wildfires cause extensive damage to air and water quality, human health, infrastructure, and ecosystem services. In recent years, the cost of fighting wildfires has exceeded 2 billion dollars, and the sum of all direct and indirect costs could be 30 times as much in the United States (Schoennagel et al 2017). It is concerning that climate change may cause more frequent and intense wildfires in the future (Abatzoglou and Williams 2016, Wuebbles et al 2017). Westerling (2016) and Gergel et al (2017) found that warming temperatures in springs induced early snowmelt in the western US. Combined with reduced winter precipitation, it has led to longer summer dry seasons and drier vegetation, all of which provoked more and longer-burning large wildfires.
The increasing trends of fire activity span over a wide range of vegetation types, latitudes, and precipitation regimes in the western contiguous United States (CONUS) based on satellite data (Westerling et al 2006, Keeley and Syphard 2016, Halofsky et al 2018). Fire indices are commonly used to describe wildfire potential, i.e. the Keetch–Byram Drought Index (KBDI; Keetch and Byram 1968) and Canadian Fire Weather Index (CFWI) have been used by the U.S. Forest Service (USFS), Texas Forest Service, U.S. Army, and Canadian Forest Service for fire management and planning. KBDI and CFWI often perform better than linear indices such as the Angstrom and Baumgartner indices (Skvarenina et al 2003, Hamadeh et al 2015), because relationships between fire index, fire occurrences, and meteorological variables are complex and nonlinear. In particular, KBDI was developed on a theoretical background of water losses from an ecosystem and requires fewer variables than other indices. Previous studies show that KBDI correlates with vegetation water dynamics, especially for those with shallow root systems such as shrubs, trees (other than pine trees), and grass, indicating that the KBDI is suitable for describing fuel moisture content and wildfire spread after ignition (Dimitrakopoulos and Bemmerzouk 2003, Verbesselt et al 2006, Xanthopoulos et al 2006, Pellizzaro et al 2007). Abatzoglou and Williams (2016) found that the correlation coefficient between KBDI and burned area over the forests of southwestern United States is 0.6–0.8. The cumulative nature of the KBDI, unlike noncumulative indices such as the Angstrom index, allows it to consider the effect of numerous dry days in a row (Hamadeh et al 2015, Abatzoglou and Williams 2016).
While fire monitoring agencies such as the USFS provide daily KBDI on geospatial maps, KBDI is calculated in practice using station data, and then extrapolated to a gridded map based on distances. Therefore, the KBDI data are sometimes sparse over a large area of the country and can be poorly represented over locations where station data is not available. To account for this, a spatially resolved gridded dataset is desired to characterize wildfire potential in the entire US. Liu et al (2010) calculated the KBDI globally for 1961–1990, using a monthly mean gridded observational dataset at a spatial resolution of 0.5° × 0.5°. They also calculated KBDI in 2070–2100 using four general circulation models (GCMs) with different spatial resolutions (the finest at 2.5° × 3.75°). Comparing the historical and future KBDI calculations, they found a significant increase in monthly and seasonal means over the United States. Weatherly and Rosenbaum (2017) calculated the KBDI for the CONUS during 1950–1999 and 2070–2099 using statistical downscaled temperature and precipitation at a spatial resolution of 2° × 2°, based on observational station data from less than 100 stations and multiple GCMs. Liu et al (2013) calculated a higher-resolution (50 km) KBDI dataset for the CONUS during 1971–2000 and 2041–2070, using one regional climate model run from the North American Regional Climate Change Assessment Program (Mearns et al 2009, 2012). Both studies showed some of the largest KBDI increases over the southern United States and Great Plains in summer and fall.
As previous studies have identified the increasing wildfire potential in the United States, they have used coarse resolution (in both time and space) climate data and only investigated changes of monthly and seasonal averages (Liu et al 2010, 2013). This study builds on higher spatial resolution datasets that have become available recently and provides more detailed information required by other sectors such as infrastructure (Cova et al 2013, Altintas et al 2015), human health (Finlay et al 2012, Black et al 2017), and ecological services (Lee et al 2015, Pausas and Keeley 2019). Specifically, the present study quantifies the historical KBDI trend using high-quality, high-resolution observational data at a grid spacing of 4 km. It focuses on the recent 36 years (1982–2017), which represent a period of global warming not encapsulated fully in any of the previous studies (Stocker et al 2013). In addition to the CONUS, this study also assesses the wildfire risk in Alaska. Alaska has warmed twice as fast as the rest of the nation, and is experiencing permafrost temperature rise, which can lead to more wildfires (Chapin et al 2014), but has been studied less than other regions in US in part due to limited metrological observations (Wuebbles et al 2017, Daly et al 2018). Furthermore, this study examines the spatial and temporal changes of high-KBDI events which could potentially have large impacts on the economy and society (Weatherly and Rosenbaum 2017). Finally, the link of predicted KBDI (annual mean and occurrence of high KBDI) to the fire activities (total burned area, fire counts and averaged burned area per fire count) is discussed.
2. Methods and datasets
2.1. Calculation of KBDI
The KBDI is calculated using daily maximum temperature, daily precipitation, and annual accumulated precipitation (Keetch and Byram 1968). As a substitute for fuel availability in an area, the KBDI uses cumulative annual precipitation and assumes that higher annual rainfall corresponds to more vegetation, and therefore more fuel available to burn. The KBDI formula approximates the amount of evapotranspiration as a proxy to account for the dryness of the upper soil layers and the flammability of organic matter. The calculated KBDIs fall within a range from 0 to 800, which is equivalent to the amount of water necessary (in hundredths of an inch) to bring the soil up to an assumed complete saturation of 8 inches. For example, a KBDI value of 0 indicates that the soil is completely saturated, and the potential of a wildfire is low; whereas a KBDI value of 800 indicates extreme drought and unpredictable wildfire behavior. In practice, the KBDI is commonly calculated on a daily basis, and the index either increases or decreases by
where Tmax is the daily maximum temperature (°C); R is the annual accumulated precipitation (cm); dt is the time increment, 1 d here; and Q is the KBDI for the previous day. When Tmax falls below 6.78 °C, dQ is 0. In addition, the value of Q is reduced by the amount of daily precipitation in excess of 0.51 cm (0.20 inch). This equation allows for input in SI units but gives the KBDI in units of hundredths of an inch. See Keetch and Byram (1968) for more details.
2.2. Initialization
Ideally, according to Keetch and Byram (1968), KBDI could be set to zero after a period of 15.24 − 20.32 cm (6–8 inches) of precipitation or more accumulated in 1 week. However, this requirement may not be met often in dry regions such as the southwestern CONUS. We developed an initialization procedure as follows. First, we find the week of maximum precipitation for the first year of data and set the KBDI to zero for that week. Using it as an initial point, KBDI is calculated on the basis of the KBDI value from the previous day. During the initialization (or spin-up) stage of KBDI, the 1st year data is used in a loop to repeat the daily KBDI calculations. When the differences between the daily KBDIs calculated in loop (n) and loop (n-1) are smaller than a threshold, i.e. 0.3 inch, it is determined that the calculated daily KBDIs are stabilized as being the closest to the 'real' KBDIs of the first year. At this point, the initialization of KBDI is completed. The KBDI on the last day of the first year, which is calculated in the loop (n), is then used to estimate the KBDI on the first day of next year, and so forth so on for the subsequent time periods. For relatively wet regions, the KBDI does not need a long spin-up time (1–2 loops of the 1st year data are sufficient); however, in dry regions, the KBDI needs longer time (at least 4 loops) to reach equilibrium (see figure S1 (available online at stacks.iop.org/ERL/16/034060/mmedia) in supporting information). This method accounts for the specific conditions of the first year and can therefore achieve a more effective initialization than previous studies (Liu et al 2013), while the error due to inaccurate representation of the initialization year eventually settles out (Fujioka 1991).
2.3. Observational and modeling datasets
Daily precipitation and maximum temperature were obtained from the Parameter elevation Regression on Independent Slopes Model (PRISM; Daly et al 1994, 1997, 2008) at a spatial resolution of 4 km. PRISM utilizes station measurements and a weighted regression scheme to determine precipitation and temperature values in complex terrain by considering factors such as location, elevation and orographic effectiveness. Data after 2002 also incorporate radar measurements to supplement station data (Daly et al 2008). The KBDI was calculated using PRISM data from 1981 through 2017, with 1981 used for initialization.
Future projections of KBDI were calculated from the model simulations of a regional climate model—Weather Research and Forecast model (WRF, Skamarock et al 2008)—at a spatial resolution of 12 km (Wang and Kotamarthi 2015). Most of the results presented in this study are derived from the WRF simulations driven by Community Climate System Model version 4 (CCSM4, Gent et al 2011) with bias-corrected vertical profiles of temperature, wind, and geopotential height. The KBDI was calculated for one historical (1995–2004), and two future periods (2045–2054 and 2085–2094) under representative concentration pathway (RCP) 8.5, a pathway that assumes very high levels of greenhouse gas emissions by 2100 with an effective radiative forcing increase of 8.5 W m−2 due to large populations and little technology improvement (Riahi et al 2011). To understand the KBDI's sensitivity to different climate projections, we also calculated KBDI in the late 21st century under RCP8.5 using another two sets of WRF outputs driven by Geophysical Fluid Dynamics Laboratory Earth System Model with generalized ocean layer dynamics component (GFDL-ESM2G, Donner et al 2011), and the Hadley Centre Global Environment model, version 2-earth system (HadGEM2-ES, Jones et al 2011). Please see Zobel et al (2018) for detail evaluation of these WRF regional climate model simulations. The three WRF simulations driven by different global model boundary conditions represent high (HadGEM2-ES), median (CCSM4), and low sensitivity (GFDL-ESM2G), respectively, of global average air temperature to the doubling of CO2 (Sherwood et al 2014).
In addition to calculating the KBDI across the entire CONUS and Alaska, we also calculated the KBDI over forested lands—deciduous broadleaf (located in southeastern CONUS) and evergreen needleleaf (located in western and southern CONUS)—determined by Moderate Resolution Imaging Spectroradiometer (MODIS) as well as US Geological Survey land use data. These land use data were also utilized as static input for the WRF post-processing.
Monitoring Trends in Burn Severity (MTBS) dataset spanning 1984–2017 is employed here to explore the relationship between KBDI and fire activities. MTBS is developed utilizing satellite and local-report on a basis of 30 m spatial resolution (Eidenshink et al 2007). It provides burned area for each fire event and for different burned severity for fires greater than 1000 acres in the western US, and 500 acres or greater in the eastern US. Total burned area, fire count, averaged burned area per fire count are derived in this study at annual scale to calculate correlations with all KBDI and high KBDI values over entire CONUS for forest lands and all land types.
2.4. Analysis
To compare the observationally (PRISM) and WRF-derived KBDI, the CONUS is divided into seven regions (figure 1) based on the national climate assessment (Wuebbles et al 2017): northeast (NE), southeast (SE), midwest (MW), southwest (SW), northwest (NW), Northern Great Plains (NGP), and Southern Great Plains (SGP). Four KBDI categories were defined following Weatherly and Rosenbaum (2017) with KBDI values 0–300, 300–600, 600–750, and 750–800. KBDI values larger than 600 indicate that fire starts easily, burns quickly, and is difficult or impossible (if KBDI >750) to control. This is referred to as 'high' KBDI to quantify high fire risk potential, as by previous studies (Janis et al 2002; Hamadeh et al 2015; Weatherly and Rosenbaum 2017) for various areas in North America. We also explore the relationship between KBDI (both annual mean and occurrence of high KBDI) and burned area using MTBS data in the observational time period.

Figure 1. Seasonal mean KBDI from 1982–2017 using PRISM data with the seven regions outlined. The seasons are defined as spring (March, April, and May), summer (June, July, and August), fall (September, October, and November), and winter (December, January, and February). The CONUS is divided into seven regions based on the national climate assessment: northeast (NE), southeast (SE), midwest (MW), southwest (SW), northwest (NW), Northern Great Plains (NGP), and Southern Great Plains (SGP).
Download figure:
Standard image High-resolution imageIn order to investigate the relative impacts of changing precipitation and temperature on the changes of KBDI, three additional sets of KBDI were computed as follows. Let Tp (or Tw ) and Pp (or Pw ) represent the daily maximum temperature and daily precipitation from PRISM (or WRF output), respectively; and ΔTw,j and ΔPw,j represent the change of maximum temperature and precipitation in season j (spring, summer, fall, or winter), projected by WRF for the late 21st century under RCP8.5. Then, three new sets of KBDI are calculated using (1) Tp +ΔTw,j and Pp ; (2) Tp and Pp +ΔPw,j ; and (3) Tp +ΔTw,j and Pp +ΔPw,j , respectively, to investigate KBDI changes due to (1) only temperature changes, (2) only precipitation changes, and (3) both temperature and precipitation changes.
In order to investigate the statistical significance of the results (including long-term trend, historical versus future changes, and uncertainty due to multiple model results) presented here, we conduct student-t test as well as calculation of signal-to-noise ratio (SNR). SNR is a measure of a desired signal relative to the background noise, with SNR > 2 implying statistical significant signals. For example, studies in climate science have been using SNR to present the significance of the signal of climate change (Heo et al 2014, Scaife and Smith 2018).
3. Results
3.1. Historical view of wildfire potential
Figure 1 shows the seasonal mean PRISM-derived KBDI from 1982 to 2017, divided into seven sub-regions. All seven regions have the highest KBDI in fall and the lowest KBDI in winter or spring, except within the SE region, Florida has the highest KBDI in winter and spring. Although most of the regions show KBDI peaks in the fall, the maximum KBDI occurs later over NGP, NW, and SW than over SGP, NE, MW, and SE (figure S2), suggesting the wildfire season generally begins in the southern and eastern CONUS and then moves to the western and northern CONUS.
Over the long term (figure 2), most of the regions show little variation in the estimated annual mean KBDI in the past 36 years (1982–2017), except for the SW and NW regions, which increase by 1.8 and 1.4 per year, respectively, over all land types. In particular, the KBDI increased the most over forested lands in the SW and NW; the annual mean (and annual 95th percentile) increases by +5.3 (4.0) and +2.9 (3.3) per year over the forested lands in SW and NW, respectively. The increasing trend of KBDI suggests a persistent long-term drying condition occurred over the West US, which may have played a role in mediating the increased fire activities over this region. Furthermore, the number of days with high wildfire potential (using the 95th percentile of KBDI in 1982–2011 as a baseline) increases by 16 and 25 d, respectively, over the forested SW and NW. The SW and NW also had more areas experiencing high KBDI (>600), with +0.85% (1 156 km2) and +2.4% (529 km2) increases per year (figure 2). In addition, the NW has changed more rapidly than the SW in magnitude, frequency, and space of calculated KBDI. These results are consistent with a previous study by Abatzoglou and Williams (2016), which focuses only over forested regions in the western CONUS.
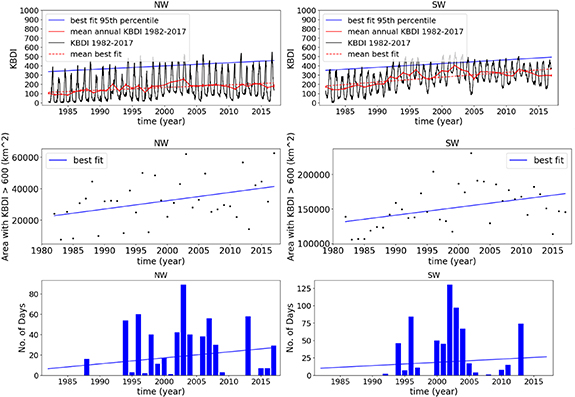
Figure 2. Top: regional average daily KBDI (black) with long-term trends fitted on annual mean (red) and 95th percentile value (blue) over forested regions. Middle: area where annual KBDI > 600 with best fit indicated by a blue line over all land types. Bottom: number of days with high wildfire occurrence (using 95th percentile of KBDI in 1982–2011 as a baseline), with a best fit indicated by a blue dotted line over forested regions. All the long-term trends are statistically significant at a confidence level of 98% based on a student-t test.
Download figure:
Standard image High-resolution image3.2. WRF model evaluation
In order to use the WRF model outputs to project future wildfire potential, we evaluate the performance of WRF-derived KBDI for 1996–2004. The WRF run used here is driven by CCSM4 with bias correction (WRF-CCSM4 hereafter). Figure S3 shows the probability density functions (PDFs), as well as scatter plots using daily and monthly averaged KBDI. Results are for entire subregions, including all land types. Compared to PRISM-derived KBDI, the WRF-derived KBDI has a higher density of 0 < KBDI ≤ 100, and a lower density of KBDI > 100 over all the subregions. This indicates that, in general, WRF underestimates the frequency of moderate to high KBDIs seen in summer and fall and overestimates the frequency of low KBDIs seen in the spring. However, both WRF- and PRISM-derived KBDIs show the SW has the highest density of KBDI greater than 400 followed by the SGP and SE. The WRF-derived KBDI also aligns with PRISM during the high-KBDI seasons (figure S2), which represent the most critical times for fire management and planning over the fire-prone regions such as NW, SW, and SGP, as well as the SE. In particular, the WRF-derived KBDIs correlate strongly with PRISM-derived KBDIs over the SW and NW, with correlation coefficients of 0.76 and 0.86, respectively; the relative root mean square error (rRMSE) is also the smallest over the SW with a value of 35.5% (figure S3), indicating that the WRF model captures the daily variation of KBDI data with relatively small error over SW and NW, compared to the other subregions with lower correlations and higher rRMSEs. The discrepancy between KBDIs derived from PRISM and those derived from WRF-CCSM4 can be explained mainly by the model bias in precipitation and temperature (Wang and Kotamarthi 2015, Zobel et al 2018). Overall, the WRF model underestimates the KBDI, but captures the seasonal cycle, peak values, and PDF distributions reasonably well, especially over regions with high wildfire potential such as the SW and NW.
3.3. Future projections of daily KBDI
Figure 3 shows the WRF-derived daily KBDI in historical (1982–2017), mid-21st century, and late-21st century periods averaged for eight regions, including Alaska. Results are for entire subregions, including all land types. Although the peak of daily KBDI occurs at the same season in historical and future periods (except for MW), the KBDI values in the future are projected to be much higher than that in the historical period. The SGP, SE, and SW see the largest increases in KBDI magnitude with increases of 145, 132, and 116 during peak fire season in the fall by the late 21st century (table S1). The regional mean KBDI in the future is greater than the annual maximum KBDI in historic periods for more than 90 d over all seven subregions and 65 d in Alaska. This phenomena reflects that, for those regions that already have high fire danger, the fire season will be longer; for those regions that used to have low wildfire potential, such as the MW, SE, and NGP, there is a large increase in periods with high KBDI, indicating that in the future these regions could experience high wildfire danger (table S2). Spatially, the change in seasonal mean KBDI is also highly variable (figure S4). Over the MW, NGP, and NW, the changes (mostly increases) in summer and fall are large and significant, while those in the winter and spring are small and not significant. This is also true for northern and central Florida, as well as all of Nevada. The seasonal mean change over parts of the NW and SW are smaller than other regions, with some areas showing no change in seasonal mean daily KBDI.
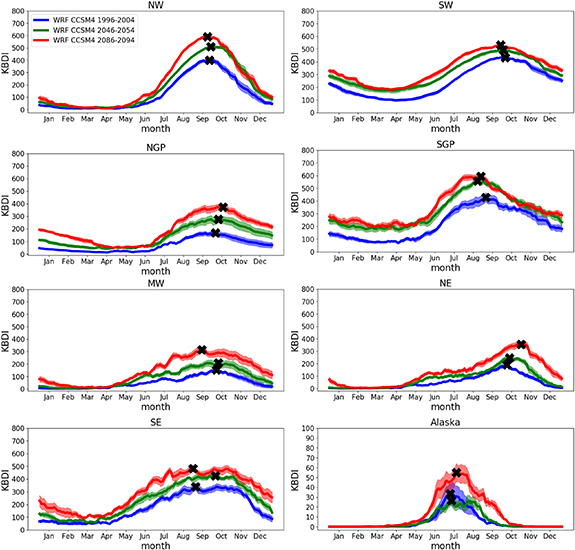
Figure 3. Daily mean KBDI derived from WRF-CCSM4 for historical (1996–2004), mid-21st century (2046–2054), and late-21st century (2086–2094) periods over seven subregions of the CONUS and Alaska. The peak of each period is indicated by an 'x'. The color of each period indicates the interannual variability of daily mean KBDI. There is no robust, larger interannual variability in the future over each region, but there is larger seasonal variability in many regions, indicating that fire will be more difficult to forecast and manage. In Alaska, the shape of the KBDI time series agrees with that found by Keetch and Byram (1968), with a single peak in the summer. However, because we calculate the regional mean, the KBDI values are much lower than the individual site that shown in the previous study.
Download figure:
Standard image High-resolution image3.4. Future projections of high KBDI
The seasonal mean changes in daily KBDI are important, and have been studied previously (Liu et al 2010, 2013). However, in order to understand the impact of climate change on extreme wildfire risk, the focus should be on high KBDI (Weatherly and Rosenbaum 2017), which is related to fires that are difficult to control and cause severe damage to society (e.g. critical infrastructure; public health) and economics. We investigated the change in number of days with KBDI > 600. As shown in figure 4, spatial features of changes in number of days with high KBDI are different from those in seasonal mean KBDIs (figure S4). For example, seasonal mean KBDI values are higher in the MW, NGP, NE, and SE in all four seasons, but high-KBDI events show very minor or no change over these regions. This is because these regions are mostly dominated by low- to moderate-KBDI events, and high-KBDI events are rare, especially in historic periods. However, over the SW, although the seasonal mean KBDI shows no significant change, the frequency of high-KBDI events increases significantly (by 40–60 d) in summer and fall, when the KBDI reaches its peak (figure 4). This indicates that in both history and the future, the SW is dominated by high-KBDI events, which will occur more frequently in the future over the SW and SGP. The NW behaves similarly to the SW; it experiences a significant increase in the frequency of high-KBDI events in the fall and summer (figure 4) but has areas of small changes in seasonal mean KBDI (figure S4). These findings are consistent with the long-term trend of number of days with high KBDI over the past 36 years, based on PRISM-derived KBDI.
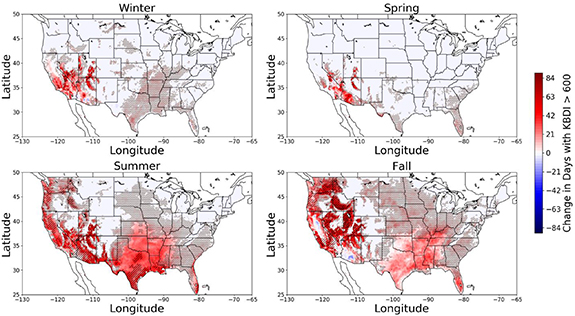
Figure 4. Change in the number of days and area with KBDI > 600 from the historical period to late 21st century using WRF-CCSM4. Shading indicates changes in the number of days; significant changes (signal-to-noise ratio larger than 2) are hashed. Dots indicate that a grid cell has a KBDI value greater than 600 only in the future. Areas without dots indicate that a grid cell either has KBDI > 600 in both periods or does not have KBDI > 600 in either period.
Download figure:
Standard image High-resolution image
In addition, we examined the change of area with high KBDI (>600) from the historic period to the late 21st century. Alaska and the SE, SW, and NW have more grid cells (or area increase) during the summer and fall with KBDI > 600, with increased area of 1 392, 58 416, 46 560, and 27 780 km2, respectively (table S3). This emphasizes that wildfire danger (which is already high) over these regions will be not only more frequent but also broader in area. Moreover, there are more grid cells with KBDI > 600 over the MW and NGP, where the wildfire potential used to be low in historic but will have longer fire season (figure 3 and table S1) and broader fire areas. The area increases are largest in summer and/or fall over all the subregions except the SGP, where the area increase is the largest in winter (40 812 km2). This indicates that the high KBDI over the SGP will occur not only in warm seasons but also in cold seasons, due to future temperature increase.
3.5. Uncertainty and attribution
To examine the uncertainty of the modeled KBDI changes, we calculated the seasonal mean changes of KBDI in the late 21st century over all eight regions using three WRF model outputs from WRF-CCSM4, WRF-HadGEM, and WRF-GFDL (figure S5). In general, all of the three models project KBDI increases consistently; variations are relatively small compared to the mean changes projected by the three different models. In the fall, when most regions have the peak KBDI, all regions except Alaska have SNRs > 1.5, indicating that the WRF-CCSM4-derived KBDI is representative for all three models at a confidence level of 90%. In summer, SNRs are larger than 2 over the SGP and SE, which means all the models agree with each other about the projections in these regions. The SNRs in spring and winter are low, mostly because the KBDI and the predicted changes from historic to future periods in these seasons are low and not robust.
The future changes of KBDI depend on temperature and precipitation changes. Assuming temperature remains unchanged, lower KBDIs are generally predicted in response to precipitation increases projected over most of the regions such as the MW, SE, and NE (figure S6). One exception is over the SW in spring, where precipitation is projected to decrease as many studies have also reported robust dryness in future based on both regional climate models and GCMs (Cayan et al 2010, Gao et al 2014), thus increases of KBDI are predicted as well as over the MW in winter. In contrast, future KBDIs are predicted to increase predominantly due to the projection of warmer temperatures assuming no changes in precipitation (figure S7). The magnitude and area of the KBDI increases due to temperature changes only are much larger than those of the KBDI reductions due to precipitation changes only (figure S6), especially in the summer and fall. As a result, increases of KBDI for higher fire potential are prevalent in future projections when considering both temperature and precipitation changes (figure S4), and the amplified intensity, duration, and frequency of high KBDIs are mainly attributed to the temperature warming.
4. Summary and discussion
Although the WRF model underestimates the frequency of high KBDI over all the regions, it captures the peak and seasonality of KBDI over most regions fairly well, adding confidence for the analysis of future projections. Results show that the regional mean KBDI in the future will be greater than the maxima of KBDI in the historic period for more than 90 d over all seven subregions, and 65 d in Alaska. High-KBDI events (>600) increased in summer and fall over the SW by more than 40 d. The findings are, however, different from Weatherly and Rosenbaum (2017), who statistically downscaled 12 GCMs and found that category 4 (KBDI > 750) fires over most of the western coastal region are decreasing, and that those east of the Rockies are increasing. These differences in high KBDI changes are perhaps driven by the differences in the temperature and precipitation changes projected by different downscaling approaches, indicating that improved assessment of high KBDI-indicated large fire risk relies on the reduced uncertainty in predicting extreme temperature and precipitation. Similar increases over the NW, SGP, and SE are also found in this study. Over regions that used to have low wildfire potential, such as the MW, SE, and NGP, there are large increases in periods with high KBDI. Broader areas with high wildfire potential are also present over the entire country in all four seasons. Although the changes in both temperature and precipitation affect the KBDI changes, the change in precipitation mostly lowers the KBDI, and warming is the main contributor to the KBDI increases in magnitude, frequency, and intensity. This finding agrees with previous studies (Liu et al 2013, Dennison et al 2014) that examine both KBDI and fire activities using weather variables and satellite data, although the present study demonstrates the changes in much higher spatial resolution.
Although the KBDI has been widely used and shown to correlate strongly with fire burned area (Abatzoglou and Williams 2016), there are limits for KBDI. For example, KBDI is limited by the field capacity, which is assumed to be 200 mm (8 inches; Keetch and Byram 1968), but this is not always true because it depends on geolocation, soil types and depths, and other factors. Moreover, KBDI was calibrated based on the environmental and climatic features of southeastern CONUS, so the constant parameters may not always apply to other places—in particular those with lower annual rainfall, which may cause wildfire potential to be underestimated. In addition to temperature and precipitation, wind is also an important variable that affects fire behavior. Therefore, other indices such as the FWI and McArthur forest fire danger index (Mcarthur 1967) may be investigated in terms of their relationships with fire activity and behavior. Another fire index, which considers a fuel mode map and more directly accounts for the moisture content of vegetation in fire prone regions and determines the inflammability of the vegetation, may also be examined to study the outbreak and spread of wildfires. We acknowledge the limitation with KBDI. However, it does not change the main findings of this study, such as the long-term increase of KBDI over the SW and NW in the past 36 years, which demonstrates the change of environmental conditions in favor of the severe fire activities occurred in the past; and the increase in future high-KBDI (>600) events over all sub-regions, which quantifies the 'tail' behavior of KBDI distributions and demonstrates different geographic features from the seasonal and annual mean KBDI changes.
An important question is does a high fire index like KBDI always correspond to an actual wildfire event? Or, what is the relationship between fire indices and fire occurrence as well as fire activity? Dolling et al (2005) calculated the KBDI for a 20 year period and then tested on a monthly time scale on four major Hawaiian Islands in terms of total area burned. A strong relationship between the KBDI and fire activity on the islands of Oahu, Maui, and Hawaii was found. Correlation between KBDI (as well as several other indices) and area of forest burned have been also well established by Abatzoglou and Kolden (2013) and Abatzoglou and Williams (2016) over the western US. More comprehensive studies of the relationship between fire index and fire activity are needed over a large domain such as the CONUS, because as we illustrated, regions that used to have low fire risk may become more prone to wildfire in future under the new climate environment, mostly because of temperature rise. We conducted a preliminary investigation into the correlation between PRISM-derived KBDI and an observational dataset of wildfire activity over seven sub-regions across CONUS during 1984–2017 (in the Supporting Information). A significant correlation is found between the KBDI and the observed total burned area, wildfire count, and average burned area in most regions with Pearson's correlation coefficients between 0.34–0.69 at a 95% confidence level (table S5). Moreover, the annual burned area over SW, NW, and SGP (prone to large wildfires) significantly correlates with the frequency of high KBDI (>600) values (figure S8), with correlation coefficients between 0.37–0.48; the correlations over the other four sub-regions are also positive (table S6). It supports the rational of using KBDI > 600 for investigating the behavior of large wildfires. These findings demonstrate that fire indices such as KBDI are valuable, despite the simplicity, they do provide a way to describe the risk potential of fire activities over most of the US.
In addition to the fire indices, there are physics-based wildfire models that could be investigated, which are more complex and can simulation more fire features than just the fire indices (Rabin et al 2017, Hantson et al 2020). However, the physical-based models are more expensive computationally and subject to uncertainties depending on inputs and processes represented (Hantson et al 2020). The complexity of fire risk assessments could also benefit from advanced statistical models or deep neural networks (Sayad et al 2019). It is challenging to link the fire activity to fire indices or environmental drivers, each of which accounts for various processes occurring on different spatial scales that makes it difficult to collocate the data (Satir et al 2016). Such issues may be better addressed using deep learning strategies.
Acknowledgments
This work is supported by the Laboratory Directed Research and Development program of Argonne National Laboratory provided by the U.S. Department of Energy (DOE) Office of Science under Contract No. DE‐AC02‐06CH11357. EKB was also supported by the U.S. DOE Office of Science, Office of Workforce Development for Teachers and Scientists as part of the Science Undergraduate Laboratory Internships program in summer 2019. YF acknowledges the support of the U.S. DOE Office of Science, Office of Biological and Environmental Research, Atmospheric System Research (ASR) program and Earth System Model Development (ESMD) program. All of the analysis was performed by using the computing cluster (Bebop) operated by the Argonne's Laboratory Computing Resource Center.
Data availability statement
The data that support the findings of this study are available upon reasonable request from the authors.