

Abstract
Summer 2018 in the United Kingdom (UK) was its joint hottest on record and the associated impacts raise questions over societal resilience to extremes of this magnitude or greater occurring in upcoming years. Better information on the current likelihood of extreme and unprecedented events feeds into improved understanding of risk, relevant for policy and contingency planning. However, making robust estimates of likelihood is difficult given that extremes in the historical record are few by definition. We overcome this by using a large ensemble of initialised climate model simulations to assess the chance of exceeding summer 2018 temperatures in the current climate and find it to be ∼11% each year, although a weak circulation bias may mean this estimate is conservative. This likelihood has increased sharply over the last few decades. A one in 100-year event would bring summertime temperatures to the UK of approximately 1 °C above 2018, an anomaly similar to that of the notable hot summer of 1976. Subsetting the large ensemble enables characterisation of the dynamics around hot summers, and investigation of possible remote influences. Several circulation patterns bring warm temperatures to the UK, and it is likely that influences from different remote regions are active or dominant in different years. We present evidence suggesting roles for tropical precipitation anomalies via extratropical wave trains. Circulation anomalies associated with wet conditions in the Caribbean project particularly strongly onto the hot UK summer conditions, with a weaker signal from the tropical Pacific consistent with developing La Niña. We also highlight possible influence in some years from springtime high sea ice anomalies in the Sea of Okhotsk and low anomalies in the Barents/Kara seas. Building on this, we use new experiments that isolate the effects of opposing springtime sea ice anomalies in the two regions and find a causal relationship with the summertime circulation over the North Atlantic and northern Europe.
Export citation and abstract BibTeX RIS

Original content from this work may be used under the terms of the Creative Commons Attribution 4.0 license. Any further distribution of this work must maintain attribution to the author(s) and the title of the work, journal citation and DOI.
1. Introduction
In 2018, the United Kingdom (UK) experienced its joint warmest summer on record with a whole-season (June-July-August, JJA) mean of 15.8 °C, and some individual locations recording their highest ever daily temperature maxima (McCarthy et al 2019). Among the impacts of high temperatures are increases in air pollutants (Kalisa et al 2018), heat-related deaths (Arbuthnott and Hajat 2017, McCarthy et al 2019), crop failure (Vogel et al 2019) and increase in severity of wildfire (Sibley 2019). These impacts raise questions over our preparedness for and resilience to events of this nature. Improved information on the likelihood of climate extremes has the potential to benefit policy- and decision-making, and there are a number of scientific tools available now that engage with different aspects of the issue (McCarthy et al 2019), including event attribution (Stott et al 2016, Yiou et al 2020) and probabilistic climate projections (Sexton et al 2012, Harris et al 2013, Lowe et al 2018). Here, using summer 2018 temperatures as motivation, we address another facet of the problem: how likely are we to see an event of this magnitude—or even greater—occurring in the near future? Having available estimates of the present-day likelihood of extremes is desirable for two principal reasons: to assess current vulnerabilities and inform actions to increase resilience, and to provide an improved baseline against which near-term predictions and longer-term climate projections can be measured. However, one of the difficulties in characterising the chance of climate extremes is that events of this nature are by definition rare in the observational record, which may not include the full range of climate states possible within this time period. This hampers our ability to make robust estimates of the current likelihood of extreme or unprecedented events based on the observed record alone.
This paper describes the application of the UNSEEN (UNprecedented Simulated Extremes using ENsembles, Thompson et al 2017) method to hot summers in the UK to make an improved assessment of the likelihood of extremes in the current climate. We overcome the difficulties presented by the lack of observations through the use of a large initialised model ensemble. This provides a set of many more simulated instances of summer than are available from the observations, and represents alternative possible outcomes to the single one that was experienced each year. This set better samples events such as 2018 or the notable hot summer of 1976 as well as unprecedented yet plausible extremes under the current climate.
Investigations into the dynamics of summer 2018 have highlighted the influence of a positive summer North Atlantic Oscillation (SNAO, Folland et al 2009) in the observed seasonal anomalies and the potential role of stationary Rossby waves in synoptic anomalies (Drouard et al 2019, Kornhuber et al 2019). Evidence from a number of recent studies on European summer climate extremes suggest influence from remote sources that modify the large-scale circulation over Europe, including the tropics (Cassou et al 2005, Wulff et al 2017, O'Reilly et al 2018) and the Arctic (Screen 2013, Wu et al 2013, Coumou et al 2018). We investigate these potential mechanisms behind hot summers in the UK using the large ensemble of dynamically consistent simulations.
2. Model and observations
The Met Office decadal prediction system (Dunstone et al 2016) uses the Hadley Centre global coupled model HadGEM3-GC2 (Williams et al 2015), which has an atmospheric grid resolution of ∼60 km in midlatitudes, and ocean resolution of 0.25°. The prediction system has two hindcast ensembles of 40 members each for the period 1960 to 2018, one initialised in May and the other in November. The JJA season is therefore forecast at lead times of 2–4 and 8–10 months, respectively. The ensembles together give a total count of 4720 summers (59 × 40 × 2), almost two orders of magnitude greater than the pool of observed summers (59) for the same period.
Observations of UK summer temperatures come from the Met Office UK national temperature series (HadUK‐Grid version 1 dataset, Hollis et al 2019), which was re-gridded to the model grid resolution. To manage the UK coastline, the proportion of land within coastal gridboxes from both model and observations was taken into account and masked—or designated as sea—where land fraction, or fraction of available data, was below 30%. For atmospheric circulation comparison, global sea level pressure is taken from the Japanese 55-year Reanalysis, JRA-55 (Kobayashi et al 2015).
3. UNSEEN and the likelihood of exceeding summer 2018 temperatures
Fundamental to UNSEEN is that the model ensemble members can be regarded as multiple realisations of the real world. In other words, the distribution of model ensemble members and observations should be indistinguishable and interchangeable. This is determined through a comparison of characteristics of the modelled and observed distributions of summer temperatures according to a range of statistical tests (Thompson et al 2017, 2019). The model ensemble is sampled by bootstrapping with replacement across the 80 members each year to give 10 000 proxy time series of the same length as the observations, 59 years (1960–2018). These are used to produce a distribution of statistics: mean, standard deviation, skewness and kurtosis, against which the single observational estimate is compared. If the observational statistic lies within the central 95% of the model distribution, it is deemed indistinguishable from the observations.
Upon testing, a systematic cool bias of the order tenths of a degree was found in the model, which was significant according to the fidelity tests, and which was part of a widespread cool bias over Europe. A simple adjustment to the mean has no effect on the variability and other characteristics of the model distribution and so a constant shift was applied to the ensemble members based on the model ensemble mean bias. The bias was calculated, and the mean shift applied separately for each of the two ensembles from the May and November start dates (∼0.2 °C and ∼0.7 °C, respectively).
Over the full period of the hindcast set, 1960–2018, in line with global change, there is a significant warming trend in UK summer temperatures, which is 0.025 °C per year in the observations. In order to retain the full set of summers, with their information on extremes, the temperature timeseries were detrended. This was done by applying to the observations and each member of the ensemble a simple linear trend based on the ensemble mean of 0.026 °C per year (with a 95% confidence interval of 0.016–0.036 °C per year). All data were pivoted on the final point on the trend line—the fitted 2018 value—making the ensemble representative of the current climate and enabling a focus on the internal variability of the climate system in the present day. In the analysis that follows in sections 4 and 5, all variables were detrended to the fitted 2018 climate in the same way. Using a linear detrend does not remove low-frequency variability, and we wish to retain the effect of different phases of e.g. Atlantic Multidecadal Variability as representative of the current and near-future climate. The model and observed timeseries before and after the trend adjustment are shown in figure 1(a). With the pivot around the last point (fitted 2018) on the trend line, the 2018 temperature is unchanged by the detrend—both in absolute terms, and as an anomaly relative to the current climate. However, it does alter the magnitude and rank of the historical events, making summer 1976 the clear warmest as an anomaly relative to the current climate. This implies that experienced today, a 1976-type summer would be much warmer than 2018, which is still a hot summer, but lies 7th in the detrended record for this period.

Figure 1. Application of UNSEEN to UK summer temperatures. (a) Timeseries of UK mean JJA temperatures in the observations and model. Dashed lines show the series prior to detrending. Black lines are observations, pink lines the ensemble mean and grey lines the ensemble members. Horizontal lines mark the highest observational values pre- and post-detrend; model events greater than these are unprecedented. (b) Fidelity testing of the model against observations. Left-hand sub-panel displays normalised distributions of JJA mean temperatures in the observations (grey) and model (pink). Right-hand sub-panels show the distribution of statistics of the 10 000 model sampled series, with the black line indicating the observational statistic, with position (%) within the model distribution in the title. The observed mean statistic lies in the centre of the model distribution by construction. (c) UNSEEN estimate of likelihood of exceeding summer 2018, with central estimate in dark green and 95% confidence interval obtained via bootstrap resampling of the ensemble in pale green. Dotted line indicates the magnitude, relative to summer 2018, of a one in 100-year event. (d) Change in likelihood of exceeding 2018 over time, calculated each year from the ensemble adjusted to represent that year's climate. 95% confidence intervals calculated as before.
Download figure:
Standard image High-resolution imageFollowing this treatment of the model and observational data the model was found to be indistinguishable from the observations for each of the statistical tests (figure 1(b)). The set of 4720 simulated summers is now used to assess potential extreme summers.
The UNSEEN estimate of the likelihood of an unprecedented extreme, exceeding 2018 summer temperatures, is 11.3% in the current climate, with 95% confidence interval 10.4% to 12.3% (figure 1(c)). The notable hot summer of 1976 was very slightly cooler in absolute terms than 2018, and UNSEEN gives a 13.7% chance of exceeding this temperature. However, expressed as an anomaly relative to the current climate, 1976 is a very extreme event (figure 1(a)). At 1 °C above 2018, the chance of exceeding the 1976 anomaly is very small, just below the one in 100-year level (figure 1(c)).
Given that there is a trend over the period from 1960 to present day, an interesting question to consider is how the chance of 2018 summer temperatures has changed over time. By taking successive years on the linear trend line as the detrend pivot point, the ensemble can be adjusted to represent the climate of each year in turn. Then, the corresponding likelihood of exceeding 2018 temperatures can be calculated. This approach places the focus on how an incremental rise in background temperatures affects the likelihood of extremes rather than, for example, low-frequency variability over the period. The resulting curve (figure 1(d)) shows that the chance of exceeding summer 2018 temperatures has increased rapidly in the last decades—from <1% in the 1960s to ∼10% in the 2010s.
An improved baseline probability against which future predictions can be measured is valuable to assess current risk. The Met Office issues a seasonal outlook each month based on predictions from the GloSea5 seasonal prediction system (MacLachlan et al 2015) that gives quintile probabilities for UK temperatures against the 1981–2010 World Meteorological Organization climatological period. The UNSEEN detrended set of summers can be categorised according to the 1981–2010 quintile thresholds for JJA temperatures. However, 1981–2010 is far from current climatology because <5% are in the coolest quintile and ∼40% are in the warmest quintile. This further demonstrates the change in the baseline chance of hot or cool summers and the difficulty of using observational records alone to assess the probability of current extremes.
4. Anomalous atmospheric circulation
The UNSEEN model ensemble comprises a large, dynamically consistent set of conditions that enable the dynamics around hot summers to be investigated. To examine characteristics of the circulation during hot summers, we sub-select the ensemble based on UK summer temperature in the first instance (a similar approach was used in Thompson et al 2019). To make a direct comparison with the surface circulation anomalies associated with the top 10 warmest UK summers in the observational record—the warmest 17% of available years—we choose the warmest 17% from the model ensemble, which gives a set of 802 events (figure 2). Thereafter in section 5 we select the warmest 5% of UK summers in the ensemble (1 in 20-year events), which provides a set of 236 events through which to examine anomalies associated with hot extremes, and cast light on possible influence from regions remote from the UK.
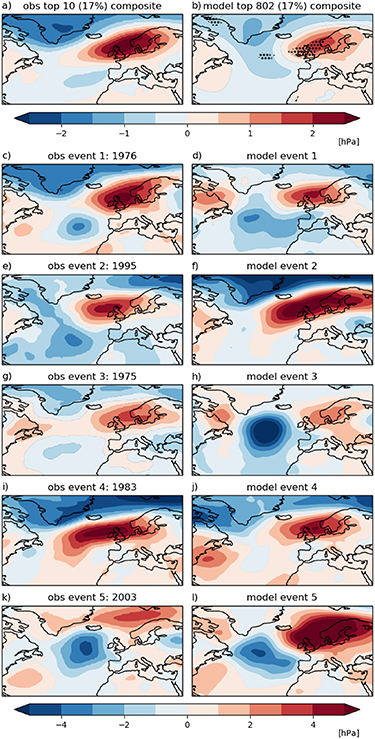
Figure 2. Detrended MSLP anomalies (hPa) in JJA associated with hot UK summers. (a) Composite of warmest 10 summers (17%) in observations since 1960; (b) composite of warmest 802 (17%) summers in the model ensemble. Stippling indicates where there is a significant difference with the observations at the 95% confidence level, obtained through bootstrap sampling of 10-event means from the set of warmest 17% of UK summers. (c)–(l): Top 5 individual events from observations (left) and model (right).
Download figure:
Standard image High-resolution imageFigure 2 shows the mean sea level pressure (MSLP) anomalies associated with the warmest summers over the UK, selected from the set of detrended observed and simulated UK summer temperatures. Through sub-selection, common features of hot summer circulation in the model and observations emerge and can be compared, as well as allowing an examination of some of the individual circulation patterns that bring high temperatures to the UK.
Both the mean of the top 10 warmest summers since 1960 from the detrended UK JJA observational temperature series, and warmest 17% of summers from the detrended ensemble set show similar patterns, with anomalous high pressure over the UK and northern Europe (figures 2(a) and (b)), and lower pressure to the north and west. The composite MSLP anomalies are smaller in the model compared with the observations, with differences significant over the UK and North Sea at the 95% confidence level (figure 2(b)), although not at the 99% level. This indicates that there is a weak bias in circulation anomalies associated with high UK temperatures. An inspection of individual events within the hot summer set reveals diversity in the patterns responsible for high temperatures in both model and observations. The top 5 individual events (figures 2(c)–(l), show that some observed and modelled summers (e.g. Figures 2(c), (f) and (i)) are dominated by a SNAO pattern. Summer 2018 has a strong positive SNAO index, the highest in the 1960–2018 period (Kendon et al 2019). Others, such as 2003 (figure 2(k)), have a different seasonal mean pattern, with low pressure anomalies not over Greenland but in the North Atlantic (Black et al 2004), a pattern that also appears in the model ensemble (e.g. Figure 2(h)). These cases also demonstrate that high pressure does not have to be centred over the UK in order to produce high temperatures (see, particularly, figure 2(k)), but the associated southerly or southeasterly winds draw warm air across the country. One hot European summer season may contain more than one dominant pattern (Cassou et al 2005, Drouard et al 2019). Intra-seasonal variations are not considered here, but the evidence from observed events and the model ensemble suggests that several circulation patterns can generate UK summer extremes.
5. Remote influence on high pressure over UK
Composite anomalies of 500 hPa geopotential height (z500, zonal mean removed) from the warmest 5% of simulated UK summers have a wave-like structure (figure 3(b)). Rossby waves from one or more sources could therefore influence the development and persistence of high-pressure anomalies over the UK, and this section investigates some possible sources.
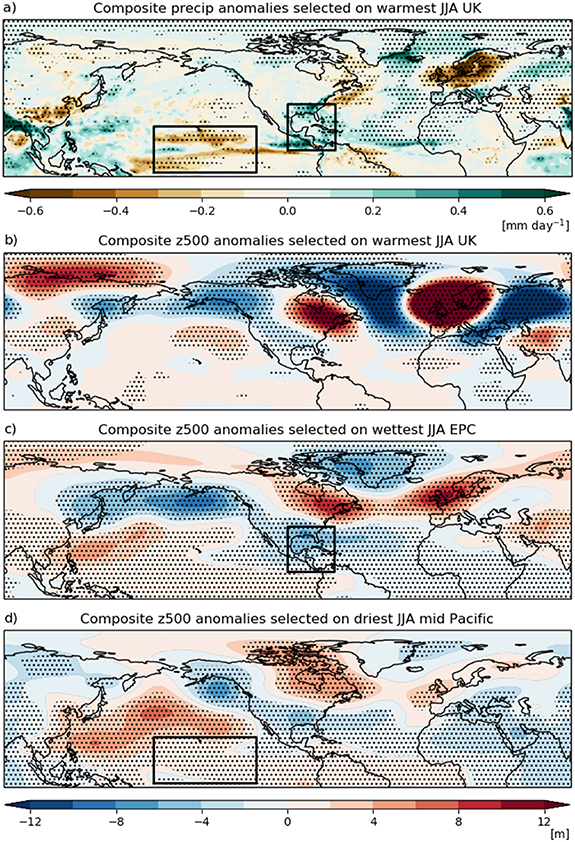
Figure 3. Subsetting the ensemble to characterise anomalous atmospheric circulation (all variables detrended). Each composite comprises the top 5% (236) events in the ensemble. (a) JJA composite precipitation anomalies (mm day−1) and (b) composite 500 hPa geopotential height (z500) anomalies (m) selected on top 5% warmest UK summers. Black boxes indicate domains used to subset top 5% of events on basis of precipitation anomalies, giving JJA composite z500 anomalies selected on (c) wet East Pacific and Caribbean (EPC) (7°N–36°N, 100°W–70°W) and (d) dry mid Pacific (7°S–22°N, 185°W–120°W). Stippling marks the 90% confidence level, obtained via a t-test.
Download figure:
Standard image High-resolution image5.1. Tropical influence
A number of recent studies have shown that Rossby waves emanating out of the tropics can influence the extratropics in both winter (Scaife et al 2017, Soulard et al 2019, Yiu and Maycock 2019) and summer (Cassou et al 2005, Wulff et al 2017, O'Reilly et al 2018). Tropical precipitation and associated high-level divergence anomalies can lead to Rossby wave generation (Hoskins and Karoly 1981, Sardeshmukh and Hoskins 1988). Composite precipitation anomalies based on the warmest 5% of UK summers (236 events) are shown in figure 3(a). There are several areas of significant anomalies around the tropics, and through sub-setting the ensemble, the circulation patterns associated with these anomalies can be examined. To illustrate this, two regions are selected for further investigation, marked by black boxes on the composite precipitation anomalies map (figure 3(a)): East Pacific and Caribbean (EPC) and mid Pacific. There is a physical relationship between these regions (Giannini et al 2001) but ensemble mean timeseries of rainfall are only modestly correlated,  , indicating a degree of independence. The full ensemble is sub-selected on the basis of JJA rainfall within each box—wettest 5% in the case of the EPC and driest 5% in the case of the mid Pacific, 236 events in each instance—and used to form composite circulation patterns associated with anomalies in these regions. A comparison can then be made with the composites selected on hot UK summers (figure 3(b)).
Selecting for high EPC rainfall gives the circulation pattern signature of a wet EPC region (figure 3(c)). It is associated with a Rossby wave that has high z500 anomalies over northeastern North America and northern Europe, including strong positive anomalies over the UK. As expected, the anomalies are lower in magnitude than those selected on hot UK summer temperature (figure 3(b)), but the patterns clearly show resemblance.
The anomalously dry central and wet tropical western Pacific basin is indicative of a developing La Niña, conditions that Ding et al (2011) associated with the circumglobal teleconnection (CGT) pattern in the extratropical northern hemisphere. There are similarities between the hot summers pattern and the CGT, including high z500 anomalies over the UK and northeastern North America. The mid Pacific region of significant dry precipitation anomalies is selected to illustrate wave behaviour associated with variability in the tropical Pacific. The composite z500 anomalies show a wave coming out of the Pacific basin (figure 3(d)), projecting onto the hot summer circulation pattern (figure 3(b)). There is a region of significant positive z500 anomalies over the UK, but the signal is weaker than from wet EPC conditions.
While composite analysis is an imperfect tool for drawing conclusions about possible relationships, which is discussed in more depth in section 6, it is nevertheless an important indicator. This analysis suggests that there are sources of Rossby waves driven by different parts of the tropics during the summer season, and that the associated anomalies project onto the hot summers pattern. It therefore seems likely that tropical precipitation anomalies in these regions play a role during some hot summers in the UK, in agreement with previous studies (Cassou et al 2005, Ding et al 2011).
5.2. Sea ice influence
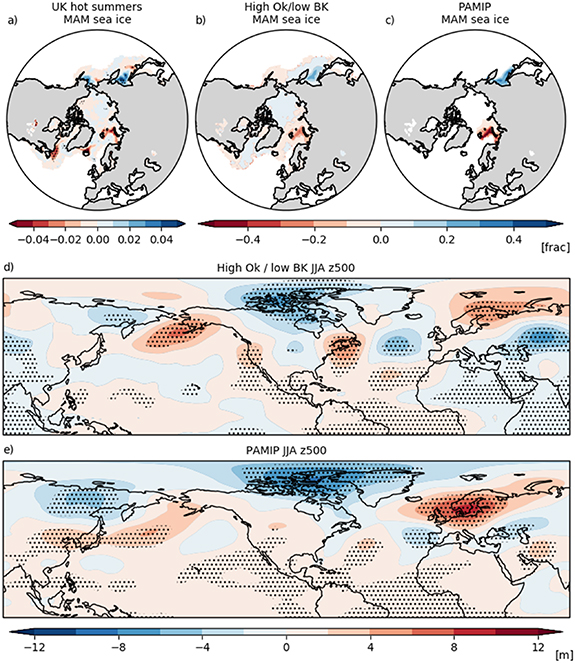
It has been suggested that changes in sea ice can affect midlatitude summer circulation patterns (Coumou et al 2018), including over the North Atlantic/European sector (Wu et al 2013, Screen 2013, Petrie et al 2015). Sea ice anomalies in the spring season (March-April-May, MAM) prior to hot summers in the ensemble show higher sea ice than normal in the Sea of Okhotsk and lower sea ice than normal in the Barents/Kara seas (figure 4(a)). The atmosphere may be particularly sensitive to sea ice anomalies in these regions (Honda 1999, Sun et al 2015, Screen 2017), although the influence in the summer season is unclear, especially given the summertime ice-free state of lower latitude areas.
Figure 4. Influence of sea ice anomalies on the summertime circulation. (a) Detrended fractional sea ice anomalies in the spring season (march-april-may, MAM) prior to hot summers. It is based on the November start hindcast ensemble only, as MAM is not available from the May start dates. This provides an ensemble of half the size previously described: the set of warmest 5% of summers comprises 118 events. There are high and low sea ice anomalies in the Sea of Okhotsk and Barents/Kara seas, respectively. Stippling indicates significant difference from the full set of summers (90% confidence level); (b) detrended fractional MAM sea ice composite anomalies selected on high MAM sea ice in Sea of Okhotsk and low sea ice in Barents/Kara seas (c) fractional MAM sea ice anomalies in the combined PAMIP experiments, future Barents/Kara seas minus future Sea of Okhotsk. Note the difference in scale between (a) and (b)/(c); (d) detrended JJA composite z500 anomalies (m) selected on MAM sea ice (figures 4(b)) and (e)) JJA z500 anomalies (m) associated with the PAMIP combined experiments (figure 4(c)). Stippling indicates significant difference from zero (90% confidence level).
Download figure:
Standard image High-resolution image
To explore whether the sea ice anomalies in the ensemble could have an influence on the summer circulation over Europe, we use two different approaches. First, as before, we form composites based on high sea ice anomalies in the Sea of Okhotsk and low anomalies in the Barents/Kara seas in MAM (figure 4(b)), the OBK subset. This is done by making two subsets, based on sea ice anomalies of the correct sign in each region, then selecting the events in common. To obtain the top 5% of the ensemble in which both conditions are true, the magnitude of anomalies in each region is relaxed to ∼0.7 standard deviations from the mean. The difference in magnitude of anomalies (figures 4(a) against (b) reflects the condition upon which the ensemble is selected: summer UK temperatures versus springtime Arctic sea ice. Second, we take advantage of Polar Amplification Model Intercomparison Project (PAMIP) (Smith et al 2019) experiments. Specifically, we use two regional atmosphere-only time-slice experiments, 300 member ensembles of HadGEM3-A (Williams et al 2015), in which all boundary conditions are set to present day apart from a reduction in the regional sea ice concentration: in the Sea of Okhotsk in one case and the Barents/Kara seas in the other. These isolate the response of the atmosphere to reductions in sea ice in each region, and establish causality of the response to sea ice. Full details of the experimental design are given in Smith et al (2019). We use these two experiments in combination to obtain the effect of opposing sea ice anomalies in the two regions. Subtracting the Sea of Okhotsk experiment from the Barents/Kara seas experiment gives a combination of high sea ice anomalies in the Sea of Okhotsk and low sea ice anomalies in the Barents/Kara seas in MAM (figure 4(c)), under the assumption of linearity. The PAMIP MAM sea ice anomalies (figure 4(c)) are stronger than those in the springtime prior to hot UK summers in the UNSEEN ensemble (figure 4(a)) but the patterns match well, and they are of similar magnitude to the composite selected on sea ice (figure 4(b)).
The summer season z500 anomaly pattern based on the OBK subset is shown in figure 4(d) and the PAMIP experiments in figure 4(e). There are features common to both around the northern hemisphere, although there is a relative shift in the high z500 anomaly centre over northern Europe. In the OBK composite, there are positive z500 anomalies over northeastern North America and negative anomalies in the central North Atlantic, smaller than but similar to those seen in the UK hot summers composite (figure 3(b)). The positive anomaly centred over Scandinavia is east of that in the hot summers composite, but it resembles some of the individual events shown in figure 2, and low-level winds over the UK associated with the OBK pattern (not shown) are from a warm southerly direction. The hot summers composite is sampling different event types and influence from multiple sources, one or more of which may be active or dominant in any one year. The OBK composite is indicating that in some years there could be a role for this anomaly pattern of sea ice across the MAM to JJA transition.
The benefit of the PAMIP experiments is that they isolate the effect of sea ice anomalies on the atmospheric circulation. In spring, a Rossby wave is set up, marked by negative z500 anomalies over the cool surface above high sea ice anomalies and the opposite conditions over low sea ice anomalies (not shown). The model integrates these circulation anomalies forward, and by JJA (figure 4(e)) there are significant positive z500 anomalies over the UK with negative anomalies to the northwest, which is a feature of the UK hot summers pattern (figure 3(b)). The response is a combination of the two sea ice regions, although separately both do produce significant positive z500 anomalies over the UK (not shown). The PAMIP results demonstrate that in a clean experimental setup, opposing sea ice anomalies in the Sea of Okhotsk and the Barents/Kara seas have influence over the North Atlantic/European circulation during summer and may contribute to high pressure over the UK in some years.
6. Summary and discussion
Through UNSEEN, we provide an estimate for the likelihood of exceeding the high temperatures of summer 2018 of ∼11% per year in the current climate. This is consistent with independent methods of establishing present-day likelihood, with an event attribution ensemble and with the probabilistic simulations of the UK Climate projections (UKCP18) project (McCarthy et al 2019). In a warming climate the occurrence of episodes of extreme heat increases (Coumou and Rahmstorf 2012), and estimates based on the UNSEEN approach indicate the chance of summer 2018 temperatures has risen sharply from 1960 to present day. Warm UK summers that occurred with a 1-in-5 frequency in the 1981–2010 period now occur with double that frequency. The weak bias in circulation anomalies associated with hot UK summers may mean that estimates of likelihood are conservative. The results presented here rely upon a single model, and a similar analysis with other models would help to assess confidence in the findings and reduce single-model dependency.
The likelihood estimate is for seasonal mean summer temperature, and as such it does not give information about other aspects of weather and climate during a summer season—such as rainfall, humidity or night-time temperatures—that would also be important for impacts. Summer 2018 was persistently dry (Dunstone et al 2019) as well as hot; hot humid conditions, for example, would have changed the nature or severity of impacts (Russo et al 2017). Individual hot summer events, in both the observations and the model, show several circulation patterns that give rise to hot UK summers, which could potentially bring a range of varying conditions to the UK.
Subsetting the large ensemble offers insight into the characteristics of the anomalous atmospheric circulation associated with hot summers in the UK, as well as potential remote influences. It is worth noting that the weak circulation bias may be related to the underestimation of the signal-to-noise ratio seen in seasonal to decadal forecasts (Eade et al 2014, Dunstone et al 2016, Scaife and Smith 2018), and further investigation of its causes and effects would be a valuable development of this work with respect to the assessment of likelihood of extremes, to the physical understanding of the circulation patterns behind hot UK summers, and to model evaluation and intercomparison. The z500 composite anomaly pattern connected with the warmest 5% of UK summers in the ensemble (1 in 20-year events) has a wave-like structure. Tropical precipitation and sea ice anomaly fields provide the basis for investigating sources of disturbance that project onto that z500 pattern.
Composites selected on regions of tropical precipitation anomalies indicate that Rossby waves are able to emanate from different parts of the tropics during boreal summer. Previous work has suggested a relationship between developing La Niña conditions and the CGT (Ding et al 2011), which has strikingly similar features to the hot summers pattern, including positive z500 anomalies over the UK and northeastern North America. In the hot summers precipitation composite there are dry anomalies in the mid Pacific, in line with La Niña, and the associated wave projects onto the hot summers pattern, although z500 anomalies are weak over the UK. Consistent with the findings of Cassou et al (2005) in their study of European heat waves, wet conditions in the EPC region appear to be of particular importance, with a strong associated wave emanating out of the region and marked by high z500 anomalies over the UK. However it is somewhat at odds with the Wulff et al (2017) investigation of a phenomenon that they term the Summer East Atlantic pattern, which they relate to hot, dry conditions over parts of northern Europe, centred on Germany, and which is similar to some of the individual hot summer event circulation patterns described in section 4. While they also highlight the role for a summertime tropically forced extratropical Rossby wave train, they connect this feature with dry anomalies in the Caribbean and wet in the tropical mid Pacific. There are differences in the centre of interest (UK/Germany) that may partially explain the discrepancies between these studies, and there are individual cases in the hot UK summers subset that display similar characteristics to the Wulff et al study, but further investigation to understand better the inconsistencies is needed.
While composite analysis provides an important tool for pointing towards possible relationships, the diversity in constituent events means there is not a definitive single hot summer circulation pattern. In addition, one or more influence could be active, or could dominate over others, in any one hot UK summer. Furthermore, composites based on potential drivers do not present a clean picture of their influence, and to isolate the effect on the atmosphere of anomalies in the selected regions would require sensitivity experiments. Therefore, even where relationships exist the expectation is not to find a reproduction of the hot summers pattern, but that composites selected on tropical rainfall or Arctic sea ice project onto that pattern, suggesting influence in some years.
The benefit of using a combination of subsetting the large ensemble together with a clean experimental setup has enabled us to describe a causal influence from sea ice. Most recent studies (e.g. Screen 2013, 2017, Petrie et al 2015, Coumou et al 2018) investigating the atmospheric response to changes in sea ice have focused on losses, given the observed downward trend in sea ice over the last few decades. There is, however, large interannual variability in the sea ice, in the model as well as the observations, and the atmosphere may be sensitive to the pattern of sea ice forcing (Smith et al 2019). The OBK composite circulation anomaly pattern projects onto some aspects of the hot summers pattern, but high z500 anomalies are centred not over but to the east of the UK. This is similar to some of the individual hot summer events, indicating that springtime sea ice anomalies could play a role in some years, while also highlighting limitations in the composite analysis approach as noted above. Building on this, the new PAMIP regional experiments allow an exploration of causal influence. Opposing sea ice anomalies in the Sea of Okhotsk and Barents/Kara seas produce a summertime pattern similar to the OBK composite, and with positive z500 anomalies over the UK and negative anomalies to the northwest, features also present in the hot summers z500 pattern. This finding is particularly interesting since in the PAMIP experiments it is the atmosphere that transfers the signal from the sea ice between spring and summer, and further work is needed to understand the mechanisms. In addition, these results are from a single model, and to help assess how robust they are, a comparison could be made with the same experiments from other PAMIP models.
Climate extremes have significant impacts on society and ecosystems today, and robust information on the chance of extreme or unprecedented events has the potential to make a valuable contribution in policy and contingency planning. As our results demonstrate, UNSEEN overcomes the limitations of the observations in enabling better estimates of likelihood while also bringing new insight into the physical mechanisms of extremes.
Acknowledgments
This work was supported by the Met Office Hadley Centre Climate Programme funded by BEIS and Defra, the EU H2020 APPLICATE project (GA 727862) and UK Research & Innovation (UKRI) Strategic Priorities Fund UK Climate Resilience programme, which is co-delivered by Met Office and NERC on behalf UKRI partners AHRC, EPSRC, ESRC. The authors thank the two anonymous reviewers, whose comments and suggestions have improved the text.
Data availability statement
The data that support the findings of this study are available upon reasonable request from the authors.