

Abstract
We present a long-term assessment of precipitation trends in Southwestern Europe (1850–2018) using data from multiple sources, including observations, gridded datasets and global climate model experiments. Contrary to previous investigations based on shorter records, we demonstrate, using new long-term, quality controlled precipitation series, the lack of statistically significant long-term decreasing trends in precipitation for the region. Rather, significant trends were mostly found for shorter periods, highlighting the prevalence of interdecadal and interannual variability at these time-scales. Global climate model outputs from three CMIP experiments are evaluated for periods concurrent with observations. Both the CMIP3 and CMIP5 ensembles show precipitation decline, with only CMIP6 showing agreement with long term trends in observations. However, for both CMIP3 and CMIP5 large interannual and internal variability among ensemble members makes it difficult to identify a trend that is statistically different from observations. Across both observations and models, our results make it difficult to associate any declining trends in precipitation in Southwestern Europe to anthropogenic forcing at this stage.
Export citation and abstract BibTeX RIS

Original content from this work may be used under the terms of the Creative Commons Attribution 4.0 license. Any further distribution of this work must maintain attribution to the author(s) and the title of the work, journal citation and DOI.
1. Introduction
A wide range of studies have reported a decrease in average precipitation in Mediterranean regions, with pronounced drying observed since the 1960s (Longobardi and Villani 2010, Gudmundsson and Seneviratne 2016). Decreasing trends have been reported for winter (Caloiero et al 2011, Hoerling et al 2012), spring (Paredes et al 2006) and summer (Deitch et al 2017, Caloiero et al 2018). Other studies have attributed this decline in average precipitation and the corresponding increase in the frequency of dry events to anthropogenic forcing in the Mediterranean area or in Southern Europe (Hoerling et al 2012, Barkhordarian et al 2013, Gudmundsson and Seneviratne 2016). Gudmundsson et al (2017) suggested that these anthropogenic effects could impact the hydrological cycle across Southern Europe, inducing significant streamflow decreases over large parts of the region.
However, it is well-recognized that observed hydroclimatic trends are largely influenced by the study period (Hannaford et al 2013). Consequently, where possible, it is important to analyse precipitation trends from a long-term perspective to contextualise trends from shorter records. Based on extended multi-decadal data (>100 years), some investigations have highlighted the presence of strong interannual and interdecadal variability in Southwestern Europe (Esteban-Parra et al 1998, Brunetti et al 2006, Camuffo et al 2013). Therefore, decreasing trends in precipitation for Southwestern Europe since the 1960s may also be seen in the context of long-term climate variability rather than anthropogenically forced change. In addition, previous assessments of trends in long-term records have been subject to limitations given the sparse spatial coverage of observations and lack of consistency in the assessment of data quality. For example, some studies have indicated that a considerable percentage of precipitation series in Southwestern Europe may be impacted by data errors, incompleteness, and/or temporal inhomogeneities, which could bias identified trends (González-Rouco et al 2001, Begert et al 2005, González-Hidalgo et al 2011, Reiser and Kutiel 2011, Turco and Llasat 2011).
Reliable long-term assessment of precipitation changes is of particular importance for water resources in the region given the strong decline in water availability over recent decades (García-Ruiz et al 2011, Vicente-Serrano et al 2019). To address this gap, this study aims to revisit long-term (1850–2018) precipitation series in southwestern Europe by compiling and analysing monthly time-series of precipitation, gridded databases and simulated precipitation from different climate model experiments (CMIP3, CMIP5 and CMIP6). In addition to identifying trends from long-term records across the region, we examine whether it is possible to attribute possible long-term changes to anthropogenic forcing based on climate model simulations for concurrent periods.
2. Material and methods
2.1. Data
We used long-term meteorological records derived from station observations and gridded datasets. Station observations were taken from the dataset recently developed by Vicente-Serrano et al (2020a), comprising 58 stations for the region spanning the years 1870–2018 and 22 spaning 1850–2018. The series were collected from national meteorological agencies in different countries (Spain, Portugal, France and Italy) and the Global Historical Climatology Network (GHCN) dataset (Menne et al 2012). The stations used have short gaps (less than 5% of the total record missing) and the dataset has been quality assured and homogenised. Quality control was based on a comparison of the anomaly of precipitation at each candidate station with the closest five neighbouring stations following a careful visual assessment in order to trim suspicious values, while keeping 'real' extreme values. To perform homogeneity testing, HOMER (HOMogenization software in R) was used (Mestre et al 2013) in which each candidate series was compared with data from the best 5 correlated series. Most of the series were free of monthly inhomogeneities and in the few that showed a significant break, a correction factor was applied. The series showed high spatial coherence, delineating homogeneous regions in terms of temporal variability (Vicente-Serrano et al 2020a).
Figure S1 (available online at stacks.iop.org/ERL/15/094070/mmedia) provides the location of stations for different years of record available. Trends in precipitation from station observations were compared with those derived from a set of global and continental gridded climate datasets, including the Climate Research Unit (CRU) dataset TS v. 4.03 (Harris et al 2014), the Global Precipitation Climatology Centre (GPCC) dataset (Schneider et al 2014) and the E-OBS v. 20.0e dataset from the European Climate Assessment & Data (ECA&D) (Cornes et al 2018).
A common approach to characterize the general temporal variability of climate in a specific region is to use a single regional series, created using data from all available sites. This approach has been adopted in different precipitation studies in the Mediterranean (Hoerling et al 2012, Gudmundsson and Seneviratne 2016, Hanel et al 2018). Although such composite series do not adequately reveal 'real' variability for specific areas, especially in regions with diverse climatic and geographical conditions like Southwestern Europe, we adopted this approach for a better comparison with results from earlier research. Regional series were created from observational data using Thiessen polygons (Jones and Hulme 1996). Following this method, a weighted average was calculated considering the total area represented by each station, so that stations located in areas with a high density of stations received less weight, compared to those situated in areas with sparse density. As the station density varies over time (supplementary figure 1), two regional series were created: 1850–2018 and 1870–2018 (note that both series contain a different set of stations from 1870 to 2018). Regional precipitation series from the different gridded datasets (CRU, GPCC and ECA&D) were obtained using a simple arithmetic average of the gridded points within the entire study domain.
We also compare long-term precipitation trends from station observations with those derived from climate model outputs for concurrent years. To do so, we used historical simulations from the CMIP3 (Meehl et al 2007), CMIP5 (Taylor et al 2012) and CMIP6 (Eyring et al 2016) experiments. While the evolution of climate models from CMIP3 to CMIP6 includes improvements in model physics, parametrizations and spatial resolution, suggesting more reliable results from CMIP6 (even if the spread of the models is not reduced), we opted to include all experiments in our assessment. A primary reason for doing so is the different historical forcing included in each CMIP experiment, making it possible to explore whether there is an agreement between these different historical experiments in simulating long-term changes in precipitation for the study domain (Knutti and Sedláček 2013). For CMIP3, we used precipitation data from 25 models corresponding to the 20c3 m experiment and spanning the period from 1900 to 1999. We used data from the SRES A1B experiment for more recent decades (2000–2018). For CMIP5, we used precipitation from 47 models corresponding to the historical experiment from 1860 to 2005 and the RCP8.5 experiment from 2006 to 2018. For CMIP6, we used the data from 25 models corresponding to the historical experiment from 1850 to 2014, and the ssp585 experiment from 2015 to 2018. The list of models included is shown in table S1. Data corresponding to the SRES A1B (CMIP3), RCP8.5 (CMIP5) and ssp585 (CMIP6) scenarios were used, as the evolution of the CO2 concentrations considered in these scenario match well with the observed concentrations for the years considered. For each model in the three simulation experiments (CMIP3, CMIP5 and CMIP6), we obtained regional precipitation series by means of the average of the gridded points within the entire study domain.
We stress that it is not expected that the precipitation anomalies simulated by climate model experiments will be completely consistent with those identified from observational data. However, given that models are forced by observed atmospheric composition and external radiative forcing, they should be able to reproduce long-term precipitation trends, which should summarize long-term changes in these forcing conditions. Numerous studies have similarly assessed anthropogenic influence by comparing precipitation trends from observations and those from model simulations (Donat et al 2016, Knutson and Zeng 2018).
Rather than employ just the ensemble mean from each CMIP experiment, we alo employ the individual model simulations to characterise the forced signal, internal variability and important differences in the mean and variance of individual runs (figure S2). Consequently, the series of observations oscillate within the range of variability of the model ensembles (figure S3), which makes difficult to establish a comparison of the possible long and short term trends between observations and model simulations. Following Knutson and Zeng (2018), we base our comparison on standardized series in which both observed and modelled precipitation were transformed to z-series with a mean of zero and standard deviation of one. A two-parameter Gamma distribution was used for this purpose following the recommendation to calculate the Standardized Precipitation Index (Mckee et al 1993). We also derived an annual and seasonal multi-model mean standardized series for each region from each of the three CMIP experiments. These multi-model mean series are assumed to capture the external forcing common to all models, with the same mean and standard deviation as the observed series, thereby facilitating the comparison of trends. Given the different length of the series, we used a common reference period (1901–2018) to calculate the parameters of the Gamma distribution.
2.2. Trend analysis
To assess the magnitude of change in seasonal and annual precipitation, we applied a linear regression model. The slope of the regression between the series of time (independent variable) and precipitation (dependent variable) indicated the amount of change (mm/year), with higher slope values suggesting greater change and vice versa. Seasons were defined as: winter (DJF), spring (MAM), summer (JJA) and autumn (SON). The statistical significance of trends was assessed using the non-parametric Mann-Kendall statistic, which measures the degree to which a trend is consistently increasing or decreasing. Statistical significance was tested at the 95% level (p < 0.05). The Mann–Kendall statistic is advantageous compared to parametric tests, as it is robust to outliers and does not assume any underlying probability distribution of the data. A modified version of the Mann–Kendall statistic was also applied to account for the possible effect of autocorrelation, which might be present in the series and could affect the significance of the trends (Hamed and Ramachandra Rao 1998). This statistic returns the corrected p values after accounting for the temporal pseudo-replication. In addition to this classical approach to trend detection, we also computed the amount of change in precipitation using the relative amount of change (%) rather than the absolute amount (mm). This approach allows for spatial comparability between different stations and gridded points. Maps of trend results were produced for the relative amount of change (%), using a linear regression model that considers the start and the end years of the study period. Finally, since the amount of change and statistical significance of the defined trends are sensitive to the selection of the study period (Hannaford et al 2013), we analysed trends for all possible temporal combinations, with a minimum period of 30 years in length between the start and end years of the study period (1851–2018). The results were illustrated by means of heat maps, where the magnitude of change in mm/year and the trend significance are shown.
2.3. Comparison between trends in observations and model simulations
We compared the trends in the annual and seasonal precipitation series from observations and model simulations The purpose of this analysis was not to attribute possible trends to antrophogenic forcing but to check the consistency of model simulations relative to observations. Comparison was undertaken for periods starting in 1850, 1870, 1891 and 1901 and finishing in 2018, consistent with when the different available observational datasets start. We compared the magnitude of trend from observations with the trend in all available models from the three CMIP experiments. We used a statistical test to determine the equality of slope coefficients obtained from observations and model simulations (Paternoster et al 1998), with the difference between the regression slopes assessed at the 0.05 level. This method allowed us to compare the magnitude of observed trends with the distribution of trends obtained by the different models.
3. Results/discussion
A key characteristic of the long-term annual precipitation series for Southwestern Europe is the absence of major trends, but rather strong interannual variability (figure 1). The regional annual averages of the different precipitation gridded datasets (CRU, GPCC and ECA&D) show good agreement with regional averages obtained from the meteorological stations, with Pearson's r coefficients above 0.90. The averages obtained from all the available stations from 1870 show variability similar to the regional series generated with the 22 available stations from 1850. Very dry years are evident in the 1850s, 1920s, 1940s and 2010s. Dry years are also well identified in the annual series derived using the CRU and GPCC datasets. In addition, these two datasets show strong temporal agreement with the annual and seasonal regional series obtained using observations from 1870 onwards. Agreement is also very good with the annual regional series generated from the ECA&D dataset, but in this case there is some negative bias relative to the observed station series during the thirty year period starting in the 1980s.
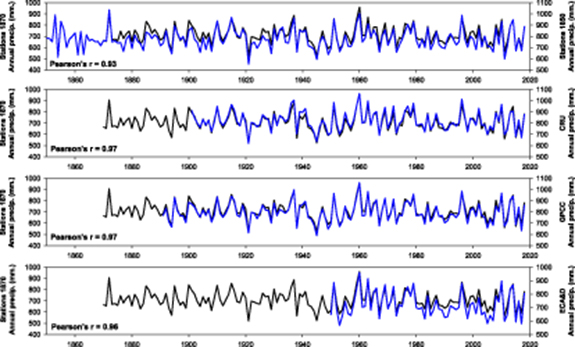
Figure 1. Evolution of the regional annual precipitation series over Southwestern Europe from the different datasets. Black line corresponds to the regional precipitation series obtained from the precipitation stations with available data from 1870. Blue lines correspond to the rest of regional precipitation series.
Download figure:
Standard image High-resolution imageThe magnitude of trends identified from the different regional series depends on their length and period of analysis (figure 2). There are no long-term significant trends identified from the different regional annual precipitation series. This suggests that for the Southwestern European region as a whole, there is no consistent long-term trend in annual precipitation, at least over the past 170 years. Significant trends that are identified are not persistent and are recorded during relatively short periods with alternating sign. Thus, significant decreasing trends tend to be identified from the 1920s to the 1950s and from the 1960s to the 2000s, while significant increasing trends tend to appear between the 1880s and 1920s and from the 1940s to the 1980s. Notably, annual precipitation from the ECA&D series shows a stronger decreasing trend from the 1960s to present than the other datasets.

Figure 2. Heat maps of running trends in regional annual precipitation series from the different datasets, considering different periods with a minimum of 30 years. X and Y-axes indicate the start and end years of the time slices, respectively. The scale indicates the magnitude of the trend (mm/year) based on the slope of the linear regression analysis. Dotted lines indicate periods with a significant trend (p < 0.05).
Download figure:
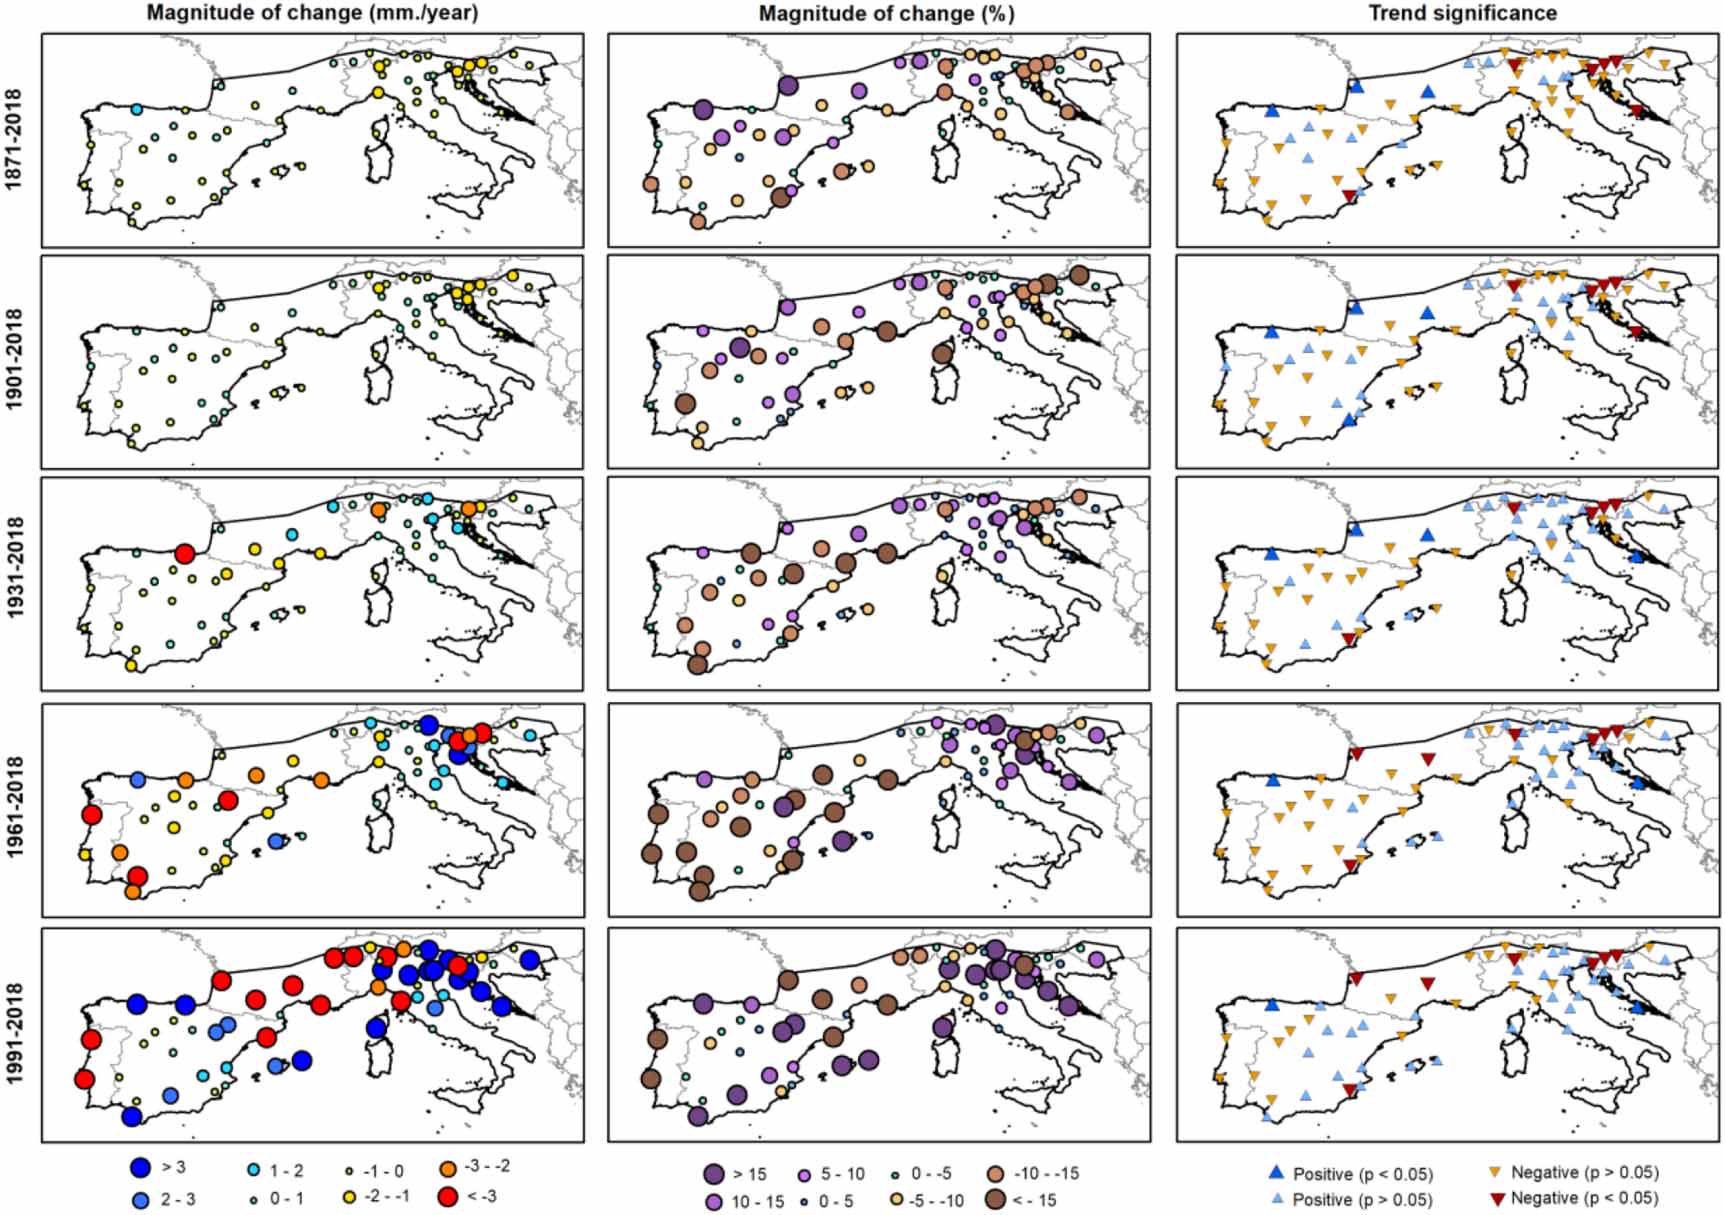
Standard image High-resolution imageSpatially, the magnitude and statistical significance of trends in annual precipitation show important differences among stations and periods of analysis (figure 3). The percentage of statistically significant trends is small over the different periods (table 1). Similar results are found for the CRU and the GPCC datasets, which show some decreasing trends in parts of central Italy and Southern Iberia from 1901 to 2018 and a more general decrease from 1961 to 2018 (figure S4). However, trends are not statistically significant in most regions. Again, the largest decreases are obtained with the ECA&D dataset from 1961 to 2018, characterised by a large decrease of precipitation in Southern France and Northern Italy, and particularly the Iberian Peninsula, where large areas show negative and significant trends. These findings from ECA&D are not consistent with those from any of the other series we analyse and raise questions as to the homogeneity of the dataset for the region.

Figure 3. Annual precipitation trends in the station based observations for periods starting in 1871, 1901, 1931, 1961 and 1991 and ending in 2018. The magnitude of change is given in mm/year and in %.
Download figure:
Standard image High-resolution imageTable 1. Percentage of land area within the domain showing positive and negative trends in annual precipitation, as derived from the different precipitation datasets, based on the statistical significance thresholds.
| 1871 | 1901 | 1931 | 1961 | 1991 | |
|---|---|---|---|---|---|
| Meteorological Station | |||||
| Positive (p < 0.05) | 10.8 | 12.1 | 15.7 | 7.9 | 7.9 |
| Positive (p > 0.05) | 17.2 | 25.5 | 35.6 | 24.6 | 43.3 |
| Negative (p > 0.05) | 63.9 | 55.5 | 45.5 | 56.4 | 37.7 |
| Negative (p < 0.05) | 8.1 | 6.9 | 3.3 | 11.1 | 11.1 |
| CRU | |||||
| Positive (p < 0.05) | 2.8 | 0.2 | 0.0 | 0.7 | |
| Positive (p > 0.05) | 32.8 | 20.7 | 13.4 | 54.7 | |
| Negative (p > 0.05) | 51.8 | 73.2 | 83.4 | 43.9 | |
| Negative (p < 0.05) | 12.7 | 6.0 | 3.2 | 0.6 | |
| GPCC | |||||
| Positive (p < 0.05) | 6.5 | 0.7 | 2.2 | 2.9 | |
| Positive (p > 0.05) | 38.4 | 37.7 | 22.5 | 52.9 | |
| Negative (p > 0.05) | 40.6 | 57.2 | 70.3 | 43.5 | |
| Negative (p < 0.05) | 14.5 | 4.3 | 5.1 | 0.7 | |
| ECA&D | |||||
| Positive (p < 0.05) | 3.3 | 6.9 | |||
| Positive (p > 0.05) | 19.5 | 52.9 | |||
| Negative (p > 0.05) | 55.6 | 34.4 | |||
| Negative (p < 0.05) | 21.6 | 5.9 | |||
As the strongest and most widespread negative trends in annual precipitation over the period 1961–2018 in the ECA&D dataset affects the Iberian Peninsula, this opens an opportunity for comparison with a recently developed, quality controlled and homogenised gridded precipitation dataset for Spain, based on more than 2000 meteorological stations for the period 1961–2018 (Vicente-Serrano et al 2017b). ECA&D precipitation series are not homogenised (Hofstra et al 2009), while the density of stations for the region changes over time (Cornes et al 2018). The correlation between the regional series of annual precipitation for Spain obtained from the ECA&D and from the Spanish dataset is high (Pearson's r = 0.94), but the series obtained from the ECA&D dataset shows a stronger precipitation decrease (15.5%) than the regional series generated from the Spanish dataset (3.9%) over the period 1961–2018 (figure S5). In the ECA&D dataset more than 20% of Spain shows a negative and significant trend in annual precipitation, versus only 3.6% in the quality assured Spanish dataset. We hypothesise that the low number of meteorological stations available for Spain in the ECA&D dataset (≈ 50) (Cornes et al 2018), together with the lack of homogeneity testing explain this divergence. These issues may also explain why regional studies focusing on high-density homogenised national datasets in Spain (González-Hidalgo et al 2011) and Italy (Brunetti et al 2006, Fatichi and Caporali 2009) do not show such large negative trends during the second half of the twentieth century, as suggested by the ECA&D.
Our results clearly show that the statistical significance of trends in annual precipitation in Southwestern Europe is strongly dependent on the study period and that no statistically significant long-term trends can be detected at least from the last 170 years of observations. Several studies have suggested circulation mechanisms that explain interannual and decadal precipitation variability in Southwestern Europe. Large scale patterns like the North Atlantic Oscillation (NAO), the Eastern Atlantic Pattern (EA) or the Scandinavian Pattern (SCAN) strongly control the interannual variability and thus short term precipitation trends over Southwestern Europe (Trigo et al 2009, Sousa et al 2011, Ferrari et al 2013, Vergni et al 2016, Mellado-Cano et al 2019). Other regional patterns like the Western Mediterranean Oscillation or the Mediterranean Oscillation also control precipitation trends in more specific areas of the study domain (Lopez-Bustins et al 2008). The Atlantic Multi-decadal Oscillation also explains decadal variability of precipitation in the region (Mariotti and Dell'Aquila 2012). Precipitation decreases during the period 1960–2000 are compatible with the evolution of the NAO (Paredes et al 2006, Matti et al 2009, Altava-Ortiz et al 2011), characterised by predominantly low values during the 1960s that would explain the general wet conditions recorded in the region. Predominantly high NAO values in the 1980s and 1990s are consistent with more frequent dry years.
At the seasonal scale, the different regional precipitation series also show strong agreement (figure S6) and are also characterised by strong interannual variability from 1850 to 2018. Thus, periods of high and low precipitation are recorded over the entire period and, as with annual precipitation, statistically significant trends are typically only representative for short periods of time (figure S7). For example, the decrease in winter precipitation is only significant in Southwestern Europe for the period 1960–2000. On the contrary, the analysis of the long term regional series from 1850 and 1870 shows a long-term positive trend in winter precipitation, which is statistically significant for tests starting between 1850 and 1890 and ending in 2018. As with annual precipitation, the ECA&D dataset returns stronger negative trends for winter and summer precipitation from the 1960s to the 2000s, relative to other datasets. Spatially there are some differences in the sign and magnitude of seasonal precipitation trends, based on the observed station series (figure S8, table S2) and the gridded datasets (figures S9–S11). Nevertheless, with the exception of the identified decrease in summer precipitation in Southern Iberia between 1961 and 2018 and the decrease in autumn precipitation in Southern France and Northern Italy between 1991 and 2018, the trends are not significant. We note that given the dominant influence of the subtropical Azores high, summer precipitation in Southern Iberia is close to zero (Ninyerola et al 2007), so small changes in the total precipitation could drive statistically significant changes. Otherwise, the spatial patterns in seasonal trends are consistent between the different gridded datasets and station based observations, while being consistent with other studies that have analysed seasonal precipitation trends over different regions of Southwestern Europe for various study periods (Brunetti et al 2006, González-Hidalgo et al 2011, Río et al 2011, Ramos et al 2012, de Luis et al 2014, Scorzini and Leopardi 2019).
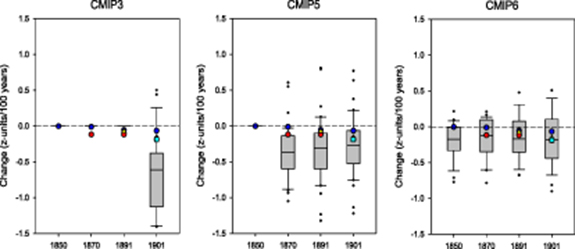
The CMIP3 and CMIP5 simulation experiments show large differences with the observed long-term changes in annual precipitation. The distribution of the linear regression slope coefficients in the CMIP3 models from 1901 to 2018 shows a large decline of precipitation in most models. This reduction is stronger than in the different observational datasets (figure 4). In the CMIP5 models, the pre-dominantly declining trends are also stronger than the trends in observations for the periods starting in 1870 and 1891. On the contrary, in the CMIP6 ensemble the distribution of the slope coefficients is closer to observations and only shows greater decreases than observations in the period 1850–2018. For the periods starting in 1870, 1891 and 1901, the magnitude of the trend in observations is within the range of trends obtained by 50%–75% of models that show modest precipitation reductions.
Figure 4. Box plots showing the distribution of the magnitude of annual precipitation trends in the three CMIP model simulation experiments for four different periods. The central horizontal line shows the median, the shaded box is defined by the 25th and 75th percentiles, the whiskers represent the 10th and 90th percentiles and the dots represent the cases above or below the 10th and 90th percentiles. Color points represent the magnitude of change in observational datasets; blue circle: stations 1850, red circle: stations 1870, yellow triangle: GPCC, cyan square: CRU.
Download figure:
Standard image High-resolution image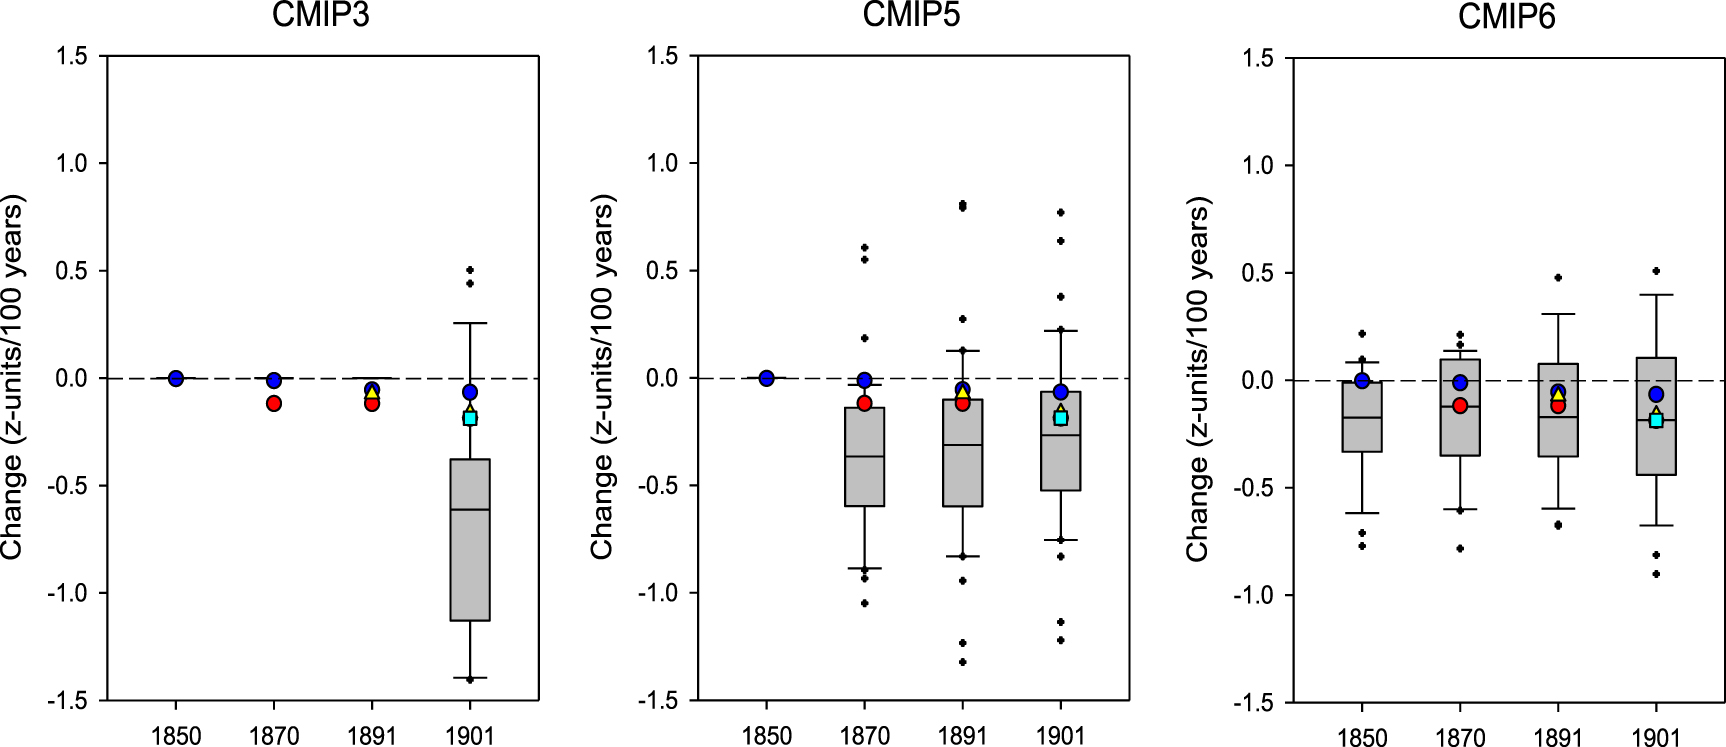
The standardized ensemble mean annual precipitation series, obtained from CMIP6 models, shows stationarity from circa 1870 to 2018, but CMIP3 and CMIP5 mean ensembles show a general decrease (figure S12). Seasonally, the models tend to produce smaller precipitation increases than the observations in winter, when the observations show a weak positive trend (Figure S13). CMIP3 and CMIP5 models seem to capture adequately the observed trends during spring and autumn; summer and winter trends are only well reproduced in CMIP5 since 1901. CMIP6 models agree with observations for all seasons and periods, except for winter, which is only well captured since 1901.
Although CMIP3 and CMIP5 models show larger decreasing long-term trends than observations, in the majority of cases they are not significantly different than the observations (p > 0.05) (figures S14 and S15). This is because the strong interannual variability of precipitation in the observations and model simulations drive high standard errors in the regression slopes. In the CMIP6 ensemble only a few models (< 5%) show a trend statistically different from the observations. It seems that the quality of the models in reproducing the observed trends in Southwestern Europe has improved along the successive CMIP phases. Moreover, the dominant sign and significance of the long-term seasonal and annual precipitation trends in the model simulations tend to agree with observations in most cases (table S3).
According to observations and the more recent models, the region does not show robust long-term decreasing trends in precipitation, at least since 1850, with strong interannual and interdecadal variations as the dominant feature in observations, and high internal variability in model simulations (Lionello and Scarascia 2018, Seager et al 2019). This makes it difficult to attribute a possible antrophogenic signal hypothesised in prevous studies. Although the spatial domain of our study is smaller than in previous attribution studies over the Mediterranean (Hoerling et al 2012) or Southern Europe (Gudmundsson and Seneviratne 2016), we stress that in the region covered here, these studies also suggested persistent decreases in average precipitation. Such changes are not detected in observational datasets analysed in our study nor in the most recent CMIP6 model simulations.
The lack of significant decreasing trends in observed seasonal and annual precipitation trends is highly relevant for understanding different environmental and hydrological processes associated with precipitation decreases in recent decades. For example, an increase in the frequency of forest decay episodes and reductions in forest growth in Southwestern Europe (Carnicer et al 2011, Camarero et al 2015), together with large declines in streamflow have been observed over recent decades (López-Moreno et al 2011, Vicente-Serrano et al 2019). According to our results, the explanation for these processes lies, at least partially, in factors other than precipitation decline. In relation to streamflow reductions, agricultural and livestock abandonment in large mountain headwaters (Sanjuán et al 2018), have encouraged natural revegetation over recent decades (García-Ruiz and Lana-Renault 2011, García-Ruiz et al 2011), increasing water consumption by forests and shrubs (Martínez-Fernández et al 2013, Schumacher et al 2019). In addition, large increases in water demands from economic activities, has dramatically reduced streamflow downstream of large irrigation polygons (López-Moreno et al 2004, Vicente-Serrano et al 2017a).
Although precipitation in the Mediterranean region has not declined in the long-term, the climate dryness has increased in the last four decades as a consequence of anthropogenically forced warming in the region, with an increase in aridity (Fu and Feng 2014, Vicente-Serrano et al 2020b) and stronger drought events during dry years given enhanced Atmospheric Evaporative Demand (AED) (Stagge et al 2017, González-Hidalgo et al 2018, García-Herrera et al 2019). However, we stress here that this increase in dryness is independent of the precipitation evolution in the region. In addition, a change in precipitation intensity which could also have some role on the dryness, does not show an homogeneous spatial and temporal pattern over the region. For example, different studies in the Iberian Peninsula have shown that there is not an increase in precipitation intensity, and the total precipitation amount is distributed more regularly among precipitation days (López-Moreno et al 2010, Gallego et al 2011, Acero et al 2012, Serrano-Notivoli et al 2018). Nevertheless, an increase in precipitation intensity has been suggested in Southern France and areas of Italy (Brunetti et al 2004, Piccarreta et al 2013, Ribes et al 2019). This could contribute to enhancing drying given smaller precipitation totals during low and moderate rainy days, and the enhanced increase of AED during non-rainy days (Rivoire et al 2019).
4. Conclusions
This study provides a robust assessment of variability and change in precipitation in Southwestern Europe based on long-term, high quality series and model simultations over the entire region. The use of these series allows us to conclude that there is a lack of statistically significant trends in long-term records. Precipitation in Southwestern Europe is characterised by strong interannual and decadal variability at the annual and seasonal scales, showing no long-term trends when using different precipitation datasets. Moreover, we have shown that trends depend crucially on the period of record and dataset used, while the variability in trend magnitude and direction across seasons suggests different driving mechanisms. The observed decrease in precipitation between 1961–2000 in the ECA&D data is likely affected by uncertainties introduced in this dataset due to the low density of stations, their varying densities over time, and the lack of temporal homogeneity of some series. Consequently, it is important to develop quality-controlled and homogenised long-term datasets of precipitation and to secure reliable records that allow for a more robust assessment of long-term precipitation in the region.
CMIP3 and CMIP5 do not capture the observed trends well. However, CMIP6 models show strong agreement with observations, except in winter, for long-term periods, suggesting higher quality in the most recent experiments. This also suggests that it is not possible to consider a dominant long-term precipitation decrease based on model simulations. Assessments based on ensemble means from the different CMIP experiments could reinforce trends of dryness (Mariotti et al 2008, 2015) and the severity of drought events (Orlowsky and Seneviratne 2013) in this region in comparison to the information content available from the individual ensemble members.
Taking all these findings into consideration there is an urgent need to better understand the dynamic and thermodynamic mechanisms responsible for precipitation variability and change in the region. Given the importance of precipitation for water resources, social and economic well-being and environmental processes, a comprehensive understanding of the observed variability and change presented here is critical.
Acknowledgments
This work was supported by the research projects CGL2017-82216-R, CGL2017-83866-C3-3-R and PCI2019-103631, financed by the Spanish Commission of Science and Technology and FEDER; CROSSDRO project financed by the AXIS (Assessment of Cross(X)—sectoral climate Impacts and pathways for Sustainable transformation), JPI-Climate co-funded call of the European Commission and INDECIS which is part of ERA4CS, an ERA-NET initiated by JPI Climate, and funded by FORMAS (SE), DLR (DE), BMWFW (AT), IFD (DK), MINECO (ES), ANR (FR) with co-funding by the European Union (Grant 690462). Dhais Peña-Angulo received a 'Juan de la Cierva' postdoctoral contract (FJCI-2017-33652 Spanish Ministry of Economy and Competitiveness, MEC). Conor Murphy was supported by the Irish Environmental Protection Agency (Grant Nos. 2019-CCRP-MS.60). Marco Turco has received funding from the Spanish Ministry of Science, Innovation and Universities through the project PREDFIRE (RTI2018-099711-J-I00), which is co-financed with the European Regional Development Fund (ERDF/FEDER).
Author contributions
P-AD and V-SSM conceived research, V-SSM and P-AD perfomed the research, V-SSM, P-AD and EKA wrote the first draft of the manuscript, D-CF, FR, CM, TY, RT and MYL contributed with data inputs and analysis, G-HJC, CM, G-HR, RT and T-BM helped to provide essential interpretations of the results, A-BM and NI contributed with figure design. All authors contributed to writing and editing the manuscript.
Competing interests
The authors declare that they have no competing interests.
Data availability
Some of the data that supports the finding of this study are openly available (https://crudata.uea.acuk/cru/data/hrg/, https://www.dwd.de/EN/ourservices/gpcc/gpcc.html, https://www.ecad.eu/download/ensembles/download.php, https://esgf-node.llnl.gov/projects/cmip6/, https://esgf-node.llnl.gov/projects/cmip5/, https://esgf-node.llnl.gov/projects/cmip3/). The Long-term precipitation data and the gridded precipitation data for Spain that support the findings of this study are available from the corresponding author upon reasonable request. No new data were created or analysed in this study.