

Abstract
A crucial aspect of coordinated climate action is the ability to measure, attribute, report and verify the drivers of climate change not only globally, but down to national level. This requires the enhancement of current observation infrastructures around the world, particularly in less-studied regions such as the African continent. Methodological protocols play an essential role in assuring interoperability among existing and new monitoring stations and networks. However, although the availability and accessibility of the body of existing methodological knowledge is crucial to fill existing observational gaps in a harmonised and resource-efficient way, there are very few efforts documented to systematically compile and assess it. This work aims to identify environmental observation methodologies which, on one hand, are applicable in Africa and, on the other hand, compatible with ongoing international and European monitoring initiatives. It draws from a systematic inventory of 140 environmental methodological protocols related to the measurement and estimation of the main climate forcing components within the atmospheric, oceanic, and terrestrial domains. In order to identify existing methodologies readily applicable for various observational purposes in under-studied regions, the feasibility of these protocols was determined based on a basic assessment of the financial and human resources needed for their implementation. Finally, a harmonised approach is proposed to enhance observational capacity in Africa with the differentiation of at least two types of sites. 'Basic' sites, where highly feasible environmental measurements can be performed to improve spatial coverage of main biomes, anthromes, and land use types, and advanced 'key sites', where a large set of variables measured at a high temporal resolution would enable a better understanding of driving processes in representative systems and managements across the continent, albeit requiring the application of less readily feasible methodologies.
Export citation and abstract BibTeX RIS

Original content from this work may be used under the terms of the Creative Commons Attribution 4.0 license. Any further distribution of this work must maintain attribution to the author(s) and the title of the work, journal citation and DOI.
1. Introduction
With public, political and scientific awareness about anthropogenic climate change and its possible consequences increasing globally, countries around the world are slowly but surely initiating mitigation and adaptation measures. A crucial aspect of coordinated climate action is the ability to measure, attribute, report and verify the contributions to the main climate forcing components not only globally, but down to national level. This requires the development of appropriate research frameworks and corresponding observation infrastructures around the world. The most comprehensive approach to do so comes from the United Nations Framework Convention on Climate Change (UNFCCC), via the IPCC methodologies designed to report national inventories of GHG emissions and to track progress towards mitigation targets for all signatory countries (IPCC 2006, 2019). However, the spatial and temporal coverage as well as the accuracy of such bottom-up estimates is limited, especially in many developing countries where the scientific and financial capacity needed to improve these national inventories is restricted.
Recent studies emphasize the need to enhance ongoing monitoring and prediction efforts to improve our understanding of the complex feedback processes between climate change and atmosphere-land-ocean systems. For instance, Vicca et al (2018) highlighted the need for comparable nutrient cycling measurements, particularly for nitrogen and phosphorus given their influence on ecosystem functioning, and suggested a list of variables needed to be measured for inter-site comparison in parallel to ecosystem carbon (C) cycling monitoring. Similarly, Smith et al (2019) stated that one of the key barriers to implement and evaluate national soil C sequestration targets is the lack of a good monitoring, reporting and verification (MRV) platform for soil organic carbon (SOC). In fact, they reviewed the wide variety of methodologies available to measure SOC stocks and fluxes and formulated a list of operational recommendations to make such a MRV system support both current scientific and policy challenges. With regards to the conceptual design of environmental research infrastructures (RIs), Leip et al (2018) proposed an iterative GHG emission assessment system, where complementarity among monitoring techniques can lead to an improvement of emission factors and corresponding estimates of national GHG budgets. Overall, although these studies do not refer to specific guidelines to acquire needed observations, they agreed that methodological protocols are crucial to enable comparability across sites/systems/countries (Vicca et al2018), aggregate data spatially and temporally and assure transparency and reproducibility (Smith et al2019) over the whole MRV process.
In this regard, very few efforts have been made to compile and disseminate the knowledge that many researchers have developed over last decade to harmonise and standardise the methodologies utilized to estimate different climate forcing components. A synthesis exercise is currently under development to standardise field measurements in terrestrial global change experiments (Halbritter et al2020). Besides that, an advanced keyword search using the SCOPUS browser1 only yielded four publications over the last decade that synthesized methodological protocols for highly specialized disciplines that are not directly relevant to the observation main climate forcing components (Cornelissen et al2003, Pérez-Harguindeguy et al2016, Moretti et al2017, Dawson et al2018). We are not aware of further recent studies comprehensively synthesizing and assessing protocols dealing with climate-forcing related measurements and modelling as a whole. Therefore, although methodological protocols are the operational baseline from which scientific evidence with regards to climate change can be built, a collection and evaluation of corresponding methodological protocols is currently lacking.
The availability and accessibility of these methodological materials is particularly important to fill existing observational gaps in a harmonised way. Major gaps exist in developing regions, such as the African continent (Niang et al2014, 2018, López-Ballesteros et al2018 and Kulmala 2018). In this context, the EU H2020 funded project 'Supporting EU-African Cooperation on Research Infrastructures for Food Security and Greenhouse Gas Observations' (SEACRIFOG; www. seacrifog.eu) aims to develop a concept for a pan-African network of research infrastructures (RIs) for the systematic long-term in situ observation of the main climate forcing components, such as GHG sources and sinks together with their link with food security. Previous work includes the identification of essential variables to be measured in this future RI network together with an assessment of existing and planned infrastructural capacity and related data products (López-Ballesteros et al2018a, Beck et al2019). In line with the technical harmonisation efforts of the project, this work pursues the identification of methodologies, which, on one hand, are feasible also in the context of the African continent and, on the other hand, comparable and compatible with ongoing international and European monitoring initiatives. To this end, this work aims to collate existing harmonisation materials (i.e. methodological protocols) developed by the environmental research community to measure or estimate variables which are essential to quantify the main climate forcing components, e.g. GHG stocks and fluxes (Myhre et al2013). Subsequently, the feasibility of implementation of these protocols is evaluated in order to identify existing methodologies that could be utilised for various observational purposes in under-studied regions, such as the African continent
2. Material and methods
2.1. Protocols inventory
An inventory of methodological protocols was compiled between November 2017 and October 2018 to obtain a comprehensive overview of the methodologies and techniques that have been developed and used over the last two decades by the international and European research community to measure and estimate environmental variables across the terrestrial, atmospheric and oceanic domains. The point of departure for the selection of relevant protocols was a set of 58 environmental variables (see figure 1) which had previously been identified in line with the SEACRIFOG initiative to be essential for the quantification of the main climate forcing components in Africa (Beck et al2018, López-Ballesteros et al2018a). To be considered, each protocol had to be directly or indirectly related to the measurement of at least one of the essential variables. Regarding the date of publication, we only considered protocols published after 2000 to assure that these are reasonably up to date, hence collated protocols were published between 2004 and 2018, with the majority (∼80%) published within the last four years (2014–2018). Protocols were identified using a keyword search on the web-portals of international and regional research agencies, networks and projects related to environmental monitoring as well as through expert consultation within the SEACRIFOG consortium. Only open-access protocols/materials were considered. Several metadata attributes were collected for each protocol in order to characterise its content in a systematic way (see metadata glossary in table 1). The entire protocol inventory metadata is publicly available via the web-based 'SEACRIFOG Collaborative Inventory Tool' at https://seacrifog-tool.sasscal.org. In addition to information on the protocols, the tool contains information about SEACRIFOG essential variables as well as corresponding observation infrastructures and data products relevant to the African continent.
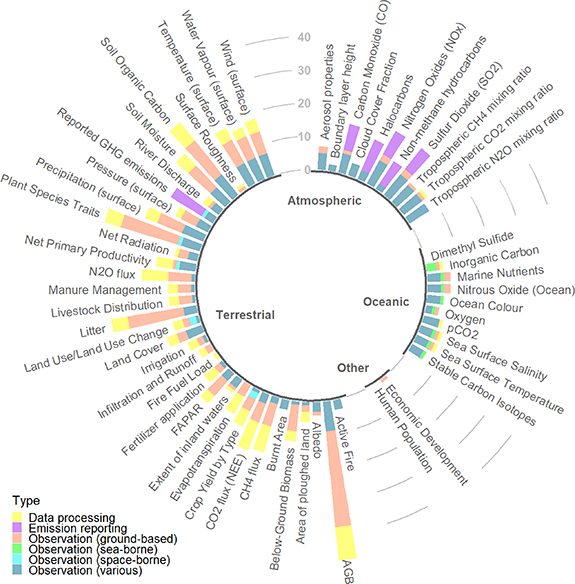
Figure 1. Number of protocols linked to each variable considered essential for the quantification of Africa's continental climate forcing. 'Type' refers to the main application of a given protocol, distinguishing between the different modes of observation, data processing and activity-based emission reporting. AGB = Above-Ground Biomass; FAPAR = Fraction of Absorbed Photosynthetically Active Radiation; NEE = Net Ecosystem Exchange.
Download figure:
Standard image High-resolution imageTable 1. Glossary of metadata attributes utilised to build the inventory of protocols.
| Metadata attribute | Definition | ||
|---|---|---|---|
| Doc IDmetadata | Identification number of each protocol in the inventory. Note that the use of the word protocol here can correspond to a text protocol but also to an algorithm or software program used to process data acquired using a specific technique. | ||
| Citation | DOI/ISBN/ISSN | Digital Object Identifier (DOI) or International Standard Book Number (ISBN) associated to each protocol. | |
| Author(s) | Name and surname(s) of the protocol author(s). | ||
| Publisher | Associated initiative, funding agency, journal or editorial that produced the protocol. | ||
| Title Year of | General title of the protocol. | ||
| publication | Year of the publication of the protocol. | ||
| Spatial coverage | Applicability | Geographical region or land use/cover in which the protocol was developed and/or applied (e.g. ICOS was developed and applied in Europe). | |
| Adoption | Geographical region or land use/cover where the protocol has been/can theoretically be adopted (e.g. ICOS protocols could in theory be adopted globally). | ||
| Temporal coverage | Characteristics of the measurements explained by the protocol in the temporal domain. The temporal coverage categories considered in this database are: continuous and discrete (i.e. manual measurements), when the application of a given protocol lead to the production of regular time series or observations/measurements at discrete point(s) in time. For strategic documents (e.g. implementation plans, design principles), the temporal coverage will correspond to the most representative one among the protocols developed by the same network/initiative. | ||
| Keywords (controlled | Variables | SEACRIFOG essential variable(s) (Deliverable 4.1) that can be measured or estimated by implementing a given protocol | |
| vocabularies) | Indirectly associated variables | SEACRIFOG essential variables (Deliverable 4.1) that are indirectly linked to a given protocol. Indirect variable association refers to approaches that do not directly measure an essential variable, but provides key information on driving processes or related measurement proxies. | |
| Global change ontologies | Main process(es) comprised in the broader concept of global change that can be partially investigated by using the methodology explained by the protocol. The global change ontologies considered in this database are: climate change, land-use change, biodiversity loss and management strategies (comprising mitigation and adaptation measures). | ||
| Domain | The earth system domain where the protocol is applicable. The domains considered in this database are: atmospheric, oceanic and terrestrial. In the present context, the latter includes the subdomain freshwater. | ||
| Discoverability | Application | The general use of the protocols considered in this database are: observation (i.e. description of the state of a given system through ground-based, space-borne, sea-borne or various types of measurements), data processing (includes any process for controlled data creation, maintenance, management, calculations or model estimations) and emission reporting. | |
| Reusability | Abstract | Brief description of the content of the protocol. | |
| Language(s) | Written language(s) in which the protocol is available. | ||
| Format | Type of protocol. The formats considered in this inventory are: guide (written document developed to inform the general research community), protocol (written document developed to standardise measurements within a given network), technical report (written document developed to inform about a specific task in a specific project). Apart from written documents, the inventory also include links to open-access databases (e.g. emission factor database), data sheets, software or models (i.e. code) that can be used to prepare and/or process data acquired using a particular technique. | ||
| Sustainability | The nature of the initiative behind the development of the protocol, meaning whether is a long- (i.e. initiatives with lifetime > 5 years) or short-term (i.e. projects with a lifetime ≤ 5 years) enterprise. This determines the reliability and obsolescence of the protocol in the future, conceived as a guideline for applying a given technique in order to produce related data. | ||
| Deposit URL | URL where the protocol can be directly downloaded. | ||
| Supplementary information URL | Main web-portal where protocols can be found, and in case the protocol has supplementary information, URL where it can be directly downloaded. | ||
2.2. Feasibility assessment
A preliminary assessment was performed in order to evaluate the feasibility of the reviewed protocols based on the following criteria:
- equipment costs (Ceq; i.e. instrumentation and other experimentation material costs)2
- operational costs (Cop; i.e. calibration and maintenance of equipment and experiments, annually)3
- installation effort (Ei; i.e. number of person*hours to setup the station or experiment)
- maintenance effort (Em; i.e. number of person*hours related to sampling frequency, in case of manual measurements, or routine repairs/calibrations in case of automated measurements)
- knowledge needed (K; none, low, medium or high)
- measurement mode (manual or automatic)
For this assessment, we considered only those protocols from the inventory that deal with ground-based and sea-borne observations (i.e. in situ), which equates to 82 out of the 140 protocols within the inventory. Although satellite data are complementary to in situ observations and essential for model building, spatial and temporal upscaling and even site selection, protocols related to remote sensing were excluded from the analysis since associated direct costs can be hardly derived from their respective documents. Likewise, data processing and/or activity-based emission reporting protocols were not considered in the analysis. Likewise, strategic/implementation plans from international RIs (e.g. WMO, GAW, WIGOS) and protocols reviewing many methodologies simultaneously or specifying data requirements (e.g. WMO ECVs requirements) were also excluded from the analysis because their implementation costs cannot be directly derived from the respective documents.
These criteria have been previously used by Halbritter et al (2020) and collectively agreed by the researchers consortium involved in the ES1308 ClimMani COST Action4 (Climate Change Manipulation Experiments in Terrestrial Ecosystems—Networking and Outreach). Generally, the assessment of the knowledge, financial and human resources required for the implementation of a protocol were derived from the information derived from the protocols reviewed, the research experience of the co-authors and from expert consultations within the SEACRIFOG consortium. The categories used to classify the protocols are relatively coarse because the related information is not available for all protocols and the resource requirements are to a certain extent context-dependent as stated by Halbritter et al (2020). The feasibility of protocol implementation was rated by using the categories presented in table 2 below. In those cases where there are several station classes (i.e. tier 1 and 2 stations), the feasibility assessment was performed on the station type with the minimum cost.
Table 2. Qualitative categories used for the assessment of protocols implementation feasibility. Costs and efforts refer to establishment and operation of a single observation site.
| Criteria | Categories | |||
|---|---|---|---|---|
| Equipment costs (Ceq) | € → < €1000 | €€ → €1000—€10 000 | €€€ → > €10 000 | |
| Operational costs (Cop) | ||||
| Installation effort (Ei) | None (N) | Low (L) | Medium (M) | High (H) |
| Maintenance effort (Em) | ||||
| Knowledge needed (K) | ||||
| Measurement mode | Manual measurement (MM) | Automatic measurement (AM) | ||
Additionally, we derived five indices in order to be able to judge each protocol's feasibility. Certainly, the construction of such indices is a largely arbitrary exercise, which nevertheless adds value in interpreting and ranking the protocols for a given context. For the purpose of this assessment, we build basic indices based on simple addition of the respective underlying indicators (table 2).
To calculate these indices, ordinal rating values ('None', 'Low', 'Medium', 'High') and cost ranges ('None', '€', '€€', '€€€') were firstly translated into numerical values (0, 1, 2, 3, respectively). The indicator 'Knowledge needed' received a double weighting as compared to others, since we consider knowledge an asset that requires both capital and human effort over extended periods. Afterwards, indices were calculated as follows:


The values for all indices were translated to a 0–10 scale. For II, OI, FC and HC, low values correspond to low financial and human resource needs for the implementation of a given protocol. When considering the feasibility index FI, low FI values correspond to low feasibility (i.e. high financial and human resources needs and accordingly high values for the other indices).
3. Results
3.1. Protocols inventory
The protocol inventory is publicly accessible at https://seacrifog-tool.sasscal.org and currently contains metadata for a total of 140 methodological documents in different formats such as guides, protocols, technical reports, databases, data sheets, software, code, and models. A synthesised inventory version is provided in table S1 (stacks.iop.org/ERL/15/075003/mmedia) of supplementary material to this publication.
Figure 1 illustrates the number of protocols in the inventory associated with each variable considered essential for the quantification of climate forcing across the African continent. Since a given protocol can be linked to more than one variable, the number of protocol-variable links (615 in total) indicated in figure 1 exceeds the number of protocols in the inventory (140). As more than half of the essential variables are related to the terrestrial domain, protocols linked to terrestrial variables dominate the inventory (73%) compared to the atmospheric (18%) and oceanic domains (9%).
For the purpose of this study, we considered the main application of a protocol, distinguishing between observation (ground-based, sea- and space-borne), data processing and activity-based emission reporting. In total, 77% of protocols in the inventory have observation (ground-based, sea-borne, space-borne or combinations thereof) as the main application, whereas 14% are focused on data processing and 9% refer to emission reporting approaches. As illustrated in figure 1, there are numerous protocols guiding observation as well as data processing for variables in the terrestrial domain. For variables in the atmospheric and oceanic domains, hardly any data processing protocols could be identified. Finally, protocols guiding emission reporting were identified for the main GHGs as well as for atmospheric concentrations of important precursors and other climate-relevant trace gases.
In terms of geographic scope, a third (47) of the protocols are considered applicable anywhere around the globe. These were developed by international institutions (e.g. CGIAR, FAO, GEOBON, ICRAF, IPCC, UNFCCC or WMO), global research networks focused on environmental monitoring (e.g. FLUXNET), global manipulation experiments (e.g. Drought-net, ClimMani COST Action) and other international projects or initiatives that have been completed (e.g. IOCCP or RECCAP). Another 19 (14%) protocols are also applicable globally, but refer to specific biomes such as tropical forests, mangroves, seagrass meadows, urban areas, etc (see table S1 in supplementary material for detailed information). The remainder of the protocols in the inventory (74 protocols; 53%) were developed with applicability for a certain world region only (e.g. ICOS protocols for the European continent). Only 11% (15) of the identified protocols were developed specifically to be applied on the African continent (e.g. the protocols developed by VitalSigns). However, note that protocols developed for other world regions can be adopted in the African context in line with a harmonisation approach (except those which are designed for a region-specific land cover or land use).
Additionally, 94% of the organisations that developed the protocols are long-term initiatives (i.e. sustainably funded institutions such as WMO, ICOS, etc), while the rest of the protocols were developed by projects (i.e. short-term initiatives). The latter generally coincide with completed project outputs that represent a collective effort envisaged to advance in the methodological harmonisation within a specific research field (e.g. the International Ocean Carbon Coordination Project—IOCCP).
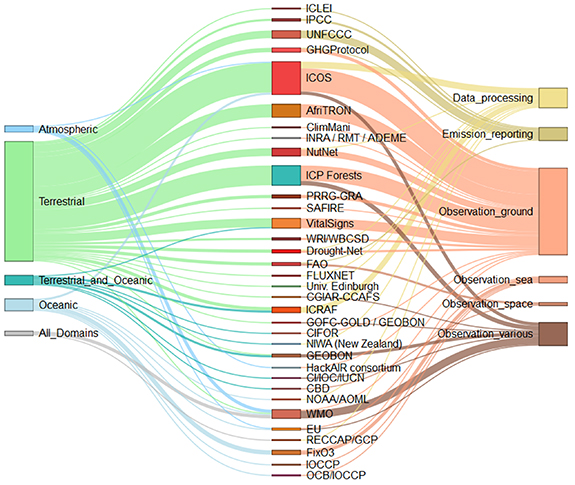
An overview of the links between the publishing institutions and both the earth system domains as well as the main application of the corresponding protocols is provided in figure 2. The purpose is to guide researchers interested in a specific domain and/or type of activity to the corresponding institutions and their protocols. For example, researchers interested in sea-borne observations are referred to a small number of specialized (and mainly project-based) initiatives (e.g. FixO3), whereas practitioners interested in emission reporting are rather referred to international institutions such as IPCC, UNFCCC or FAO.
Figure 2. Illustration of the relative number of protocols per publishing institution (centre or initiative), earth system domain (left) and main protocol application (right) as well as the links between those. Note that the height of the boxes and thickness of links are proportional to the number of corresponding protocols in the inventory. A disaggregated list with the full names of all institutions is available in table S1 of the supplementary material.
Download figure:
Standard image High-resolution image
In our inventory, protocols primarily related to the atmospheric domain were developed by 12 different initiatives including international monitoring networks associated with international environmental agencies such as WMO and other initiatives at regional level (e.g. ICOS). In the oceanic domain, the role of individual projects to support the harmonisation of international oceanic observations through the development of guidelines on methodological and data-related best practices is substantial. Note that an extensive compendium of methodological material for oceanic observations is provided by the open-access catalogue of ocean best practices5. This resource, however, is not included in the present inventory as it covers disciplines and research objectives that go beyond the focus of the present study on the estimation of climate forcing. Protocols primarily related to the terrestrial domain, which for the purpose of this assessment includes freshwater systems, salt marshes and mangroves, were developed by a large number of initiatives, the ones with the most protocols being ICOS, ICP Forests and RAINFOR/AfriTRON. An important aspect of the terrestrial domain is the presence of both natural and managed systems. Protocols for the measurement of variables related to agricultural and livestock systems are those developed by FAO, CGIAR-CCAFS, GHG Protocol, Vitalsigns and INRA-RMT-ADEME. The latter is a complete/comprehensive guide that include several methods used to measure GHG, ammonia and nitrous oxides emissions from livestock farming.
3.2. Feasibility assessment
A total number of 82 protocols dealing with ground-based and sea-borne observations were selected from the protocols inventory to assess the feasibility of their implementation. The results of this analysis are shown in table 3, where Initial Investment Index (II), Operational Investment Index (OI), Financial Costs Index (FC), Human Capacity Index (HC) and the overall Feasibility Index (FI) were calculated for each protocol by using approximate estimates of its equipment and operational costs, installation and maintenance efforts, and the knowledge needed for its implementation (see table S2 for detailed information).
Table 3. Feasibility assessment results of those protocols dealing with ground-based and sea-borne observations. This table includes protocols information—inventory identification number (ID), title, publishing institution, essential variables directly related to each protocol, domain (A = atmospheric, O = oceanic, T = terrestrial, F = freshwater or All)—together with associated Initial Investment Index (II), Operational Investment Index (OI), Financial Costs Index (FC), Human Capacity Index (HC) and Feasibility Index (FI). Protocols are listed in descending order of the Feasibility Index. Indicators used to derive these indices were equipment and operational costs per year, installation and maintenance efforts, and knowledge required for implementation of a protocol. Variables directly and indirectly associated to each protocol are indicated in black and grey font, respectively. Detailed indicators for each protocol together with its measurement mode (manual vs automatic measurement) are provided in table S2 of supplementary material.
| ID | Title | Publisher | Variables | Domain | FC | HC | II | OI | FI |
|---|---|---|---|---|---|---|---|---|---|
| 16 | Station description. How to describe the station and history of the monitored ecosystem | ICOS-ETC | Aerosol properties;Boundary layer height;Tropospheric CH4 mixing ratio;Tropospheric CO2 mixing ratio;Tropospheric N2O mixing ratio;Cloud Cover Fraction;Carbon Monoxide (CO);Halocarbons;Nitrogen Oxides (NOx);Non-methane hydrocarbons;Sulfur Dioxide (SO2) | T | 0 | 3 | 0 | 2 | 8 |
| 17 | Setting up the spatial sampling scheme for ecosystem station characterization, soil sampling and repeated ancillary vegetation measurements | ICOS-ETC | Aerosol properties;Tropospheric CH4 mixing ratio;Tropospheric CO2 mixing ratio;Carbon Monoxide (CO);Nitrogen Oxides (NOx);Sulfur Dioxide (SO2) | T | 0 | 3 | 2 | 2 | 8 |
| 69 | Soil microbes & animals | Nutrient Network (NutNet) | Biosphere-Atmosphere CO2 flux (NEE);Evapotranspiration;Water Vapour (surface);Surface Wind Speed and direction; Net Primary Productivity;Pressure (surface);Temperature (surface);Surface Roughness | T | 3 | 2 | 3 | 3 | 8 |
| 12 | Precipitations. Total precipitation, Snow depth | ICOS-ETC | Biosphere-Atmosphere CH4 flux;Biosphere-Atmosphere CO2 flux (NEE);Biosphere-Atmosphere N2O flux;Evapotranspiration; Net Primary Productivity;Temperature (surface);Water Vapour (surface) | T | 3 | 3 | 3 | 3 | 7 |
| 19 | Ancillary vegetation measurements in forests. Green Area Index, aboveground biomass, litter biomass. | ICOS-ETC | Pressure (surface);Surface Wind Speed and direction;Temperature (surface);Water Vapour (surface) | T | 3 | 3 | 3 | 3 | 7 |
| 22 | Site characterization measurements in forests. Vegetation species, aboveground biomass, green area index. | ICOS-ETC | Precipitation (surface) | T | 2 | 3 | 2 | 0 | 7 |
| 23 | Site characterization measurements in grasslands. Vegetation species, aboveground biomass. | ICOS-ETC | Fraction of Absorbed Photosynthetically Active Radiation (FAPAR);Net Radiation at surface (SW/LW) | T | 2 | 3 | 2 | 0 | 7 |
| 24 | Site characterization measurements in mires. Vegetation species. | ICOS-ETC | Soil Moisture;Temperature (surface) | T | 2 | 3 | 2 | 0 | 7 |
| 27 | Plant species reporting. | ICOS-ETC | Infiltration and Runoff;Extent of inland waters | T | 0 | 4 | 0 | 2 | 7 |
| 34 | Accupar LP-80 PAR LAI−1 ceptometer for Green Area Index measurements | ICOS-ETC | Biosphere-Atmosphere CO2 flux (NEE);Evapotranspiration;Water Vapour (surface);Surface Wind Speed and direction;Net Primary Productivity;Pressure (surface);Temperature (surface);Surface Roughness;Biosphere-Atmosphere CH4 flux;Biosphere-Atmosphere N2O flux;Precipitation (surface);Fraction of Absorbed Photosynthetically Active Radiation (FAPAR);Net Radiation at surface (SW/LW);Soil Moisture;Infiltration and Runoff;Extent of inland waters;Above ground biomass;Litter;Crop Yield;Below-Ground Biomass;Plant Species Traits;Soil Organic Carbon; | T | 3 | 3 | 3 | 3 | 7 |
| 35 | SS1 sunscan canopy analysis system for Green Area Index measurements | ICOS-ETC | Soil Moisture;Above ground biomass;Litter;Crop Yield;Below-Ground Biomass;Soil Organic Carbon | T | 3 | 3 | 3 | 3 | 7 |
| 68 | Wet N Deposition | Nutrient Network (NutNet) | Above ground biomass;Litter;Crop Yield;Below-Ground Biomass | T | 3 | 3 | 3 | 3 | 7 |
| 90 | Liana Crown Infestation and Crown Illumination Index Definition | AfriTRON;Rainfor; | Above ground biomass;Litter | T | 3 | 3 | 3 | 3 | 7 |
| 93 | RAINFOR—Liana Field Work Database Codes | AfriTRON;Rainfor; | Above ground biomass;Litter | T | 3 | 3 | 2 | 3 | 7 |
| 94 | Field Manual for Mode of Death Census | AfriTRON;Rainfor; | Above ground biomass | T | 3 | 3 | 2 | 3 | 7 |
| 97 | RAINFOR—Tree Field Work Database Codes | AfriTRON;Rainfor; | Above ground biomass;Plant Species Traits | T | 3 | 3 | 2 | 3 | 7 |
| 98 | Measuring Tree Height for Tropical Forest Trees—A Field Manual | AfriTRON;Rainfor; | Above ground biomass;Plant Species Traits | T | 3 | 3 | 2 | 3 | 7 |
| 110 | A simple method to determine surface albedo using digital photography | – | Plant Species Traits | T | 3 | 3 | 2 | 3 | 7 |
| 116 | hackAIR sensors | HackAIR consortium | Plant Species Traits | A | 3 | 3 | 3 | 3 | 7 |
| 124 | Vital Signs Protocol: Maize Yield Measurements and Farm Field Soil Sampling | VitalSigns | Soil Organic Carbon | T | 3 | 3 | 3 | 3 | 7 |
| 126 | Vital Signs Protocol: Farm Field Soil Sampling and Processing | VitalSigns | Plant Species Traits | T | 3 | 3 | 2 | 5 | 7 |
| 128 | Vital Signs Protocol: Rapid Roadside Assessments | VitalSigns | Above ground biomass | T | 3 | 3 | 2 | 3 | 7 |
| 11 | Meteorology. Air temperature, Air relative humidity, Air pressure, Wind speed, Wind direction, Backup meteo station | ICOS-ETC | Above ground biomass | T | 5 | 4 | 5 | 5 | 6 |
| 15 | Water Table Depth Measurements | ICOS-ETC | Boundary layer height;Tropospheric CH4 mixing ratio;Tropospheric CO2 mixing ratio;Tropospheric N2O mixing ratio;Carbon Monoxide (CO);Pressure (surface);Stable Carbon Isotopes;Surface Wind Speed and direction;Temperature (surface);Water Vapour (surface) | T | 5 | 4 | 7 | 3 | 6 |
| 18 | Ancillary vegetation measurements in croplands. Green Area Index, aboveground biomass, litter biomass. | ICOS-ETC | Biosphere-Atmosphere CO2 flux (NEE);Tropospheric CH4 mixing ratio;Tropospheric CO2 mixing ratio;Tropospheric N2O mixing ratio;Halocarbons;Oxygen;Partial Pressure of Carbon Dioxide (pCO2);Nitrous Oxide (Ocean);Marine Nutrients;Ocean Colour;Precipitation (surface);Pressure (surface);Sea Surface Salinity;Stable Carbon Isotopes;Surface Wind Speed and direction;Sea Surface Temperature;Temperature (surface);Water Vapour (surface);Evapotranspiration;Fraction of Absorbed Photosynthetically Active Radiation (FAPAR);Net Radiation at surface (SW/LW);Surface Roughness | T | 5 | 3 | 5 | 3 | 6 |
| 20 | Ancillary vegetation measurements in grasslands. Green Area Index, aboveground biomass, litter biomass, canopy height. | ICOS-ETC | Partial Pressure of Carbon Dioxide (pCO2) | T | 5 | 3 | 5 | 3 | 6 |
| 21 | Ancillary vegetation measurements in mires. Green Area Index, aboveground biomass. | ICOS-ETC | Above ground biomass | T | 5 | 3 | 5 | 3 | 6 |
| 25 | Foliar samples collection and leaf mass to area ratio determination. | ICOS-ETC | Above ground biomass; Plant Species Traits | T | 3 | 4 | 2 | 3 | 6 |
| 26 | Soil sampling and preparation for monitoring the soil organic carbon and nitrogen. | ICOS-ETC | Plant Species Traits | T | 3 | 5 | 2 | 5 | 6 |
| 38 | Calculation uncertainty of pCO2 from discrete samples of TA, DIC, and pH | ICOS-OTC | Above ground biomass;Litter;Plant Species Traits | O | 3 | 5 | 3 | 3 | 6 |
| 48 | Part IV: Visual Assessment of Crown Condition and Damaging Agents. In: UNECE ICP Forests Programme Coordinating Centre (ed.). | ICP Forests | Above ground biomass | T | 3 | 5 | 3 | 3 | 6 |
| 63 | Soils Processing Users Guide | Nutrient Network (NutNet) | Above ground biomass | T | 3 | 4 | 5 | 3 | 6 |
| 65 | Nutrients | Nutrient Network (NutNet) | Precipitation (surface);Temperature (surface);Water Vapour (surface);Surface Wind Speed and direction;Soil Moisture;Net Radiation at surface (SW/LW) | T | 3 | 4 | 5 | 3 | 6 |
| 67 | Leaf Damage | Nutrient Network (NutNet) | Soil Organic Carbon;Soil Moisture | T | 3 | 5 | 3 | 3 | 6 |
| 82 | GHG Emission Assessment Guideline Volume III: Guideline on Data Collection and Estimation of GHG Emission from Livestock and Manure Management | GHGProtocol & Ministry of Agriculture (Ethiopia) | Soil Organic Carbon | T | 3 | 4 | 2 | 3 | 6 |
| 89 | Manual for coarse woody debris measurement in RAINFOR plots | AfriTRON;Rainfor; | Above ground biomass | T | 3 | 4 | 3 | 5 | 6 |
| 92 | Fieldwork Manual for the study of leaves and wood edited to establish drought effects | AfriTRON;Rainfor; | Litter | T | 3 | 5 | 2 | 5 | 6 |
| 99 | Measuring Wood Density for Tropical Forest Trees—A Field Manual | AfriTRON;Rainfor; | Precipitation | T | 3 | 5 | 2 | 5 | 6 |
| 127 | Vital Signs Protocol: E-Plot Soil Sampling and Processing | VitalSigns | Nitrogen Oxides (NOx);Sulfur Dioxide (SO2) | T | 3 | 4 | 2 | 7 | 6 |
| 53 | Part VIII: Monitoring of Ozone Injury. In: UNECE ICP Forests Programme Co-ordinating Centre (ed.). | ICP Forests | Soil Organic Carbon;Soil Moisture;Litter;Above ground biomass;Precipitation;Biosphere-Atmosphere CH4 flux;Biosphere-Atmosphere CO2 flux (NEE);Biosphere-Atmosphere N2O flux | T | 3 | 6 | 3 | 5 | 5 |
| 80 | GHG Emission Assessment Guideline Volume I: Soil Carbon and Nitrogen Stock Assessment in Agricultural Land and Agroforestry Systems Field Guide for Practitioners | GHGProtocol & Ministry of Agriculture (Ethiopia) | Above ground biomass;Litter | T | 3 | 6 | 5 | 3 | 5 |
| 130 | Vital Signs Protocol: Household Survey | VitalSigns | Soil Organic Carbon | T | 5 | 5 | 2 | 7 | 5 |
| 131 | Vital Signs Protocol: E-Plot Biomass Measurements | VitalSigns | Above ground biomass;Fraction of Absorbed Photosynthetically Active Radiation (FAPAR);Litter;Plant Species Traits; | T | 5 | 5 | 2 | 7 | 5 |
| 132 | Vital Signs Protocol: Agricultural Management Intensity Survey | VitalSigns | Biosphere-Atmosphere CH4 flux;Biosphere-Atmosphere CO2 flux (NEE);Biosphere-Atmosphere N2O flux | T | 5 | 5 | 2 | 7 | 5 |
| 7 | Low-cost sensors for the measurement of A composition: overview of topic and future applications | World Meteorological Organization (WMO) | Above ground biomass | A | 4 | 8 | 8 | 3 | 4 |
| 10 | CO2, H2O, CH4 and N2O storage flux measurements | ICOS-ETC | Biosphere-Atmosphere CH4 flux;Biosphere-Atmosphere CO2 flux (NEE);Biosphere-Atmosphere N2O flux | T | 5 | 6 | 7 | 3 | 4 |
| 13 | Radiations measurements. Short-wave radiations, Long-wave radiations, Photosynthetically active radiation | ICOS-ETC | Soil Organic Carbon | T | 5 | 7 | 7 | 5 | 4 |
| 14 | Soil-meteorological measurements. Soil Temperature; Soil Water Content; Soil Heat Flux Density | ICOS-ETC | Inorganic Carbon;Nitrous Oxide (Ocean);Marine Nutrients;Oxygen;Pressure (surface);Net Radiation at surface (SW/LW);Ocean Colour;Precipitation (surface);Fraction of Absorbed Photosynthetically Active Radiation (FAPAR);Sea Surface Salinity;Surface Wind Speed and direction;Sea Surface Temperature;Temperature (surface);Water Vapour (surface) | T | 5 | 6 | 7 | 3 | 4 |
| 49 | Part V: Tree Growth. In: UNECE ICP Forests, Programme Coordinating Centre (ed.). | ICP Forests | Inorganic Carbon;Nitrous Oxide (Ocean);Marine Nutrients;Oxygen;Pressure (surface);Net Radiation at surface (SW/LW);Ocean Colour;Precipitation (surface);Fraction of Absorbed Photosynthetically Active Radiation (FAPAR);Sea Surface Salinity;Surface Wind Speed and direction;Sea Surface Temperature;Temperature (surface);Water Vapour (surface) | T | 4 | 7 | 5 | 6 | 4 |
| 50 | Part VI: Phenological Observations., In: UNECE ICP Forests Programme Co-ordinating Centre (ed.) | ICP Forests | Inorganic Carbon;Nitrous Oxide (Ocean);Marine Nutrients;Oxygen;Pressure (surface);Net Radiation at surface (SW/LW);Ocean Colour;Precipitation (surface);Fraction of Absorbed Photosynthetically Active Radiation (FAPAR);Sea Surface Salinity;Surface Wind Speed and direction;Sea Surface Temperature;Temperature (surface);Water Vapour (surface) | T | 4 | 7 | 4 | 7 | 4 |
| 51 | Part VI.1: Assessment of Ground Vegetation. In: UNECE ICP Forests Programme Co-ordinating Centre (ed.). | ICP Forests | Soil Organic Carbon;Area of ploughed land;Manure Management;Fertilizer application;Irrigation;Land Use/Land Use Change | T | 3 | 8 | 3 | 5 | 4 |
| 52 | Part VII.2: Assessment of Epiphytic Lichen diversity. In: UNECE ICP Forests Programme Co-ordinating Centre (ed.). | ICP Forests | Above ground biomass;Litter;Below-Ground Biomass;Land Use/Land Use Change | T | 3 | 8 | 3 | 5 | 4 |
| 57 | Part XII: Sampling and Analysis of Needles and Leaves. In: UNECE ICP Forests Programme Co-ordinating Centre (ed.). | ICP Forests | Manure Management;Livestock Distribution;Biosphere-Atmosphere CH4 flux;Biosphere-Atmosphere N2O flux;Economic Development | T | 5 | 6 | 5 | 5 | 4 |
| 58 | Part XIII: Sampling and Analysis of Litterfall. In: UNECE ICP Forests Programme Co-ordinating Centre (ed.). | ICP Forests | Biosphere-Atmosphere CH4 flux;Biosphere-Atmosphere N2O flux;Area of ploughed land;Manure Management;Fertilizer application;Irrigation;Crop Yield;Infiltration and Runoff;Precipitation (surface);Soil Moisture;Temperature (surface) | T | 5 | 6 | 5 | 5 | 4 |
| 59 | Part XIV: Sampling and Analysis of Deposition. In: UNECE ICP Forests Programme Co-ordinating Centre (ed.). | ICP Forests | Biosphere-Atmosphere CH4 flux | T | 5 | 7 | 5 | 7 | 4 |
| 62 | Part XVII: Leaf Area Measurements. In: UNECE ICP Forests Programme Co-ordinating Centre (ed.). | ICP Forests | Biosphere-Atmosphere N2O flux | T | 5 | 6 | 6 | 3 | 4 |
| 64 | Experimental Protocol | Nutrient Network (NutNet) | Above ground biomass;Litter;Below-Ground Biomass;Biosphere-Atmosphere CO2 flux (NEE);Pressure (surface);Surface Wind Speed and direction;Temperature (surface);Water Vapour (surface);Precipitation (surface);Soil Moisture;Fraction of Absorbed Photosynthetically Active Radiation (FAPAR);Net Radiation at surface (SW/LW) | T | 3 | 7 | 5 | 5 | 4 |
| 81 | GHG Emission Assessment Guideline Volume II: Aboveground Biomass Field Guide for Baseline Survey | GHGProtocol & Ministry of Agriculture (Ethiopia) | Litter | T | 4 | 7 | 6 | 5 | 4 |
| 87 | Nitrous Oxide Chamber Methodology Guidelines | Ministry for Primary Industries (New Zealand) & PRRG-GRA. | Above ground biomass;Plant Species Traits | T | 5 | 6 | 7 | 3 | 4 |
| 91 | RAINFOR Field Manual for Plot Establishment and Remeasurement | AfriTRON;Rainfor; | Above ground biomass;Litter;Below-Ground Biomass;Biosphere-Atmosphere CO2 flux (NEE);Plant Species Traits;Soil Organic Carbon | T | 3 | 8 | 7 | 5 | 4 |
| 95 | Soil sampling protocol for monitoring changes in soil carbon stocks in Amazonia | AfriTRON;Rainfor; | Above ground biomass;Plant Species Traits | T | 3 | 8 | 2 | 7 | 4 |
| 96 | Measuring Root Dynamics in Tropical Ecosystems—A Field Manual | AfriTRON;Rainfor; | Above ground biomass;Plant Species Traits | T | 5 | 6 | 7 | 3 | 4 |
| 54 | Part IX: Meteorological Measurements. In: UNECE ICP Forests Programme Co-ordinating Centre (ed.). | ICP Forests | Plant Species Traits | T | 7 | 7 | 7 | 7 | 3 |
| 55 | Part X: Sampling and Analysis of Soil. In: UNECE ICP Forests Programme Coordinating Centre (ed.). | ICP Forests | Soil Organic Carbon | T | 5 | 8 | 8 | 3 | 3 |
| 60 | Part XV: Monitoring of Air Quality. In: UNECE ICP Forests Programme Co-ordinating Centre (ed.). | ICP Forests | Below-Ground Biomass | T | 6 | 8 | 8 | 7 | 3 |
| 71 | Summary on new sensor developments and their suitability for different applications | FixO3 | Above ground biomass;Plant Species Traits | O | 7 | 7 | 7 | 7 | 3 |
| 72 | Deliverable 2.9 Final update of the Open Ocean Observatories Yellow Pages Website | FixO3 | Above ground biomass;Plant Species Traits | O | 7 | 7 | 7 | 7 | 3 |
| 73 | Deliverable 2.10 Technical guidelines of standards of acceptability for common sensor interoperability protocols | FixO3 | Above ground biomass;Plant Species Traits | O | 3 | 9 | 7 | 5 | 3 |
| 85 | Guidelines for Measuring CH4 and N2O Emissions from Rice Paddies by a Manually Operated Closed Chamber Method | National Institute for Agro-Environmental Sciences (Japan) & PRRG-GRA. | Albedo | T | 7 | 8 | 7 | 8 | 3 |
| 86 | Guidelines for use of sulphur hexafluoride (SF6) tracer technique to measure enteric methane emissions from ruminants | Ministry for Primary Industries (New Zealand) & GRA. | Aerosol properties | T | 7 | 8 | 5 | 7 | 3 |
| 120 | Protocols for the measurement, monitoring and reporting of structure, biomass and carbon stocks in mangrove forests | CIFOR | Above ground biomass;Litter;Below-Ground Biomass;Soil Organic Carbon;Biosphere-Atmosphere CO2 flux (NEE) | T;O;F | 5 | 8 | 2 | 8 | 3 |
| 125 | Vital Signs Protocol: Weather Stations | VitalSigns | Precipitation (surface);Above ground biomass;Litter;Plant Species Traits;Soil Organic Carbon;Temperature (surface); Below-Ground Biomass;Fraction of Absorbed Photosynthetically Active Radiation (FAPAR);Soil Moisture | T | 5 | 8 | 8 | 5 | 3 |
| 6 | Guide for Urban Integrated Hydro-Meteorological, Climate and Environmental Services | World Meteorological Organization (WMO) | Precipitation (surface);Above ground biomass;Litter;Plant Species Traits;Soil Moisture;Soil Organic Carbon;Temperature (surface); Below-Ground Biomass;Fraction of Absorbed Photosynthetically Active Radiation (FAPAR);Biosphere-Atmosphere CO2 flux (NEE);Plant Species Traits | All | 10 | 8 | 8 | 10 | 2 |
| 9 | Turbulent flux measurements of CO2, energy and momentum | ICOS-ETC | Above ground biomass;Area of ploughed land;Manure Management;Fertilizer application;Irrigation;Livestock Distribution;Crop Yield;Land Cover | T | 8 | 8 | 10 | 5 | 2 |
| 56 | Part XI: Soil Solution Collection and Analysis. In: UNECE ICP Forests Programme Co-ordinating Centre (ed.). | ICP Forests | Precipitation (surface);Pressure (surface);Fraction of Absorbed Photosynthetically Active Radiation (FAPAR);Surface Wind Speed and direction;Temperature (surface);Water Vapour (surface); Land Cover | T | 5 | 10 | 8 | 7 | 2 |
| 121 | The International Drought Experiment a distributed approach to assess T ecosystem responses to extreme drought: SHORT-STATURE SYSTEMS | Drought-Net | Land Cover;Soil Moisture;Soil Organic Carbon | T | 7 | 9 | 8 | 7 | 2 |
| 122 | Protocol: Drought experiments in tall stature (forest and shrubland) ecosystems | Drought-Net | Soil Moisture;Soil Organic Carbon | T | 7 | 9 | 8 | 7 | 2 |
| 129 | Vital Signs Protocol: Water Availability and Quality | VitalSigns | Land cover;Land Use/Land Use Change;Above ground biomass;Plant Species Traits | T;O;F | 5 | 9 | 8 | 5 | 2 |
| 36 | ICOS A Station Specifications | ICOS-ATC | River Discharge;Marine Nutrients;Nitrous Oxide (Ocean); Oxygen;Inorganic Carbon | A | 8 | 9 | 10 | 7 | 1 |
| 61 | Part XVI: Quality Assurance and Control in Laboratories, In: UNECE, ICP Forests Programme Co-ordinating Centre (ed.). | ICP Forests | Economic Development;Human Population | T | 8 | 9 | 10 | 7 | 1 |
| 88 | Measuring Tropical Forest Carbon Allocation and Cycling: A RAINFOR-GEM Field Manual for Intensive Census Plots | AfriTRON;Rainfor; | Above ground biomass;Plant Species Traits;Infiltration and Runoff;Litter | T | 7 | 10 | 8 | 8 | 1 |
| 37 | ICOS marine station labelling Step 2 | ICOS-OTC | Above ground biomass;Area of ploughed land;Manure Management;Fertilizer application;Irrigation;Livestock Distribution;Crop Yield;Land Cover;Land Use/Land Use Change; Economic Development | O | 10 | 10 | 10 | 10 | 0 |
Protocols that were found to be relatively easily feasible (FI > 6) include instructions for station/experiments set up, characterisation of site vegetation (developed by ICOS-ETC) and visual assessment of tropical vegetation status (developed by RAINFOR), because both financial costs and human capacity needed for their implementation are relatively low. Additionally, some other protocols focused on yield estimations, soil sampling and land cover/use validation in agro-systems (developed by VitalSigns) are considered highly feasible because they do not require either sophisticated instrumentation or highly trained personnel. Likewise, protocols describing precipitation and albedo measurements and approaches to estimate presence of soil microbes and animals, wet nitrogen deposition and atmospheric particles were also identified to be highly feasible due to their affordable equipment and easy implementation. For almost half of the assessed protocols the feasibility index is within an intermediate range (4 < FI < 6), which means that feasibility of implementation of a given protocol depends strongly on the specific context and purpose of the observation of interest (often high cost vs. low maintenance or vice versa). Many of the corresponding protocols are focused on meteorological (e.g. temperature, radiation, wind), vegetation (e.g. aboveground and litter biomass, wood density, leaves, needles, roots) and soil (e.g. carbon, nitrogen, nutrients, soil water content) measurements, while fewer deal with the measurement of greenhouse gas concentrations and fluxes in the atmosphere and in terrestrial and oceanic domains. Protocols with a low feasibility index (FI < 4) correspond to those for which both cost and human capacity needed for implementation are high. These include most of the guidelines developed to perform measurements in the oceanic systems (e.g. FixO3 guidelines) together with protocols describing complete meteorological stations (e.g. ICP Forests protocol), and approaches to directly measure biosphere-atmosphere GHG exchanges in natural and agricultural systems (e.g. ICOS-ETC and Global Research Alliance protocols).
4. Discussion
The protocols inventory represents a compendium of existing guiding materials developed by some of the main international and European initiatives in the field of scientific environmental observations. The main purpose of this inventory is to support the harmonisation of environmental observations across world regions, particularly in the context of the expansion of observations in presently understudied regions, such as large parts of the African continent and surrounding oceans.
Unlike standardisation, which refers to a top-down approach where compulsory instructions on observational methodologies (e.g. down to sensor model) are set in order to assure full interoperability across all standard-compliant entities (e.g. as within ICOS or the national US-based RI NEON), harmonisation is a more flexible approach, which aims to reach appropriate levels of interoperability by formulating clear requirements regarding the observational parameters (e.g. temporal resolution) instead of rigidly prescribing instruments and calibration cycles. On the African continent, i.e. in a very dynamic context including high heterogeneity in terms of biomes, population densities and observational capacities, a harmonised approach seems to be the more appropriate and feasible, in which minimum data requirements (Beck et al2019) for essential variables could provide the framework for the choice of optimal methods and instrumentation. In such a context, the present inventory (table S1) and the feasibility assessment of protocols (tables 3 and S2) can serve practitioners to identify suitable methodologies depending on the available financial and human capacity and drawing on the work done by the environmental research community. Such a proposed experimental design based on the adoption and—where required—possible modification of existing methodological protocols will not only ensure a certain level of interoperability across and beyond Africa, but also minimize the risk of duplication of work related to the development of methodological materials.
In order to enhance the spatial and temporal coverage as well as the accuracy of the climate forcing components estimates in the African region, a tiered approach with a systematic differentiation of at least two types of observation sites may be applied. 'Basic' tier 1 sites could correspond to monitoring stations that prioritise spatial coverage over temporal resolution and extremely high accuracy. These sites could enhance spatial data aggregation and comparability across systems (Vicca et al2018, Smith et al2019) for a limited set of variables by covering the main African biomes, anthromes (Ellis et al2010), land cover classes and land use domains over the long-term with a relatively low measurement frequency. For these stations, methodological approaches of high feasibility (i.e. with a high FI value) could be applied, such as the VitalSigns protocols to monitor agro-systems or RAINFOR/AfriTRON protocols designed for visual assessment of tropical vegetation status (tables 3 and S2). On the other hand, 'key' tier 2 sites could be monitoring stations aimed to enhance our understanding of driving processes behind the main climate forcing components, such as regional and national GHG budgets. Therefore, these sites would prioritise accuracy and temporal resolution and measure a higher number of variables over more representative land cover/land use types under representative management practices, as proposed by Smith et al (2019). Moreover, a combination of methodologies could be implemented in these 'key' sites to minimize financial and human resource needs by concentrating installation and maintenance efforts on a limited number of carefully selected locations. Methods applied at these sites would likely be based on a higher level of standardization (as opposed to the tier 1 sites, for which a purely harmonisation-based approach would be appropriate). These 'key' sites could also serve as catalysts to test novel techniques and compare top-down and bottom-up observational approaches (Leip et al2018), which would entail more sophisticated sensors and greater financial support. However, this type of sites requires higher financial investment due to the state-of-the-art techniques and highly trained personnel needed. Protocols that would fit well within the tier 2 category thus correspond to the less feasible ones, such as the FixO3 and ICOS protocols for oceanic monitoring stations and measurements, intensive plots for carbon allocation and cycling described by RAINFOR/AfriTRON, eddy covariance sites (under the ICOS-ETC specifications) or complete weather stations and atmospheric composition observations (e.g. ICP Forests), among others. Despite the great investment needed to assure long-term operation of corresponding sites, their benefits would be substantial. For instance, corresponding in situ data products are essential for the development of semi-empirical and mechanistic models capable of predicting the magnitude and variability of GHG sources and sinks in future climate change scenarios, and can serve to validate existing and support the development of new remote sensing products (Schimel and Schneider 2019, Xiao et al2019). Overall, the alignment of the RI design with societal and political current challenges will maximise the likelihood of sustained financial support. In the case of the African continent, these include major dynamics such as population growth, rural-urban migration and large-scale land use change.
This work should be considered as a first iteration towards a more comprehensive inventory of existing methods developed by international initiatives. It is not fully exhaustive since this review includes methodological protocols published up to October 2018, and therefore, some of the methodological material presented here may have been superseded by new versions. In addition, the inclusion of relevant atmospheric and oceanic protocols should be part of future refinement. Future iterations could feature a sensor database that includes price and technical specifications, such as the Esonet yellow pages6. This would significantly support the appropriate selection of a given sensor model and related methodology for assisting observational priorities. Furthermore, capacity building and international collaboration remain essential to assure the success of initiatives that pursue the enhancement of environmental observation in comparably under-studied regions such as Africa. Therefore, the establishment and improvement of effective channels for skills and knowledge transfer remain a priority for immediate and long-term funding among related research communities at international level. To achieve the above, an organised, coordinated and vivid community of practise that includes local and international stake-holders, modellers, experimentalists, and policy makers, arises as a fundamental enabler for international harmonisation and interoperability in environmental observations. Such community could make informed and collectively agreed decisions based on updated assessments that evaluate currently utilised methodologies together with their feasibility of implementation and respective fulfilment of data requirements.
Acknowledgments
This work was entirely funded by the European Commission through the project 'Supporting EU-African Cooperation on Research Infrastructures for Food Security and Greenhouse Gas Observations' (SEACRIFOG; project ID 730995). Acknowledgement is also given to the German Federal Ministry of Education and Research (BMBF) for contributing to this research by supporting SASSCAL. We also thank Wim Hugo, Ingunn Skjelvan, Antonio Bombelli, Robert Scholes, and Christian Brümmer for their valuable input during the inventory process. The views expressed in this document cannot be taken to reflect the official opinions of these individuals and organizations. The authors have no conflicts of interest to declare.
Data availability
The data that support the findings of this study are openly available at the 'SEACRIFOG Collaborative Inventory Tool' (https://seacrifog-tool.sasscal.org). The protocols metadata collected in the inventory can be downloaded at the protocols tab.
Footnotes
- 1
TITLE ((handbook OR guide* OR manual) AND (protocol* OR standard* OR harmoni* OR measurement* OR monitoring OR observation*)) AND (LIMIT-TO (SUBJAREA, 'ENVI') OR LIMIT-TO (SUBJAREA, 'AGRI')).
- 2
Note that the cost of the gas chromatography (GC) equipment was generally excluded for those protocols where gas sampling involved posterior GC analysis.
- 3
Note that staff costs are not considered here.
- 4
- 5
- 6