

Abstract
The industrial sector consumes ∼32% of the world's final energy demand, most in the form of heat which is derived primarily from fossil fuels. Two fundamentally different technologies exist for harvesting sunlight to offset fossil fuel use—solar thermal (ST) and photovoltaic (PV) collectors. The former convert sunlight into heat while the later convert sunlight directly into electricity (although electricity can be converted into heat via heat pumps and/or resistance heating). If/when factories transition towards utilizing their rooftops for solar harvesting, an essential question will be: which solar technology, or a mix of technologies, should be chosen for factory rooftops? This paper investigates this (as yet unanswered) question by assessing the global greenhouse gas emission (GHGe) mitigation potential of PV and ST collectors in a side-by-side mix (e.g. a percentage where 0% is solely PV and 100% is solely ST available roof area coverage) to supply medium temperature heat (150 °C–400 °C) for industrial processes. It was found that in most locations globally, a mix of both technologies optimizes the solar output. Globally, installing the optimum PV:ST mix can save up to 141.8 or 205.8 kt CO2e over installing solely PV or solely ST collectors, respectively. Another interesting finding of this study was that GHGe mitigation potential stems largely from where the solar collectors were manufactured (i.e. the embodied emissions from using local primary energy to fabricate the collectors). Thus, this study reveals that project managers, policymakers, corporate sustainability directors, etc could achieve maximum global GHGe mitigation through simply considering a mix of solar collector technologies and the best practices for manufacturing them.
Export citation and abstract BibTeX RIS

Original content from this work may be used under the terms of the Creative Commons Attribution 3.0 licence. Any further distribution of this work must maintain attribution to the author(s) and the title of the work, journal citation and DOI.
Nomenclatures
| PV | Photovoltaic |
| ST | Solar thermal collector |
| SF | Annual solar fraction (contribution) |
| GHG | Greenhouse gas |
| CO2e | Equivalent carbon dioxide |
| EM | Emission |
| EL | Electricity |
| NG | Natural gas |
| kt | kilo tonne |
| Mt | Million tonne |
| GHI | Global horizontal irradiance (W m−2) |
| DNI | Direct normal irradiance (W m−2) |
| DNI ratio | GHI/DNI (%) |
| GHGe | Greenhouse gas emission (kg CO2e/m2ap) |
| GHGe-Sav | Further greenhouse gas emission savings using the solar mix configuration (kt CO2e) |
| MM | Material mass (kg-material) |

|
Primary Embodied Energy (MJ/ kg-material) |
| EF | Emission factor (kg CO2/MJ) |

|
Capital input (MJ) |

|
Capital input emission (kg CO2e) |
| F | CO2 to CO2e conversion actor (kg CO2e/kg CO2) |
| FuelTot | Total fuel consumption (GJ) |
| FuelM-Ind | Total fuel consumption in the medium temperature industrial sector (GJ) |
| Esolar/Etot | Total installed solar capacity to the total final energy consumption (−) |
| SI | Supplementary information |
| BOS | Balance of system |
| f | Fuel, electricity with feedstock energy indicator |
| M | Fuel and electricity without feedstock indicator |
| J | Material indicator |
| K | Product indicator |
| S | System indicator |
| N | Product number |
| ap | Aperture |
| Sav | saving |
| Enh | enhancement |
| Pop | Population |
1. Introduction
While societal and, recently, economic benefits have become two of the main drivers for renewable energy implementation around the world, the underlying existential reason for displacing fossil fuels remains environmental [1]. The consensus among climate scientists is that to avoid irreversible change, we need to rapidly transition to a low-carbon energy system [2]. Solar energy technologies provide a key part of the pathway towards reducing emissions levels without (necessarily) reducing energy consumption levels simply because the solar resource is so large and so well distributed around the globe. At present, the Earth receives ∼10 000 times more energy from the sun than our society consumes [3], so it is possible to envision a future solar-powered economy that could allow our economy to substantially increase its energy consumption with much less impact on our climate [3].
Along these lines, the Paris agreement has set a goal to hold global average temperature increase to well below 2 °C above preindustrial levels, but this agreement is not prescriptive as to how this should be achieved [4]. Several global emission scenarios have been proposed that might achieve this global ambition [5], such as the '66% probability scenario' of staying below 2 °C in 2100, the 'median temperature increase of 1.7 °C and below 1.5 °C in 2100' scenario, and the '1.75 °C–2 °C median warming' scenario [6, 7]. While these scenarios often involve a bottom-up analysis by the economic sector, they typically do not elucidate how the specific technologies should be deployed.
In displacing fossil fuels, solar technologies may represent a big opportunity, but they also face several challenges. One of the overlooked 'challenge' is the abundance of choice in selecting which type solar collectors to install—a choice which may have ramifications on the global carbon emissions picture. There are numerous manufacturers and a few fundamental options for solar collector technology which must be carefully considered. Solar energy can be harvested not only for generating electricity (via photovoltaic collectors and concentrated solar thermal power plants) but also for providing building heating and cooling, and for thermal energy in the domestic and industrial sectors [8–10].
The industrial sector accounts for more than 234 EJ of the total global final energy consumption—a number which is projected to continue increasing (i.e. tripling to 695 EJ by 2030 [11]). Thus, any low carbon scenario needs to include mechanisms for reducing the emissions of the industrial sector going forward. At present, the global industrial heat demand is supplied mainly by conventional sources, however, a small portion (about 10%) is supplied by renewable energy technologies [12]. Industrial applications require a lot of thermal energy [13, 14], but the exact temperature levels and usage profiles are specific to the manufacturing process undertaken in each factory. Industrial processes can be divided into low, medium, and high temperature applications based on the required demand temperature. Within these ranges, 30% of industrial energy consumption goes towards low temperature processes (e.g. below 150 °C), 22% drives 'medium' temperature processes (e.g. 150 °C–400 °C), and the remaining 48% of energy consumption goes towards high temperature applications, >400 °C [12]. If solar thermal (ST) collectors are used for the medium and high temperature applications, they typically require ambient sunlight to be concentrated onto a relatively small focal line or spot to reduce the area for heat loss relative to the gross collection area. Photovoltaic (PV) collectors can also achieve medium and high temperature outputs (indirectly, without solar concentration) by coupling them with resistance heating [15] or heat pumps [16]. In the case of the relatively lower hanging fruit of medium temperature industrial process heat applications (compared to high temperature applications, where natural gas and coal combustion are hard to beat at present), it is unclear which solar technology represents the best fit for factory rooftop installations. Prior work of the authors has considered the concept of an 'optimal solar mix' wherein PV and ST collectors are installed side-by-side on a factory rooftops to achieve the highest fossil fuel offset (e.g. maximum solar fraction), the fastest economic payback time (e.g. assuming that the balance of system costs scale linearly with collector capital cost), and the fastest GHGe payback time, for medium temperature process heat applications [17, 18]. However, this prior work did not investigate the global impact or implication of using such an optimum solar mix. Despite the carbon emissions mitigation potential of using solar technologies in factories, there is no single study in the literature that compares solar technologies for industrial applications from a global perspective.
Industrial buildings, while larger than residential buildings, only have a limited amount of space available for solar installations. Further, where residential solar systems can be designed to produce more energy than needed by the building occupants, the energy usage on a per m2 of footprint area basis for factory buildings can be ≫1 kW per m2 (e.g. well above the peak solar resource). Thus, when considering a solar installation, industrial project managers must select between several solar technologies to extract the highest possible energy and/or the fastest economic payback time from a finite rooftop space. From a global perspective, however, 'solarizing' factory rooftops should also be considered for their ability to yield carbon savings through their net displacement of conventional energy use.
Rooftop solar potential can be analyzed by different methods—a method which can be roughly categorized as low, medium and high-level methods [19]. The low-level approach (employed here) relies on population density as a proxy for building's rooftops area. The medium method relies on aggregated statistical data along with the GIS and LIDAR software. The high-level method relies on detailed spatial information, which takes into account complex details such as rooftops shading and inclination. Although the low-level approach is not as accurate as the medium and high-level approaches, it is more suitable for a global analysis due to data availability. The medium and higher-level methods are (at present) only applicable to small areas (e.g. individual cities) and are difficult to scale up for larger areas [19].
Several studies have assessed the available rooftops footprint to estimate the solar potential in different locations based on different approaches. For example, Song et al [20] have assessed rooftop availability s in Chao Yang District of Beijing, China and found that 678 805 m2 of usable rooftop area could host 63.78 GWh per year of PV electricity generation. The technical potential for rooftop solar PV has also been estimated across the USA [21, 22], where it was found that 8.13 billion m2 of rooftops are suitable to host 1118 GW of PV capacity. The most common approaches for estimating rooftop potential involve analysis of images from google maps, light detection and ranging data (LiDAR) instruments, or from geographical information systems (GIS) tools. The most common method for assessing the potential of solar energy harvesting potential is through the use of GIS tools, often combining satellite imagery and MATLAB analysis [23]. According to a Google Scholar search, in the decade of 2009–2019, approximately 2300 publications contain 'Solar GIS' in their title or abstract, most of which presumably relates to the potential of installing solar collectors in various locations. However, these approaches are difficult to adopt for industrial rooftops because they face difficulty in identifying building types and in matching rooftop area with energy demand/consumption, particularly on a global scale [24]. Therefore, rather than using a bottom-up GIS approach, this study will use a top-down approach which relies upon energy production potential and emission mitigation potential by estimating representative locations and assumptions about installed solar capacity.
In general, solar technologies are considered as clean sources of energy during the usage phase, but we cannot overlook the fact that they come with embodied energy and emissions from their manufacturing phase. The associated embodied emissions of the manufacturing phase can be determined using the embodied energy of the raw materials and the emissions resulting from the local energy mix for the embodied energy inputs [25]. Ultimately, the aim is to get a high return on embodied energy, emissions, and of course capital investment, from solar technologies. These aims have motivated researchers to continually improve the design and performance of solar collectors [26–28] and decrease their cost [29, 30], and to understand their lifecycle environmental impacts [31, 32]. Solar technologies have been assessed independently for their life cycle impacts [33, 34], however, no studies in the literature have attempted to extrapolate this out for the environmental impacts of such solar technologies globally. Thus, the regional embodied emissions (from the manufacturing stage) will be assessed in this study and compared to the embodied emissions resulting from business as usual. It should be noted that although solar technology manufacturing consists of many steps [35], this study assumed that most materials and processes can be performed locally. However, due to the large PV manufacturing capacity in China (about 70% of global production capacity [36]), the PV cells were assumed to be imported from China in this study.
Several studies have investigated solar collector systems using various objectives such as cost [30], energy outputs [37], embodied emissions [38], and the environmental damage cost of PV collectors [39]. While these types of studies are much more common for the small scale [40], there is also a limited number which looks at solar technologies for industrial applications [34, 41]. Furthermore, a few studies have looked at combining renewable technologies in an optimum mix to better meet the demand of building [42] and the electrical grid [43–45]. These types of analysis make thorough inter-resource comparisons (e.g. how wind, solar, hydro, and geothermal might complement each other), but overlook intra-resource comparisons (e.g. how the same solar resource could be utilized via different technologies). As mentioned above, previous work by the authors has analyzed the best 'mix' of PV and ST collectors industrial applications [46, 47] for a single objective function [18] and multi-objective functions [17] using the transient performance function and the collectors embodied emissions [25]. However, this work was limited to only a few characteristic locations.
To significantly expand upon the literature and to understand the implications of solar installations on factory rooftops globally, the present study compares solar technologies globally using the local energy mix along with a detailed annual transient performance analysis for a medium temperature process heat application. Conducting this analysis will allow us to test our hypothesis that the mix of solar technologies and/or the embodied energy of manufacturing solar collectors for these applications will have a significant effect on global climate change scenarios. As such, the following study presents results of the potential side-by-side mix of ST and PV collectors to achieve optimum carbon emission mitigation globally. A total of 635 geographical locations will be analyzed. The analysis takes into account the fact that some solar capacity is already installed, depending on location, so only the further potential GHGe mitigation is presented. As such, this study covers this gap as a detailed geographical work and presents global maps that benefit manufacturers and users. As the current study covers a large scope over a wide set of locations worldwide, it will provide an insight into the best solar mix and its real global environmental impacts from a global perspective.
2. Methods
This section provides a brief description of the methods and data used in this study for evaluating the embodied emissions of PV and ST solar collectors globally. Additionally, the method for determining the optimum solar mix configuration, along with global carbon emission mitigation potential, is described.
2.1. Input data
All required data for the analysis were retrieved from simulation software databases and official recent databases such as TRNSYS [48] and IEA 2018 database [49]. Therefore, locations with all available data are shown in the results. It should be noted that some locations, such as several African countries, have no available data, so they (unfortunately) will not be presented in the result section.
2.1.1. Meteorological data
Typical meteorological year (TMY) weather data was retrieved from TRNSYS library [48] for all locations. This TMY is simply a collection of representative climate data which is compiled from several years of real data for a specific location. TMY data is typically provided in half-hour or hourly increments, so it can be used to simulate renewable energy systems on a transient annual basis. The annual performance can then be inferred as typical performance over the whole lifetime of the system. While this type of performance analysis, based on characteristic data (from the past), is not guaranteed to predict future performance, it does represent the best estimate possible for most locations without installing expensive ground sensors. The meteorological data includes the dry bulb temperature (ambient temperature), effective sky temperature, humidity ratio, wind velocity and direction, atmospheric pressure, extra-terrestrial solar radiation, total horizontal radiation, total tilted solar radiation, beam radiation, diffuse radiation, solar zenith angle, solar and surface azimuth angle and surface angle of incidence. All of these can, to varying degrees, impact a solar systems' annual output.
2.1.2. Emission data
The corresponding CO2 eq emissions data were calculated using the most recent data from [49–52]. These emissions account for solar technology's materials embodied greenhouse gas emissions during the technologies manufacturing. Therefore, all emission factors adopted in this study are shown in the accompanying supplementary Information document (i.e. Section 2.1 of the SI is available online at stacks.iop.org/ERL/15/044013/mmedia).
2.1.3. Local solar potential
The optimum solar mix based on energy and carbon savings were assessed for the solar capacity potential. Different approaches can be used to estimate the solar capacity potential in each location based on the available rooftop space or on the energy demand/consumption. Available rooftops suitable for solar installation in various intra-countries locations can be found using surveys [22]. However, since this is not applicable in this study due to the large number of selected locations, the solar capacity potential of each location was approximated using the energy consumption of the country and the ratio of the city/state's population to the total country's population. This energy consumption estimation essentially accounts for the relationship between population density and building density, as presented by Singh et al [53]. Total energy consumption data for each of the selected countries were retrieved from [51, 52] (with more detail discussed in section 2.2 of the SI). Additionally, the total installed renewable technologies were also retrieved from [51] (with more detail shown in section 2.3 of the SI). All location's populations were retrieved from [54, 55] (with more detail shown in section 2.4 of the SI).
2.2. Solar technologies
Monocrystalline PV panels are selected due to their market dominance and high efficiency, and the linear Fresnel thermal collector is selected because it fits the required application in terms of the required temperature and the rooftop integration. The used PV panel is monocrystalline (STP280S-20) with a nominal efficiency of 17.2%, and the used collector is a micro Fresnel collector (MCT). The detailed technical data of both solar technologies are reported in table 1.
Table 1. Solar thermal and solar PV manufacturers technical data.
| Parameter | Aperture area (active area) | Optical efficiency | Heat loss coefficient (c1) | Heat loss coefficient (c2) | Power | Efficiency |
|---|---|---|---|---|---|---|
| Unit | m2 | — | Wm−2 K−1 | Wm−2 K−2 | Wp | % |
| Fresnel collector | 3.39 | 0.565 | 0.54 | 0.0032 | — | _ |
| Monocrystalline | 1.474 | — | — | — | 280 | 17.2 |
2.3. Embodied emissions
The capital input factor (0.22 in equation (6)) used in the present study covers materials transportation and any miscellaneous impacts, as was discussed in [25]. As in [25], the embodied GHGe in each location is calculated as following:


All the solar collector materials and their BOS systems (retrieved from [25]) are considered in the analysis, however, since this study performs a relative comparison were most components are the same, any common components were ignored in the analysis (such as the storage tank). The functional unit assumed in this study is the useful heat output per the unit of the active area (see table 1). For both solar technologies, the embodied emissions were compared for the same objective (i.e. performance of 600 m2 solar technology aperture area [25]), and for the same functional unit (i.e. the useful heat output per the unit of the active area). A full list of all location's emission factors (F, and EF) are shown in section 2.1 of the SI. Although the emissions related to the fuel mix vary across each country, it was assumed that the similar average fuel emissions factors match for each country.
2.4. Optimum solar mix
To determine the optimum solar mix, the ST collector and PV area were varied in a side-by-side configuration for a limited available space rooftop in different global locations for the same industrial application. System performance was optimized using the particle swarm algorithm (PSO), as was done in [17, 18]. PSO is a well-known optimization algorithm for nonlinear non-convex problems that are associated with these types of systems [17]. To do this, a user-defined MATLAB code was coupled with a TRNSYS model of the system to generate the output results which can be iterated upon by the PSO algorithm. Figure 1 shows a simple diagram for the optimization method employed in this paper.

Figure 1. Optimization methodology applied in this work.
Download figure:
Standard image High-resolution imageThe TRNSYS model evaluates average annual values based on annual transient simulations in each location. The objective performance function in this study is the solar contribution (the annual load energy supplied by solar energy) as is shown in the following equation [56]:

In all locations, the solar collectors were installed facing the equator, tilted at an angle equal to the local latitude to maximize annual solar energy input into the collector's aperture. Therefore, the system design parameters (i.e. storage tank volume and heat transfer fluid flow rate), were optimized to get the maximum annual solar contribution. Following this, the optimum design parameters were used to find the optimum solar mix. Figure 2 shows the detailed methodology for evaluating the system design parameters and the optimum performance solar mix. The detailed system design schematic diagram along with the 'types' used in TRNSYS is shown in section 1 in the SI.
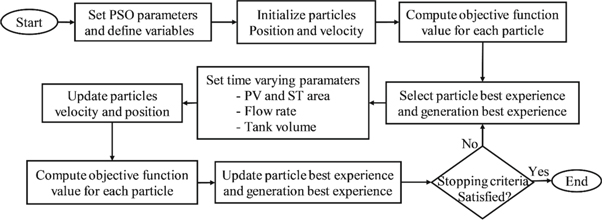
Figure 2. Optimization procedure.
Download figure:
Standard image High-resolution image2.5. Emissions mitigation
Due to the fact that the annual solar fraction can be enhanced by employing a side-by-side solar mix configuration [46], it is often possible to offset more conventional energy consumption than with a PV or ST stand-alone system [17]. These further carbon emission saving (GHGe-Sav), compared to stand-alone PV or ST solar systems in any location, can be calculated as follows:


where  is the conventional fuel used in the medium temperature industrial sector,
  is the total conventional fuel used in the total final energy consumption, and
  is the country medium temperature heat to the total country final energy consumption ratio.
  is the solar mix (side-by-side PV:ST) performance enhancement,
  is the annual solar contribution of the side-by-side PV:ST (solar mix) system, and
  is the annual solar contribution of the standalone PV or ST system.
  is the total installed solar energy capacity to the total final energy consumption ratio. Global data of
  and
and  are shown in sections 2.2 and 2.3 of the SI, respectively, in which all their data have been extracted from [50–52]. To find (
 ), the average global medium temperature industrial heat ratio of 5.2% was used in the analysis. It was determined using the global industrial to the total global final energy consumption ratio of 32% [12], the global industrial heat to the total global industrial demand ratio of 74% [12], and the global medium temperature heat (150 °C–400 °C) to the total global industrial heat demand ratio of 22% [12].
2.6. Global mapping
There are numerous tools available to visualize the results as world maps such as the MATLAB software and GIS tools which have advanced techniques for maps visualizing. However, they are complex and expensive, therefore, this study uses excel which provides a simple way to plot worldwide maps using their state/country or latitude/longitude combinations as inputs.
With global input data and the analysis methods defined, the remainder of this paper will be devoted to showing the findings as global maps.
3. Results
Most solar collectors are made in China and imported for installation, however, most countries do produce solar collectors, so it is worth looking at the relative impact of local production. Therefore, the embodied greenhouse gas emissions of the Fresnel thermal collector and the monocrystalline PV panel were estimated as if they were locally manufactured technologies. Although numerous technical findings were produced during this work, the main thing the authors would like to present is the optimum solar mix (and how it changes with location). Through this, the following global maps also indicate the possible carbon emission mitigation for both the manufacturing and usage phases of solar systems on factory rooftops.
3.1. Embodied emissions
Monocrystalline PV panels and linear Fresnel thermal collectors were used to estimate the embodied emissions in each location, as if they were manufactured using local resources. The effect of translocating PV manufacturers from China to the lowest embodied emissions country was analyzed.
3.1.1. Embodied emissions
The first important piece of information that was found in this work is the embodied emissions of producing solar collectors in different regions around the world. As is shown in figures 3(A) and (B), ST and monocrystalline PV collectors have significantly different estimated embodied emissions, depending on where they get manufactured (nearly an order of magnitude). It should be noted that since China is a large manufacturing economy, it produces most of the PV cells and PV modules for the world, as is shown in figures 3(C) and (D). Solar consumption by country is also shown in figure 3(E).
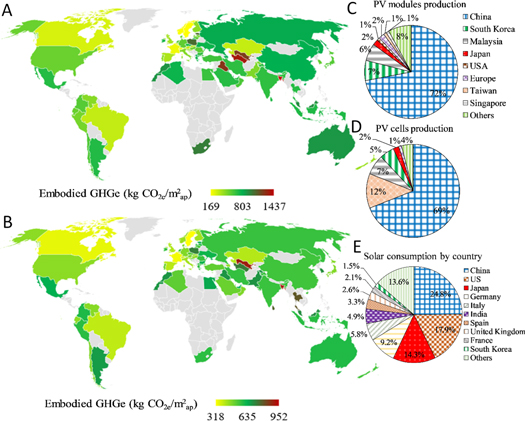
Figure 3. Global embodied greenhouse gas emissions for: (A) solar thermal collectors; (B) monocrystalline PV modules. Pie charts are also given for: (C) PV module production by country; (D) PV cells production by country; and (E) solar consumption by country. Data from [36, 51].
Download figure:
Standard image High-resolution imageFrom the embodied emissions perspective, Canada, Brazil, France, Sweden, and Kazakhstan are promising for ST and PV manufacturing due to the lower fuel emissions. Moving ST collectors' manufacturers from China to (India, Pakistan or Kazakhstan) can save (118, 313, and 487) kg CO2e/m2ap respectively. China is preferable for PV manufacturing, however, moving PV manufacturers from China to Kazakhstan can save 144 kg CO2e/m2ap. Moving solar technologies manufacturers from European countries to France or Sweden can save up to 1121 kg CO2e/m2ap for ST and up to 503 kg CO2e/m2ap for PV. In the northern and southern American countries, moving manufacturers to Canada or Brazil can save up to 449 kg CO2e/m2ap for ST and up to 322 kg CO2e/m2ap for PV. Australia can move ST manufactures to Pakistan to save 402 kg CO2e/m2ap, however, PV embodied emissions will not have a significant reduction by moving manufacturers to a near Asian Pacific country. Although Africa is expected to one day become a huge industrial sector, there is a small amount of reliable information available about all African countries at present. Therefore, this section of the maps is blank for future research to fill in the carbon emission mitigation potential. The impact of moving the solar manufacturers for two of the leading producing countries is shown in the following case studies.
3.1.2. PV collector case study-China
China was investigated as a case study to determine the potential emissions savings possible by moving manufacturing to a country with different primary energy mix (see figures 3(C) and (D)). It was found that moving PV manufacturing from China to the best practice country (Sweden) (which can also be thought of as China dropping its emissions levels to Sweden levels) saves 238 kg CO2e/m2ap (PV embodied emission is 556 kg CO2e/m2ap in China and 318 kg CO2e/m2ap in Sweden). Crystalline PV cells account for 97% of the overall commercial production, and the efficiency of these modules ranges from 17% to 22.7% [36]. In 2017, the total PV production in China reached 72 GW [36] which is equivalent to 379 million m2 of PV panels (assuming 19% average efficiency). Therefore, the total emission saving on China PV production by 'only' shifting to Sweden emissions levels exceeds 90.2 Mt CO2e per year (e.g. equivalent to about 0.2% of the total global emission which was estimated at 48 billion tonnes CO2e [5]).
3.1.3. Solar thermal collector case study-USA
The USA is also a leading country for solar collector manufacturing. The USA produces more than 1.25 million m2 of low, medium and high temperature ST collectors each year [57]. Our present analysis found that moving these manufacturers from the USA to Sweden's emission levels would save 370 kg CO2e/m2ap (i.e. PV embodied emission is 539 kg CO2e/m2ap in the USA and 169 kg CO2e/m2ap in Sweden). Therefore, the total emission saving on the USA ST collector by 'only' shifting to Sweden levels exceeds 0.46 Mt CO2e per year.
Embodied emissions depend on the local resources associated embodied emissions, and thus solar manufacturers can decide the best countries for solar technologies manufacturing and development. Policymakers can also propose initiative schemes to support manufacturing in law emission countries to reach global climate targets. There are many other associated impacts that affect the final decision such as the availability of resources, labor costs, and countries policies. In future work all other factors can be investigated, however, this study focuses on environmental impacts either from the embodied emissions (manufacturing phase) or energy consumption (usage phase).
3.2. Performance optimization
The bulk of the analysis of this paper was looking at the optimum solar mix for the locations where data was available. In this regard, figure 4 shows a global map of the optimum solar mix results, based on achieving the highest solar fraction, for the 635 locations (where 0% is solely PV and 100% is solely ST). It shows that the maximum performance could be achieved using standalone PV, ST or a mix between both technologies. The main geographical impact factors that affect the PV:ST solar mix are the global horizontal irradiance (GHI), the direct normal irradiance (DNI, also known as the beam component), and the average ambient temperature (Tave) of each location. In particular, the DNI ratio, or the ratio between the DNI and the GHI (a proportion typically ranging between 0% and 85%) was found to largely dictate the optimum solar mix in this study. The locations were found to cover a wide range of irradiations (760–2476) kWh m−2, with DNI ratios between 33.5% and 83.3%, and temperatures between −3.3 °C and 30.6 °C. The ST collector outperforms the PV system in high GHI/high DNI locations such as Egypt, Western Australia, and the southwestern USA. In medium GHI/medium DNI locations, a mix of solar technologies is preferable (e.g. China's central provinces, East Australia, and the southern part of India). In low GHI, low DNI locations such as northeastern European countries, PV outperforms ST. It was also found that in intra-countries locations where the GHI and DNI insignificantly vary (or equal), the optimum solar mix has a slight variation due to the average ambient temperature variation (i.e. Arizona and Colorado in the USA have approximately similar solar resource, however, Arizona is warmer and thus ST is preferable). When the average temperature increases, PV performance decreases (slightly, ∼0.5% per °C) due to the PV cells heat loss which increases with temperature. The opposite is true for ST collectors which have less heat loss to the surroundings in higher ambient temperature locations. Thus, the optimization shows a slight increase in the ST ratio as a function of ambient temperature. Therefore, in similar latitude (or longitude) locations, the optimization results in a different solar mix due to the variable weather conditions.
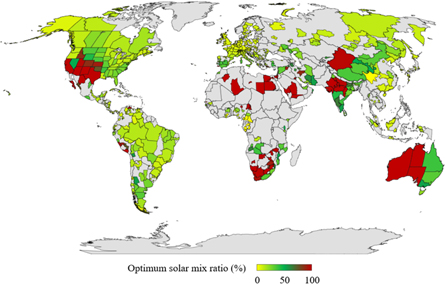
Figure 4. Optimum solar mix ratio (ST area/Available area).
Download figure:
Standard image High-resolution imageAs the DNI resource is the key concentrated solar collector performance, we propose herein that the DNI ratio can be used as a rough metric to find the best solar mix. Using the simulation results of all selected locations, a correlation between the location DNI ratio and the optimum solar mix distribution ratio can be determined (see figure 5). While not an extremely strong function of one variable alone, the best, simple correlated function was found to be an exponential function with an R2 of 80.7%. As a first-order determination of the best solar mix, the following equation (see figure 5) which only depends on DNI ratio can be used.
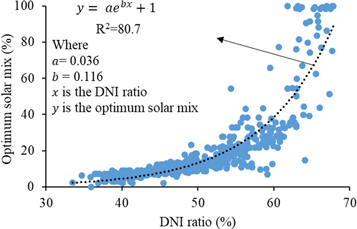
Figure 5. Optimum solar mix ratio as a function of the DNI ratio.
Download figure:
Standard image High-resolution image3.3. Carbon emissions mitigation potential
It was found that using solar technologies in a side-by-side configuration improves the annual solar contribution as compared to individual solar technologies systems. Since the auxiliary heater can use any conventional source such as gas, oil, or coal, the potential emission mitigation of using the right mix of technologies over the blind selection of standalone solar technology type is analyzed and compared to various possible auxiliary heater fuels. Figure 6 shows global maps of solar mix potential carbon mitigation over using PV alone compared to using gas as a traditional source. It is divided into sub-regional maps due to the large differences between emission mitigation among the selected regions. Carbon mitigation varies due to the variation of the installed solar capacity, industrial consumption in the medium temperature sector, and solar fraction enhancement factor. Generally, due to the high energy savings using the solar mix configuration compared to standalone PV systems in high DNI locations, further carbon saving is higher. In contrast, in low DNI locations, the solar mix can save more energy compared to ST systems, and thus further carbon emission saving is higher.

Figure 6. Estimated mitigation potential of using solar technologies mix rather than PV globally (tonnes CO2e/year).
Download figure:
Standard image High-resolution imageGlobally, among the selected locations, it was found that applying the solar mix configuration rather than using PV alone or ST alone on the current medium temperature solar potential for industrial applications can save further (141.8 or 205.8) kt CO2e respectively if the natural gas is used as an auxiliary heater fuel. Compared to oil boosted auxiliary heaters, the solar mix configuration can save further (252.9 or 547.9) over using PV alone or ST alone. Similarly, compared to coal boosted auxiliary heaters, the solar mix configuration can save further (190 or 6.2) kt CO2e overusing PV alone or ST alone. Some applications may use a mix of conventional energy as a traditional energy source, thus the combined energy mix emission factor can be found and applied on the current energy savings to find the corresponding saved emissions using equations (10)–(12).
4. Discussion
In this section, the selected approach, desired demand temperature sensitivity analysis, the impact of solar technologies embodied emissions on one emission scenario and possible future work will be addressed.
4.1. Population ratio
It is a tough task to quantify suitable rooftops for solar industrial applications, it is also a tough task to find intra-countries (locations) industrial energy to the total country industrial energy consumption globally. It is expected that the population density in industrial locations is larger than non-industrial locations, and thus a population ratio was used to approximate all locations energy consumption. To compare the previous results (in figure 6) with industrial energy ratio of intra-country states, the USA is considered because of its data availability [58]. It was found that the further total solar mix GHGe offset in the USA using the population ratio approach is 29.6, and 33.2 kt CO2e compared to PV and ST, respectively. However, using the energy ratio approach instead of population ratio, the corresponding emissions offsets are 29.0 and 32.9 respectively. The error of using population ratio to estimate the energy consumption in each state is less than 2%, and thus, the overall results are accurate. However, the distribution of emissions offset estimation varies depending on the used approach (see figure 7). Although the total country emission results do not have a significant variation, the exact location data must be used to find the exact emission offset results.
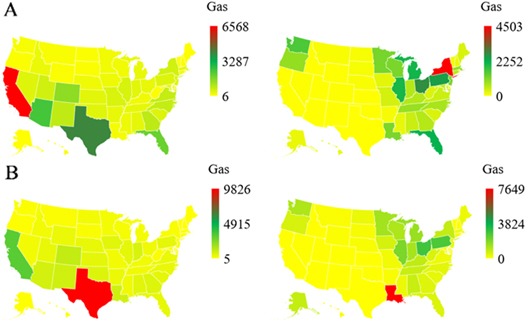
Figure 7. Side-by-side solar mix configuration emission mitigation (kg CO2e) compared to PV (left), and ST (right) A: using population ratio, and B: using energy ratio.
Download figure:
Standard image High-resolution image4.2. Sensitivity analysis
All previous analyses and results were performed for a process heat application that requires heat at 180 °C. In this section, a sensitivity analysis is performed to see the impact of the desired temperature variation on the final solar mix results. The USA states are used to visualize the results as it presents a wide range of GHI, DNI, and ambient temperatures.
The load required temperature is increased by 10% (i.e. from 180 °C to 198 °C), where the total load required energy was maintained the same. The overall annual load was maintained by increasing the fluid inlet temperature by the same amount in the simulation software (i.e. assumed to be preheated by 18 °C). Figure 8 shows the optimum performance mix results comparison between the original load specifications and a 10% increase in the required load temperature. Generally, when the required load temperature increases (and inlet fluid is preheated to maintain the required load energy unchanged), the optimum ratio decreases (ST required area decrease). This is due to the lower ST collector efficiency at a higher temperature, and thus PV is preferable at higher demand temperatures. Additionally, it is expected that the optimum ratio decreases if the PV efficiency increases. However, the optimum mix depends on other factors such as the PV efficiency temperature derating factor.
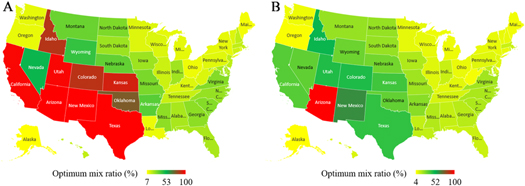
Figure 8. Side-by-side optimum solar mix ratio (%) A: original load temperature, and B: higher load temperature (i.e. 10% increase).
Download figure:
Standard image High-resolution image4.3. GHGe scenario modification
To achieve the Paris Agreement's goal of 2 °C mean global temperature rise, the total global greenhouse gas emission must be decreased by about 1% each year (from 48 billion tonnes of CO2e in 2010 to 37 billion tonnes CO2e by 2030) [59]. Since medium temperature process heat applications are a relatively small chunk of the whole emissions pie, the aim of this paper was to find out if our recommendations for implementing best practices for solar technologies in this application could impact the total emissions trajectories.
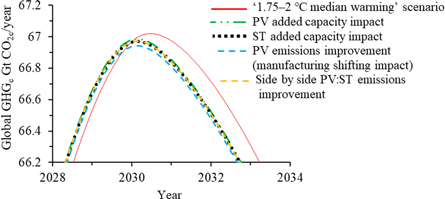
It was found that implementing solar technologies into industrial applications will add CO2e emissions to the environment (due to their embodied emissions) until 2030 (see figure 9, green, black, blue and yellow lines), but at this point the net savings will start to accrue. That is, each new annual addition of solar technology adds to global CO2e emissions initially (due to its embodied emissions), but after a time (∼ 5 years [25], depending on the manufacturing practices), these installations begin to pay for themselves. Thus, as an increasing number of collectors will be installed each year (e.g. between 2023 and 2050 the installed solar capacity is expected to double) the CO2e emissions do not reach a peak until after 2030. It should be noted that several assumptions were made to produce figure 9, as is shown in table 2. The average global embodied emissions of 525 and 710 kg CO2e/m2 were used for solar PV and the Fresnel ST collectors, respectively. The average embodied emissions were calculated using the embodied emissions of the top 10 solar technologies producing countries (see figure 3(C)).
Figure 9. Medium temperature heating solar technologies impact on the 2 °C median warming in 2100 scenario.
Download figure:
Standard image High-resolution image
Table 2. GHGe emission reduction assumptions.
| Analysis variable | Assumption |
|---|---|
| Fossil fuel | Natural gas |
| System lifetime | 30 years [25] |
| Solar PV growth between 2017 and 2023 | 200% [60] |
| Solar thermal growth between 2017 and 2023 | 54% [60] |
| Renewable energy growth between 2023 and 2050 | 200% [61] |
| Estimated PV collector's average efficiency | 19% [36] |
| Estimated solar technologies installation in the medium temperature process heat applications | 5.2% |
| Global CO2e/CO2 factor | 1.32 [51, 52] |
If our society (somehow) stays on track to reach the 2 °C emission scenario, emissions will peak just before 2031 (see the solid red line of figure 9). However, with additional solar PV and ST capacity in industry, using existing manufacturing practices of solar technologies (e.g. the PV and ST 'added capacity impact' curves), it may be possible to achieve peak emissions about 6 months early. Figure 9 also shows that ST (black dotted line) has slightly lower emissions compared to PV (green hashed line) because of its lower expected added capacity. Additionally, it was found that using a mix of solar technologies can save more emissions compared to PV alone, enabling the emissions peak to shift to occur 6 months earlier (see the dotted yellow line in figure 9).
In all solar cases shown in figure 9, adding solar collectors into industry provides a large gap in global CO2e levels after 2031. As a final aspect for investigation, we included the adoption of best practices for the manufacturing of PV modules. The blue hashed line of figure 9 shows that this shifting of manufacturing practice, as discussed in 3.1.2, can reduce the global CO2e peak by 45 MT CO2e over the original '1.75–2 °C median warming scenario.
Figure 9 also indicates that PV manufacturing practices can have a greater impact on the global GHGe picture than selecting the optimum mix between PV and ST collectors. Taken together, if optimized, these two factors can indeed alter the trajectory of global CO2e peak levels and the shift the time at which the peak occurs.
4.4. Future work
Annual ST energy yield saves around 134.7 Mt of CO2 emissions worldwide [62]. Globally, it was estimated that the average medium temperature industrial sector contributes to about 5.2% of the total energy consumption and thus global emissions of 7 Mt CO2, that is equivalent to 9.24 Mt CO2e—calculated using the average global CO2e/CO2 factor—(see SI, section 2.1). Therefore, in the selected locations, the side-by-side solar mix configuration can add a further 1.5%–2.2% (compared to PV and ST standalone systems respectively) to the total annual global ST emission savings in the medium temperature industrial sector.
Selected locations consume 61.5% of the total global energy (calculated using the data from sections 2.2 and 2.4 in the SI) and contribute to 58.3% of the total CO2 emissions (calculated using data from sections 2.1 and 2.4 in the SI, and data from [50]). None- selected locations were ignored due to the lack of all required data. However, they have a high potential for further emissions mitigation as they present the remainder 41.7% emissions, and thus—globally—the estimated further carbon emission savings are more than 2.2%. Future work is required to collect all required data for these countries and follow the prescribed method to assess the overall emission mitigation comprehensively. This study considers environmental emissions only, however, other aspects such as technology cost were out of the scope of this study due to the high variability (and low data availability) of cost factors across geographical regions [19]. Therefore, similar assessments that consider different parameters can be performed in future work.
5. Conclusion
To achieve the Paris Agreement goal of limiting global temperature rise to 2 °C, the total global greenhouse gas emission must be decreased by about 1% each year (from 48 billion tonnes of CO2e in 2010 to 37 billion tonnes CO2e by 2030) [5]. As one relatively under-explored sector for achieving this, our paper investigated installing solar collectors on factory rooftops for producing industrial process heat. It was found that using the optimum mix of solar technologies for this application can indeed help accelerate this transition. Thus, rather than a blind selection of standalone PV or standalone ST technologies for the medium temperature industrial sector, this study presents evidence that factories in most locations around the world could benefit from a mix of ST and PV collectors with respect to CO2e emissions. Additionally, an embodied emissions analysis of a PV panel and an ST collector revealed that there is a huge potential for reducing the embodied emissions of solar technologies by shifting the primary energy mix to be more like Sweden's. Taking China as an example of the emission mitigation potential of manufacturer relocation (or primary energy emissions reductions) showed that 90.2 Mt CO2e per year can be saved by moving PV production from China to Sweden (∼0.2% of the total global emissions [5]). Additionally, further GHGe mitigation is possible if the side-by-side configuration is applied to the current solar potential capacity for medium temperature industrial applications. This configuration can further reduce up to 547.9 kt CO2e globally. Although the optimums presented in this paper represent only a small shift relative to total global emissions, taken together they can bring forward the projected time to peak GHGe by 6 months compared to the 2 °C median global warming temperature limit scenario [4]. Overall, this study provides a novel global perspective on the further possible emission mitigation potential by installing the currently available solar technologies in a side-by-side configuration and/or by reducing the CO2e emissions of regional solar collector manufacturing.
Acknowledgments
RA Taylor would like to acknowledge financial support from the Australian Research Council (ARC DE160100131).
Data availability statement
The data that support the findings of this study may be available from the corresponding author upon reasonable request.