

Abstract
Tree-ring records have shown a significant upward trend of late summer temperatures over the Tibetan Plateau (TP) in recent decades. More detailed instrumental observations over the TP have also shown an increase in warm extremes, especially in the high-altitude area. It is not clear whether the recent increase in occurrence of warm extremes on the TP reflects an amplification of recent temperature fluctuations or it relates to the long-term climate trend. This study aims to address the above question by analyzing long-term late summer (August–September) temperature extremes over the TP using temperature reconstructions derived from tree-ring maximum latewood density. Our results show that the recent frequency of late summer warm extremes was unprecedented over the past four centuries, while the occurrence of cold extremes in the instrumental interval was minimal. However, after the removal of long-term trend, the frequencies of both warm and cold extremes in the instrumental period are actually smaller than the pre-instrumental period, indicating a decreased variability of late summer temperatures. Thus, we conclude that the recent observed increase in warm extremes is related to the long-term warming trend, rather than an amplification of temperature variability. This finding implies that the persistent warming on the TP in the future might trigger much more frequent warm extremes with potential ecological and environmental effects.
Export citation and abstract BibTeX RIS

Original content from this work may be used under the terms of the Creative Commons Attribution 3.0 licence. Any further distribution of this work must maintain attribution to the author(s) and the title of the work, journal citation and DOI.
1. Introduction
Linked to the global warming, not only a significant increase in surface temperature was reported (IPCC 2013), but also an amplified temperature variability was found in some regions (Duan et al 2013, Cohen et al 2014, Kug et al 2015, Ma et al 2018). Following the two consequences, frequent temperature extremes occurred globally or regionally in recent decades. Specifically, increased warm extremes and decreased cold events are usually related to the warming trend, but both frequent warm extremes and anomalous coldness can be triggered by the amplified temperature variability.
The Tibetan Plateau (TP) is regarded as a sensitive area responding to global warming in the last decades (Duan and Wu 2005, Duan et al 2006, Liu et al 2006, You et al 2008, Duan et al 2015). The warming climate, especially the warm extremes, have induced large influences on ecology system (Wang et al 2011) and the natural environment (e.g. glacier retreat or melting) (Yao et al 2012) over the TP. Using instrumental data, Liu et al (2006) reported that climate warming on the TP had caused frost days to decrease and warm days to increase. They also found that most of the record-setting months for cold events occurred in the earlier part of the study period, while that of the warm events occurred mostly in the later half, especially since the 1990s (Liu et al 2006). Based on twelve indices of extreme temperature, You et al (2008) argued that temperature extremes on the TP show patterns consistent with warming during the period of 1961–2005 and a large proportion of stations showing statistically significant increase for warm extreme indices. Wang et al (2013) also suggested that the warm-related indices of temperature extremes such as warm nights and warm days, the warmest night and the warmest day, and warm spell duration indicators all have increased in the last decades. Based on an analysis of climatic data from 79 stations, Duan et al (2015) concluded that a general warming has occurred on the TP, and the warming trend is much more obvious since the 1980s than the early period. All these studies using the observations given essential knowledge for understanding the recent warming and warm extremes on the TP, but their studies are limited in the instrumental period beginning since the 1950s.
In a longer time scale, annual-resolution tree-ring data was used to reveal summer/late summer temperature extremes on the TP. Shi et al (2015) reconstructed the June–August temperature variability in the east TP over the past 212 years using a tree-ring width network, and found that extreme events of summer temperature occurred frequently since 1950. Based on the decadal evaluation, the other studies also suggested that summer/late summer temperature in the last decade (Liang et al 2009, Li et al 2018) or since the 1960s (Duan et al 2019) was unprecedented warm in the southeastern TP over their reconstruction periods. These previous tree-ring reconstructions found the recent summer/late summer warm or warm extremes over a time scale of the past several centuries. However, how the frequency changes of summer/late summer warm extremes has occurred over the TP in the past several centuries is still unclear.
In this study, we will analyze the frequency changes of late summer temperature extremes during the past four centuries based on two up-to-date August–September temperature reconstructions on the TP. Both reconstructions have a good spatial representativeness for the TP, and one of them remained the long-term trend but the other removed the long-term trend to emphasize variability. Thus, both the warming-related and warming-unrelated late summer temperature extremes are analyzed to clarify the potential cause for the frequency changes of temperature extremes on the TP.
2. Data and methods
2.1. Tree-ring reconstruction series
Two up-to-date reconstruction series of August–September mean temperature based on tree-ring maximum latewood density (MXD) on the TP (Duan et al 2018, 2019) are used to identify the late summer temperature extremes over the past four centuries. One of the August–September temperature series covering the period of 1572–2014 was reconstructed based on the actual August–September mean temperature anomalies with respect to 1986–2005 (hereafter TAug–Sep-ano), and thus it remains the long-term trend (Duan et al 2019). The other reconstruction covers the interval of 1620–2014 (Duan et al 2018), but this reconstruction was performed based on the instrumental August–September temperature deviations in each year relative to the preceding 5 year mean (hereafter TAug–Sep-dev). Thus, the TAug–Sep-dev does not remain the long-term trend of August–September temperature changes. Both reconstructions show a good spatial representativeness for August–September temperature variability over the TP (i.e. 79-station average) (Duan et al 2018, 2019).
Variation of tree-ring MXD depends on the thickening of latewood cell walls, and thus it is generally very sensitive to light or surface air temperature (Briffa et al 1988, Schweingruber et al 1991), especially in the high-elevation and high-latitude regions (e.g. the TP and the northern high latitudes) (Stine and Huybers 2014, Duan et al 2017). Both reconstructions used in this study were obtained using tree-ring MXD data from high-elevation sampling sites (the average elevation is about 3800 m a.s.l.) on the TP, and the statistics of calibration and verification of regression models from both reconstructions show robust signal of August–September temperature. The correlation coefficients between tree-ring indices and instrumental data is 0.75 over the common period of 1956–2014 for TAgu-Sep_dev and 0.80 in the common period of 1951–2014 for TAgu-Sep_ano, respectively. Both the reduction of error and the coefficient of efficiency are positive in all split-period verifications for the two reconstructions. Moreover, all sign tests reach the significance level of 0.001. All these statistics of calibration and verification of the regression models indicate very robust signals of August–September temperature from both reconstructions. Five years less in the calibration period of TAgu-Sep_dev reconstruction than in TAgu-Sep_ano reconstruction is due to TAgu-Sep_dev reconstructin was calculated as a deviation relative to the preceding 5 year mean. The good response relationship of tree-ring MXD to August–September temperature extremes can also be demonstrated by the good match of the cross-dating results using COFFECHA software (Holmes 1983), i.e. a coherently low MXD among the 17 sites occurs in those extremely cold years and a coherently high MXD among the 17 sites occurs in those extremely warm years.
2.2. Climatic data
The gridded land surface air temperature dataset CRU TS4.01 Mean Temperature (hereafter CRUT4.01) with a spatial resolution of 0.5° by 0.5° (Jones and Harris 2008) was used to present the spatial characteristics of late summer temperature extremes occurred in the instrumental period. The instrumental period is defined as the interval of 1951–2014, in which most of the grids and meteorological stations have data on the TP. Gridded geopotential height data obtained from the NOAA/OAR/ESRL PSD (http://esrl.noaa.gov/psd/) with a spatial resolution of 2° by 2° are used to analyze the related atmospheric circulations.
2.3. Definition of the late-summer temperature extremes
According to the recommendation of World Meteorological Organization (WMO), generalized extreme value (GEV) distributions (Klein Tank et al 2009) was applied to define extreme temperature events during 1620–2014 for the two reconstructions. A 25 year return period was chosen as the threshold of extreme events of the reconstructions, i.e. temperature anomalies respond to a return period more than 25 years were defined as extreme events. To reveal the frequency characteristics of late summer tempeature extremes, the number of both warm and cold extremes were counted in each 50 year interval. Composite analyses of the geopotential height fields at 500 hpa were performed to reveal the large-scale atmospheric circulations resulting in the late summer tempeature extremes. The significance of composite responses was tested using a Monte Carlo resampling procedure based on ensembles of 10 000 random surrogates derived from permutation of the composite matrices.
3. Results
3.1. Late summer temperature extremes on the TP since 1620
Based on the GEV distributions, August–September temperature anomalies in a return period of 25 years are 0.29 °C and −1.48 °C for TAgu-Sep_ano reconstruction and 0.86 °C and −0.79 °C for TAgu-Sep_dev reconstruction (figure 1). Thus, August–September temperature anomalies greater/smaller than 0.29 °C/−1.48 °C were identified as August–September warm/cold extremes for the TAgu-Sep_ano reconstruction, while August–September temperature anomalies greater/smaller than 0.86 °C/−0.79 °C were identified as August–September warm/cold extremes for TAgu-Sep_dev reconstruction. Identified August–September tempeature extremes from both reconstructions show changes in frequency (figure 2). The reconstruction series of TAgu-Sep_ano shows that most of the late summer warm extremes occurred in the past 40 years (14 out of 16 warm extremes occurred in this period), while only 1 cold extremes occurred in the instrumental period (figure 2(b)). The most frequent warm extremes and the few cold extremes in recent decades respond to the unprecedented recent late summer warming over the past four centuries (figure 2(a)). Compared to the extreme events identified from the TAgu-Sep_ano reconstruction series, late summer tempeature extremes identified from the TAgu-Sep_dev reconstruction series show different characteristics of frequency changes (figures 2(c) and (d)). Figure 2(d) shows that it appears to be less TAgu-Sep-dev extremes occurred in the instrumental period than the preceding period, i.e. no warm extreme and three cold extremes in the instrumental period. Overall, different frequency characteristics of late summer temperature extremes exist between the TAgu-Sep-ano (figure 2(b)) and TAgu-Sep-dev (figure 2(d)) reconstruction series over the past four centuries.

Figure 1. Return period (years) in TAug–Sep_ano reconstruction (a) and TAug–Sep_dev reconstruction (b) based on GEV distributions. The blue lines are for cold events and the red lines are for warm extremes. The dotted lines indicate the values when the return period equals to 25 years, which are used as thresholds to define extreme events in this study.
Download figure:
Standard image High-resolution image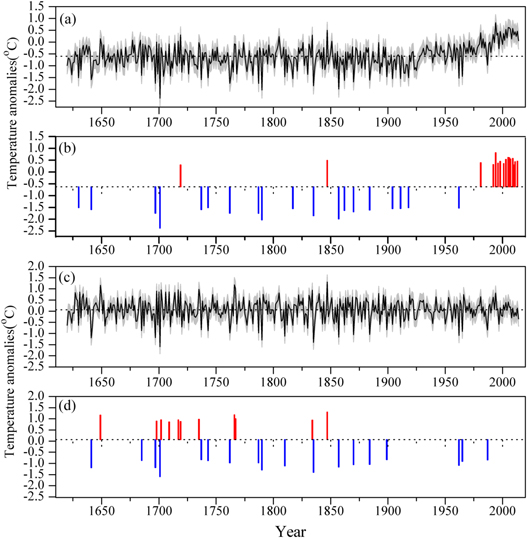
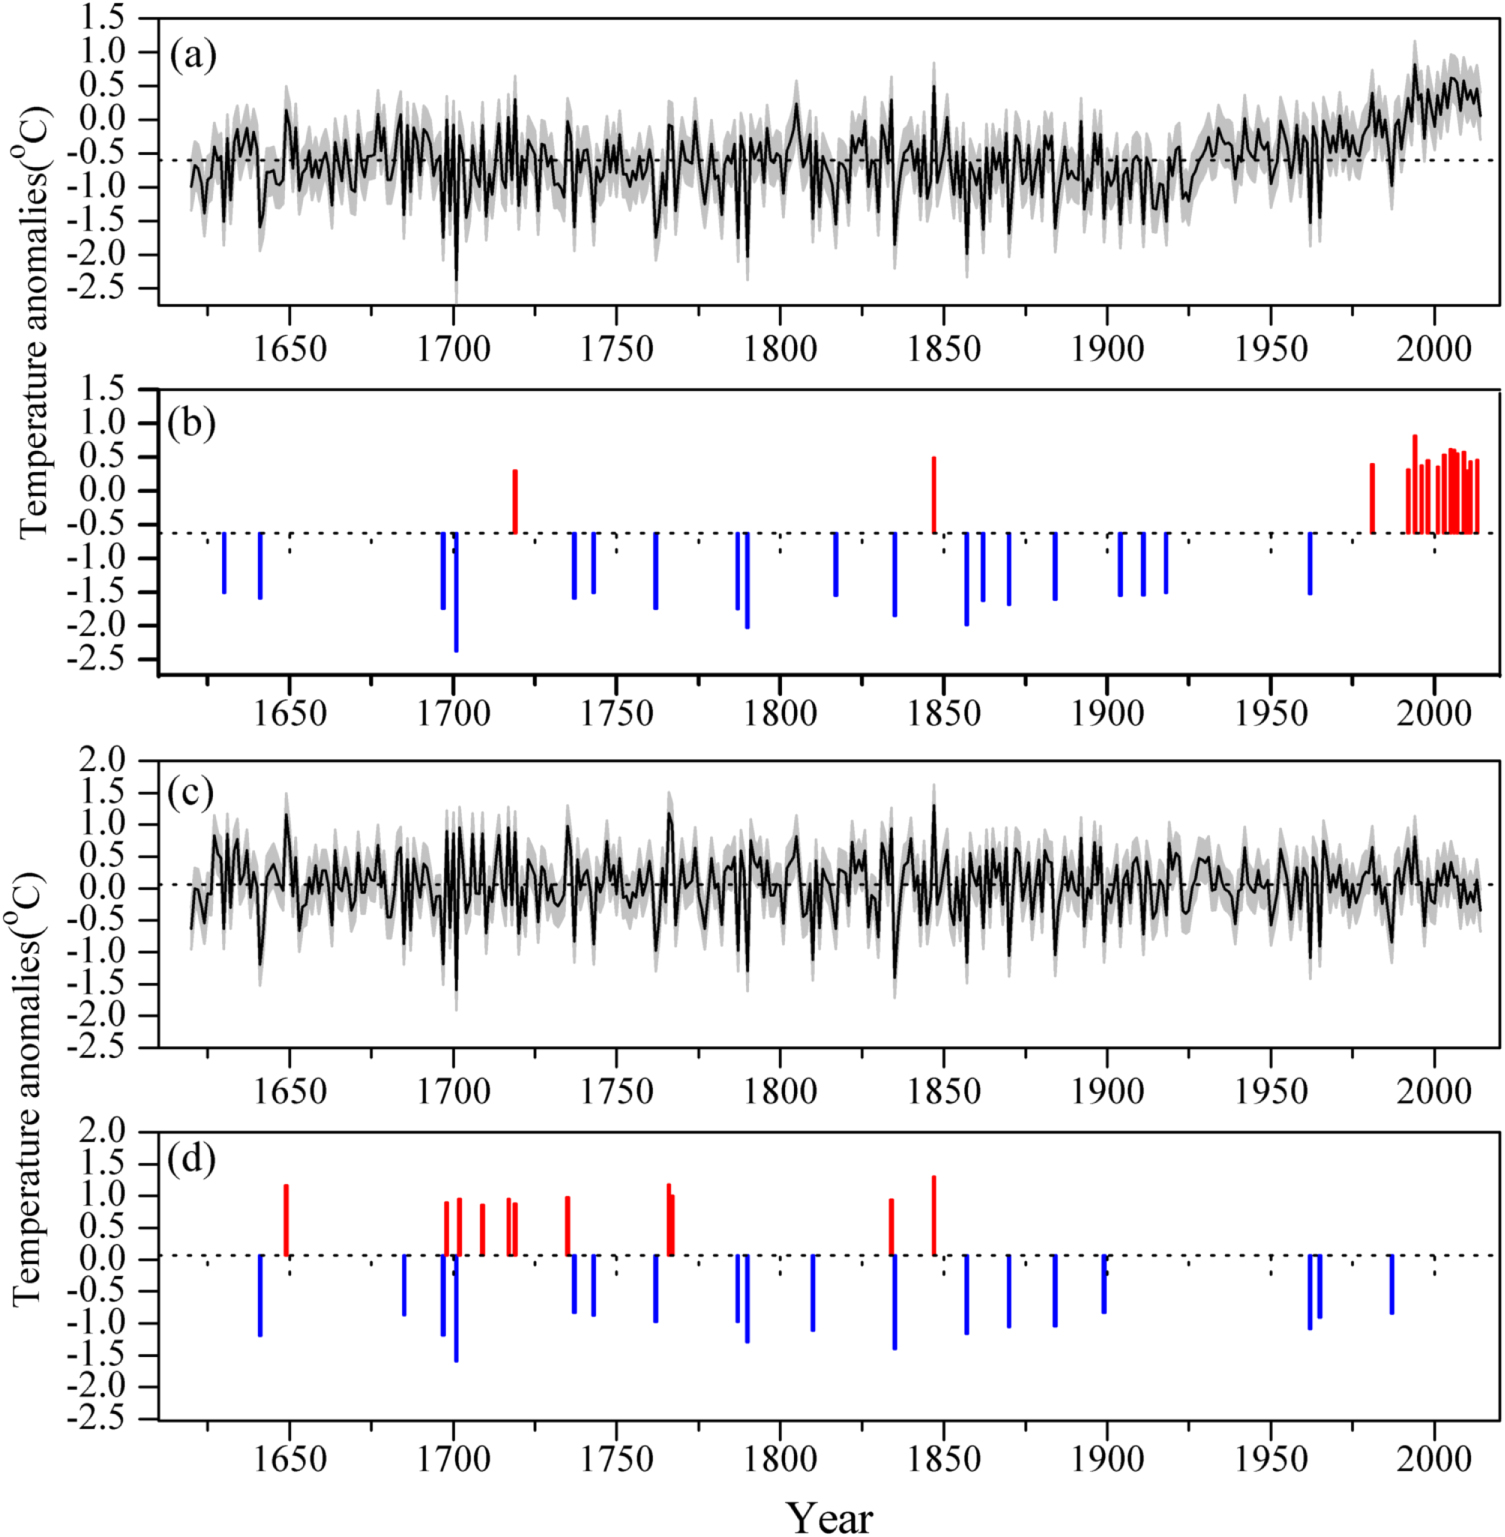
Figure 2. August–September temperature variability and extremes on the TP since 1620. (a) Reconstructed August–September temperature anomalies (TAgu-Sep_ano) since 1620 (retaining the long-term trend) (Duan et al 2019). (b) Identified August–September temperature extremes based on the reconstruction series TAgu-Sep_ano. (c) Reconstructed August–September temperature deviations in each year relative to the preceding 5 year mean (TAgu-Sep_dev) back to 1620 (removing the long-term trend). (d) August–September temperature extremes identified from the reconstruction series TAgu-Sep_dev. Extreme events are defined using GEV distributions with a return period more than 25 years. The black line in (a), (c) indicates the annual value of the reconstruction and the gray shaded area indicates the reconstruction uncertainty. The dashed lines in (a), (b) indicate the mean of the reconstruction series TAgu-Sep_ano and the dashed lines in (c), (d) indicate the mean of the reconstruction series TAgu-Sep_dev.
Download figure:
Standard image High-resolution image3.2. Frequency changes of late summer temperature extremes on the TP
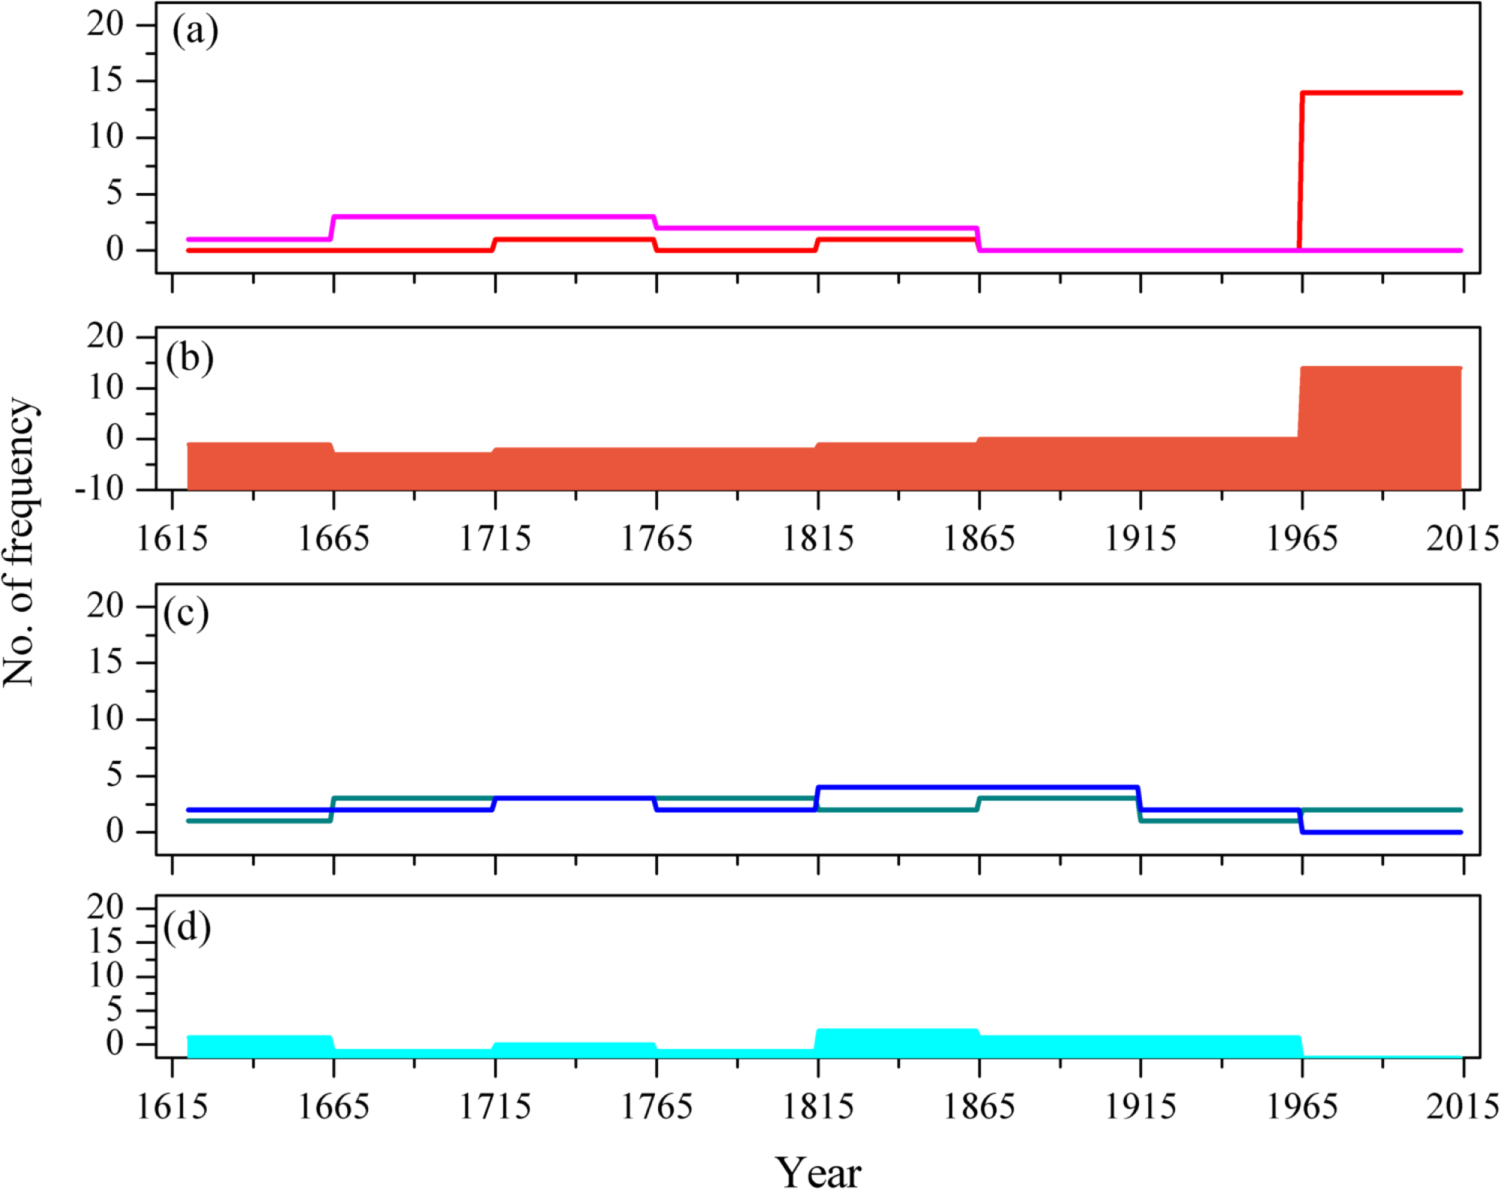
To reveal the long-term frequency changes of late summer temperature extremes on the TP, especially for a comparison between the instrumental period and the pre-instrumental period, the number of extremes occurred in the period 1620–2014 were counted in each 50 year interval both for the TAgu-Sep_ano and TAgu-Sep_dev reconstruction series (figure 3). A 50 year interval used to count the number of extremes was based on the consideration that this interval is near the length of the observations. The results show that the frequency of late summer warm extremes derived from the TAgu-Sep_ano resonstruction (red line in figure 3(a)) is unprecedented in the last 50 year interval. However, the frequency of warm extremes identified from the TAgu-Sep_dev reconstruction appears to decrease since 1865 (magenta line in figure 3(a)). Simutaneously, the difference of the frequency of late summer warm extremes between the two situations (i.e. derived from the TAgu-Sep_ano reconstruction and the TAgu-Sep_dev reconstruction) became larger after the 1865, and the largest difference occurred in recent 50 years (figure 3(b)). Both frequencies of late summer cold extremes identified from the TAgu-Sep_ano and TAgu-Sep_ano reconstructions show relatively smaller changes (figures 3(c) and (d)) than the warm extremes (figure 3(a) and (b)) over the past four centuries. The frequency of late summer cold extremes identified from the two reconstruction series appears to show a decrease trend in the last century (figure 3(c)).

Figure 3. The trend of frequency changes of August–September temperature extremes on the TP over the period 1620–2014. (a) Changes of the frequency of late summer warm extremes in each 50 year interval derived from the TAug–Sep-ano reconstruction series (red line) and the TAug–Sep-dev reconstruction series (magenta line). (b) The difference between frequencies of late summer warm extremes derived from the TAug–Sep-ano reconstruction and the TAug–Sep-dev reconstruction. (c) Changes of occurrence frequency of late summer cold extremes in each 50 year interval derived from the TAug–Sep-ano reconstruction series (dark cyan) and the TAug–Sep-dev reconstruction series (blue line). (d) The difference between frequencies of late summer cold extremes derived from the TAug–Sep-ano reconstruction and the TAug–Sep-dev reconstruction.
Download figure:
Standard image High-resolution image4. Discussions
4.1. Spatial characteristics of late summer temperature extremes on the TP
Besides the frequency changes of late summer temperature extremes with time, the spatial scale of the extremes covered is the other important aspect to understand the TP temperature extremes. There is no gridded August–September temperature reconstruction available, we here use the observed grid dataset of CRUT4.01 to discuss the spatial characteristics of late summer temperature extremes on the TP during the instrumental period. In order to highlight the spatial characteristics of the top extremes, we chose the first five of the twelve warm extremes (i.e. 1994, 2005, 2006, 2007, 2009) identified from the TAug–Sep-ano reconstruction (remaining the long-term trend) to compared with the one warm extreme (i.e. 1994) identified from TAug–Sep-dev reconstruction (not remaining the long-term trend) (figure 4). It can be found that year 1994 is included in both situations, and the spatial characteristics are basically same (figures 4(a) and (b)). The other four extremely warm years identified only from the TAug–Sep-ano reconstruction show warming in a larger spatial scale than the year 1994. This indicates that the extremely warm year 1994 was not resulted from the recent warming trend, but the other four years were done. These results imply that those warm extremes induced by the warming trend generally occur in a larger spatial scale than those warm extremes unrelated to the warming trend. The extremely cold years 1962 identified from the TAug–Sep-ano reconstruction series was also found in the TAug–Sep-dev reconstruction series. Both situations show a similar spatial characteristic (figure 5). All those extremely cold years show a relatively smaller spatial scale (figure 5) than those extremely warm years (figure 4), suggesting that the extremely cold late summers on the TP were unrelated to the large-scale trend.

Figure 4. Spatial characteristics of the top late summer warm events identified from the TAgu-Sep_dev reconstruction (a) and the TAgu-Sep_ano reconstruction (b)–(f). The black rectangle denotes the scope of the TP. The unit in (a) is °C, an anomaly with respect to the mean of the preceding 5 years. The unit in (b)–(f) is °C, an anomaly with respect to the mean of the instrumental period (i.e. 1956–2014).
Download figure:
Standard image High-resolution image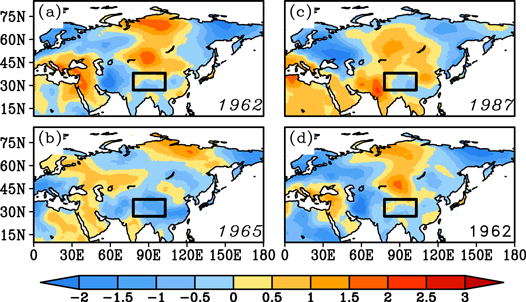
Figure 5. Spatial characteristics of the late summer cold extremes identified from the TAgu-Sep_dev (a)–(c) and TAgu-Sep_ano (d) reconstructions. The black rectangle denotes the scope of the TP. The unit in (a)–(c) is °C, an anomaly with respect to the mean of the preceding 5 years. The unit in (d), (e) is °C, an anomaly with respect to the mean of the instrumental period (i.e. 1956–2014).
Download figure:
Standard image High-resolution imageCompared to other studies in other regions, the unprecedented frequency of the recent warm extremes has also been found in the northern high-latitudes over the past 600 years (Tingley and Huybers 2013). However, extreme temperature events are sometimes regional. For example, Europe experienced the unprecedented heatwave in 2003 during 1500–2003 (Luterbacher et al 2004), but it did not occur in other regions or it was not unprecedented. Similarly, the record-breaking coldwave occurred in Southeastern China in 2008 (Duan et al 2013), but it did not occur in other regions. In this study, our analyses results also indicate the regional characteristic of August–September temperature extremes on the TP (figures 4 and 5).
In view of the observed records of August–September mean temperature near our tree-ring sampling sites (varies from 6.8 °C (minimum) to 16.2 °C (maximum)), August–September cold extremes on the TP can definitely limit the growth of tree rings, but the warm extremes are still favorable to trees growth. For other ecosystems, such as meadows and shrubs, on the TP, some studies reported that warming can induce a degradation of meadows (Wang et al 2011), but may increase the area of shrubs (Gao et al 2016).
4.2. Potential causes for the frequency changes of late summer tempeature extremes on the TP
The most distinctive feature of the frequency changes of late summer tempature extremes on the TP is the unprecedented recent warm extremes over the past four centuries. Extreme temperature events can be triggered by either an increase/decreased trend (warm/cold extremes) or the increased variability (i.e. the increased variance). Comparisons between the late summer warm extremes identified from the TAug–Sep-ano and TAug–Sep-dev reconstructions (a large difference) demonstrates that the unprecedented frequency of the recent late summer warm extremes on the TP is a result of the persistent warming in recent decades. Moreover, we can also find that the frequency of late summer warm/cold extremes derived from the TAug–Sep-dev reconstructions has decreased since 1865/1900 (figures 2 and 3), which are earlier than the instrumental interval. This indicates a post-industrial decrease of late summer tempature variability on the TP. Therefore, we conclude that the unprecedented frequency of late summer warm extremes on the TP in recent decades is linked to the warming trend rather than an increased variability found in other regional. However, the decreased frequency of late summer cold extremes can be related to both the warming trend and the decreased variability of late summer tempature on the TP since the 19th Century (figures 2(a) and (c)). Based on previous studies (Chen et al 2003, Duan et al 2006), the increased trend of surface temperature on the TP in recent decades can be attributed to increased concentrations of greenhouse gases. However, the occurrence of specific August–September warm extremes on the TP are related to specific atmospheric circulations.
4.3. Related atmospheric circulations of the recent late summer temperature extremes on the TP
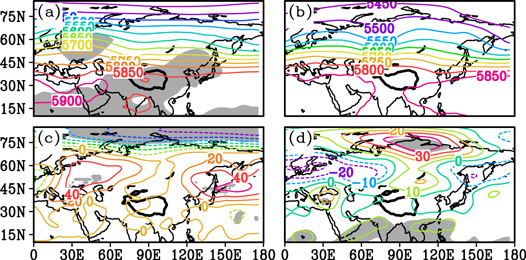
Composite analyses of 500 hpa geopotential filed can provide dynamic mechanisms for the late summer temperature extremes related and unrelated to the warming trend (figure 6). Considering the large difference of the number of extremes in the instrumental period derived from the two reconstruction series (i.e. 14 warm extremes were identified in the TAgu-Sep_ano reconstructions and no one warm extreme was identified in the TAgu-Sep_dev reconstructions), we performed the composite analysis of 500 hpa geopotential field using extremes years identified in the instrumental period derived from the two reconstruction series in the instrumental interval (i.e. 1951–2014). Because too few extreme events (sometimes only one) are identified using a 25 year return period based on the GEV distributions for the instrumental August–September data to perform the composite analysis of 500 hpa geopotention height with a significance test, the extreme warm/cold years in the instrumental period are identified as the mean of August–September temperature over the period of 1951–2014 plus/minus the 1.5 SD. As a result, seven extremely warm year (i.e. 1994, 2003, 2005, 2006, 2007, 2009 and 2010) and three extremely cold years (i.e. 1956, 1959, 1965) were identified for the instrumental TAug–Sep-ano, while four extremely warm years (i.e. 1981, 1989, 1994, 2005) and seven extremely cold years (i.e. 1956, 1959, 1965, 1976, 1984, 1986 and 2008) were identified for the instrumental TAug–Sep-dev. We clarify that although more extreme years obtained using instrumental data than reconstruction series over the instrumental interval (1951–2014), the general spatial characteristics of the occurrence of the late summer temperature extremes do not changes between them (figure not shown). The composite analyses show that the occurrence of late summer warm extremes derived from the TAug–Sep-ano links to large-scale positive anomalies of 500 hpa geopotential height in the low latitudes of the North Hemisphere, while there is no a significantly large-scale circulation anomalies was found for those late summer cold extremes (figures 6(a) and (b)). However, the occurrence of late summer warm extremes identified from TAug–Sep-dev significantly links to the anomalous high in northern mid-high latitudes, while those late summer cold extremes significantly links to the anomalous low in the northern mid-high latitudes (figures 6(c) and (d)). These results suggest that the late summer warm extremes related and unrelated to the recent warming trend presenting different spatial scales and links to different atmospheric circulations.
Figure 6. Composited 500 hPa geopotential height (gpm) fields for late summer warm (a), (c) and cold (b), (d) extremes. Late summer temperature extremes in (a), (b) were derived from the TAgu-Sep_ano and in (c), (d) were derived from the TAgu-Sep_dev. The bold black line indicates the scope of the TP. The shaded areas indicate the geopotential height anomalies exceeding 0.05 significance level.
Download figure:
Standard image High-resolution image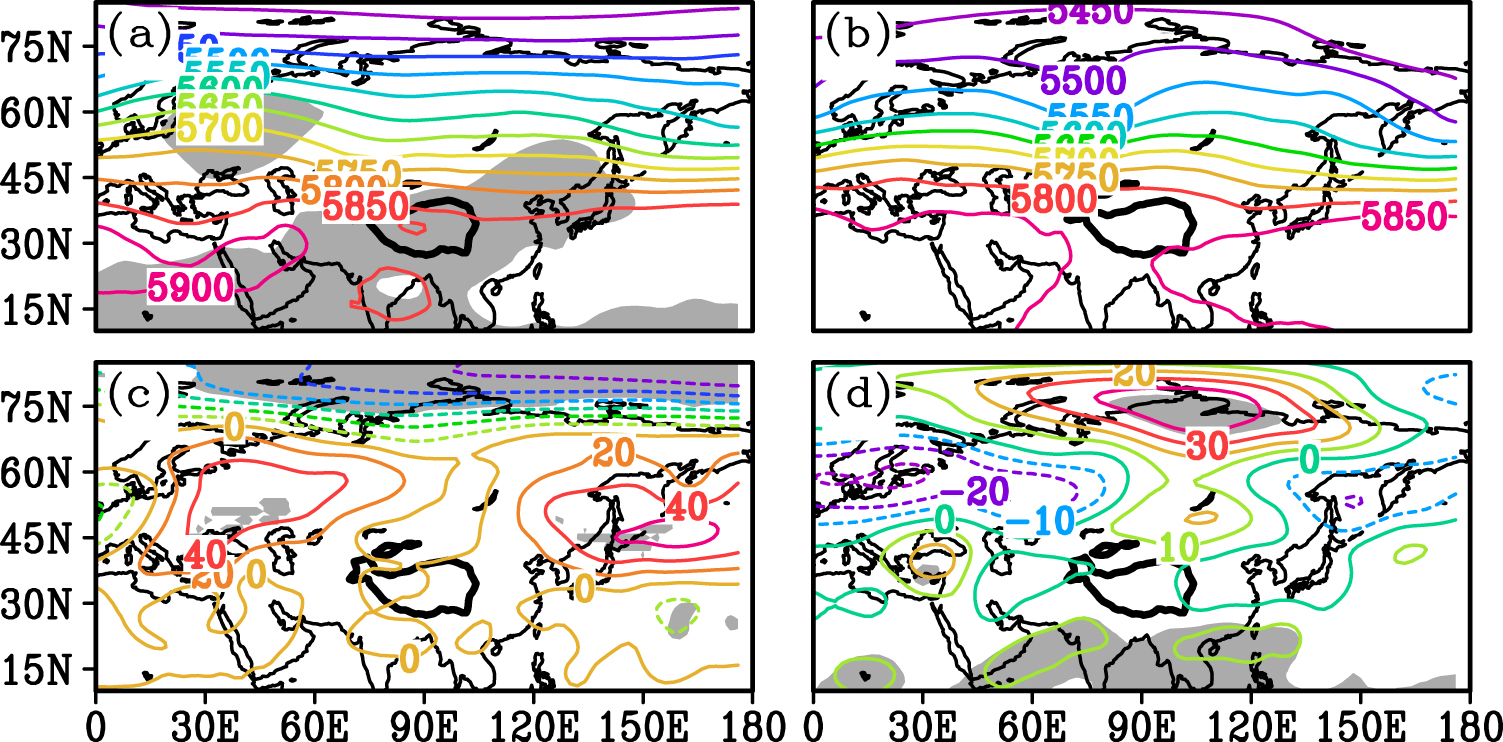
5. Conclusions
In this study, we revealed the frequency changes of late summer temperature extremes on the TP over the past four centuries using two up-to-date tree-ring densitybased temperature reconstructions. We found that the frequency of late summer warm extremes in recent decades was unprecedented on the TP over the past four centuries, while late summer cold extremes occurred at minimum in recent decades. When the long-term trend was removed, the frequencies of late summer warm and cold extremes show a decreased trend since the late 19th century (warm extremes) or the early 20th century (cold extremes), indicating a post-industrial decrease of late summer temperature variability on the TP. These results demonstrate that the unprecedented recent late summer warm extremes on the TP were triggered by the warming trend rather than the amplified temperature variability, while rare cold extremes in recent decades can be related to both the rising temperature trend and the decreased temperature variability. Moreover, analyses based on observed grid dataset show that late summer warm extremes induced by the warming trend generally occurred in a larger spatial scale than those unrelated to the warming trend.
Acknowledgments
This research was supported by the National Key R&D Program of China (2016YFA0600404), the National Natural Science Foundation of China (Grants 41875113 and 41471035). Peili Wu was supported by the UK-China Research & Innovation Partnership Fund through the Met Office Climate Science for Service Partnership (CSSP) China as part of the Newton Fund.
Data availability statement
The data that support the findings of this study may be available from the corresponding author upon reasonable request.