


Abstract
Increased deployment of solar farms in the last decade is coincident with continued monitoring of surface spectral reflectances by the moderate resolution imaging spectroradiometers (MODIS) aboard NASA Aqua satellite. By analyzing the surface spectral reflectances retrieved at seven MODIS shortwave bands, this study quantifies the changes of surface spectral reflectances caused by solar farms commissioned in the southwestern US. Our case study using one solar farm indicates a 20%–25% reduction of surface reflectance over the seven MODIS bands due to the solar panel installation. Radiative transfer calculation shows that such a reduction in surface spectral reflectance leads to a ∼23% decrease in the upward shortwave broadband flux at the surface and a ∼14%–18% decrease in the clear-sky reflected shortwave flux at the top of atmosphere (TOA). Though the MODIS surface reflectance retrievals can be affected by other factors such as aerosol or thin-cirrus contaminations, five out of six solar farm sites analyzed here show unambiguously detectable changes of surface reflectances due to solar panel installations. The brighter the surface is at a given MODIS band before the solar-farm construction, the larger the spectral reflectance reduction tends to be. If all the bright deserts, which occupies about 4% of the global surface, were covered with the solar panels similar to what has been studied here, the estimated instantaneous TOA shortwave radiative forcing would be no more than 1.1 W m−2.
Export citation and abstract BibTeX RIS

Original content from this work may be used under the terms of the Creative Commons Attribution 4.0 license. Any further distribution of this work must maintain attribution to the author(s) and the title of the work, journal citation and DOI.
1. Introduction
Replacing fossil fuel with renewable energy is a key step towards the reduction of greenhouse emissions. Among a variety of renewable energy options, harvesting solar energy (hereafter referred to as solar farming) is one of the most practical choices due to its easy accessibility. In the last two decades, more and more solar farms have been deployed and in operation. In the US, most large-scale solar farms have been built in the deserts, where there is plenty of sunlight with little cloud shading, to achieve maximum power generation efficiency (Ito et al 2003).
As local climate can affect the efficiency of solar farming (Tahri et al 2015, Zoghi et al 2017, Shorabeh et al 2019), these solar panels can also potentially influence the local climate by directly altering the surface reflectance and, consequently, modifying the surface energy budget (Fthenakis and Yu 2013, Barron-Gafford et al 2016, Armstrong et al 2016, Yang et al 2017, Demirezen et al 2018). Typical desert surfaces can have a broadband shortwave albedo ranging from 0.25 to 0.40 (Petty 2006). Solar panels have been designed to absorb a portion of incident solar energy for power generation; the current conversion efficiency (fraction of incoming solar energy converted to electricity) ranges from 10.5% to 26.7% (Green et al 2020). As a result, it can reduce the local surface albedo and reduce the solar energy reflected back to the atmosphere. The rest solar energy neither reflected nor converted to electricity will then affect the surface energy budget.
Many in-situ studies have investigated the local effect of solar farming by comparing the temperature around and away from the solar panels. Some studies suggested that solar farms can result in a photovoltaic heat island (PVHI) effect due to less reflected solar energy (Barron-Gafford et al 2016), while some studies argued that the heat island effect is negligible, as the solar panels will cool down completely at night (Armstrong et al 2016). Yang et al( 2017) used a set of in-situ instruments to carry out a detailed analysis of microclimate, including surface albedo, soil temperature, and air temperature based on field observations. The mean shortwave broadband albedo in the solar farm was estimated to be 0.19, 0.07 lower than the surrounding region, and the 2 m air temperature was found to be higher in the PV power station. However, in-situ observations used in the aforementioned studies were confined to the local sites, not necessarily available to all solar farm sites. Moreover, such in-situ observations usually were not available before the solar farm construction. Moderate resolution imaging spectroradiometers (MODIS) aboard NASA Terra and Aqua satellites have been in operation since 2000. It retrieves surface spectral reflectance at several shortwave bands with a spatial resolution of 500 m. Many large-scale solar farms have been built after 2000, and their spatial coverage can be well resolved by the 500 m MODIS pixels. Therefore, a meaningful question to ask is whether MODIS can detect the impact of solar farms on surface reflectance. If so, the impact on surface and top-of-atmosphere (TOA) radiation budget can be further inferred. This is the primary motivation for this study.
In order to study how large-scale deployment of solar farms would affect the climate system, climate models have been employed to explore the potential climate effects of solar farming. An idealized modeling study by Hu et al( 2016) suggested that solar panels virtually placed in the Sahara desert could induce a regional cooling effect due to solar energy removed by the solar panels from the climate system which, otherwise, would be absorbed by the ground. Their modeling studies further suggested that such a cooling effect over the vast area of Sahara could further modify the atmospheric circulation (Hu et al 2016). The other modeling study by Li et al( 2018) drew a different conclusion that a warming climate with increasing rainfall could be expected locally, resulted from a decrease of shortwave reflection. Li et al( 2018) also suggested that remote climate effects of temperature and precipitation are limited. Why the two studies drew contradictory conclusions is at least partly due to the different assumptions made in each study. Hu et al( 2016) assumed a higher energy conversion rate than Li et al( 2018). Hu et al( 2016) also assumed that all the desert surface was fully covered by solar panels, resulting in more attenuation of solar energy at the ground and thus inducing a strong cooling effect. Satellite-based surface reflectance analysis over multiple solar farm sites can help provide constraints on the energy conversion rate used in such modeling study, making future modeling studies constrained by actual observations. As a first step towards this goal, this study will use MODIS observations to derive changes in the surface spectral reflectance caused by solar farms, and then estimate the impact of such surface reflectance change on the radiation budget.
The rest of this paper is organized as follows. Section 2 introduces the MODIS data, the forward radiative transfer model, and the solar farms used in the study. Using one solar farm site as a case study, section 3 depicts the changes of surface shortwave spectral reflectances and their impact on the radiation budget. Section 4 then summarizes the surface spectral reflectance changes for six solar farms constructed in the southwestern United States. Further discussion and conclusions are then given in section 5.
2. Data and methodology
The primary observations used in this study are from MODIS aboard NASA Aqua satellite. MODIS is a 36-band imaging spectroradiometer with spectral coverage from visible to the infrared. MODIS on Aqua has been in operation since September 2002. Further details of MODIS instruments and retrievals can be found in King et al( 2003, 1992).
This study uses the MODIS Level-3 8 d global surface spectral reflectance products from Aqua satellite (MYD09A1) (Vermote 2015), which contains the surface reflectance of seven spectral bands (Band No. 1–7, ranging from 0.46 μm to 2.16 μm with a bandwidth ranging from 0.02 to 0.05 μm) at a spatial resolution of 500 m. Each pixel contains the best possible observation during an 8 d period based on high observation coverage, low view angle, the absence of clouds and cloud shadow, as well as low aerosol loading. The processing algorithm addresses several problems in the retrieval process, including gaseous and aerosol attenuation, adjacency effects by variation of land cover, bidirectional reflectance distribution function (BRDF) and atmosphere coupling effects, as well as contamination by thin cirrus. The accuracy of the retrieval heavily depends on the availability of MODIS aerosol retrieval (Vermote et al 1997), and the absolute errors for all bands were estimated to be within 0.01 (Vermote 2015). Quality flags provided by the product are used to filter out low-quality data. Pixels identified as snow, ice and clouds are rejected. Only pixels with the highest retrieval quality are analyzed in this study.
MODTRAN5 (Moderate Transmission Code, version 5) is used here as the forward radiative transfer model to evaluate the impact of surface reflectance change on the surface and TOA radiation budgets. MODTRAN5 was collaboratively developed by Spectral Sciences Inc. and Air Force Research Laboratory (Berk et al 2005). It is based on HITRAN2K line compilation with updates through 2004 (Rothman et al 1998, 2005). Comparisons between MODTRAN5 and a line-by-line radiative transfer model, LBLRTM (Clough and Iacono 1995, Clough et al 2005), show agreement up to a few percent or better (Anderson et al 2006). MODTRAN5 has been widely used in remote sensing studies and applications.
This study analyzes six solar farms in the Southwest United States that were constructed during the MODIS era and are still operating. Their spatial coverages range from 8 to 19 km2; thus all can be well resolved by the MODIS observations. Table 1 summarizes the relevant information about all six solar farm sites, as well as the acronym of each site to be used in the following sections.
Table 1. Basic information about the six solar-farm sites examined in this study. The unit for power generation is megawatts in alternative current (MWAC).
| Full name and acronym | Location | Starting year of construction | Year of commission | Site area | Power (nominal capacity) |
|---|---|---|---|---|---|
| Solar Star (SSSF) | Rosamond, California | 2011 | 2015 | 13 km2 | 579 MWAC |
| Topaz Solar Farm (TSF) | Carrizo Plain, California | 2011 | 2014 | 19 km2 | 550 MWAC |
| Desert Sunlight Solar Farm (DSSF) | Riverside County, California | 2012 | 2015 | 16 km2 | 550 MWAC |
| Copper Mountain Solar Facility (CMSF) | Boulder City, Nevada | 2010 | 2016 | 16 km2 | 552 MWAC |
| California Valley Solar Ranch (CVSR) | Carrizo Plain, California | 2011 | 2013 | 8 km2 | 250 MWAC |
| Agua Caliente Solar Project (ACSP) | Yuma County, Arizona | 2011 | 2014 | 10 km2 | 290 MWAC |
3. MODIS observed changes at Desert Sunlight Solar Farm
We will first use one solar farm, the Desert Sunlight Solar Farm (DSSF), as a case study to examine, in detail, the MODIS observed changes of the surface spectral reflectances, followed by an estimation of radiative flux changes caused by such changes of the surface spectral reflectances.
3.1. Observed changes in the surface reflectance
The DSSF site is located in Riverside County, California. It was built between 2012 and 2015 and commissioned in 2015 with a power capacity of 550 MW. The total site area is 16 km2. Figure 1 shows aerial snapshots of the solar farm and adjacent areas before the construction and after the commission.
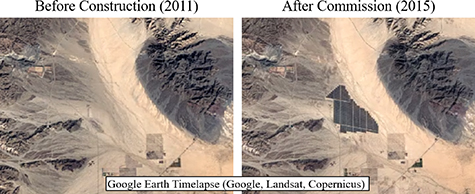
Figure 1. Satellite images that contain the Desert Sunlight Solar Farm (DSSF) and its adjacent area before (left) and after its commission (right). The DSSF site is at the center of the map. Photos are extracted from Google Earth Timelapse (https://earthengine.google.com/timelapse/).
Download figure:
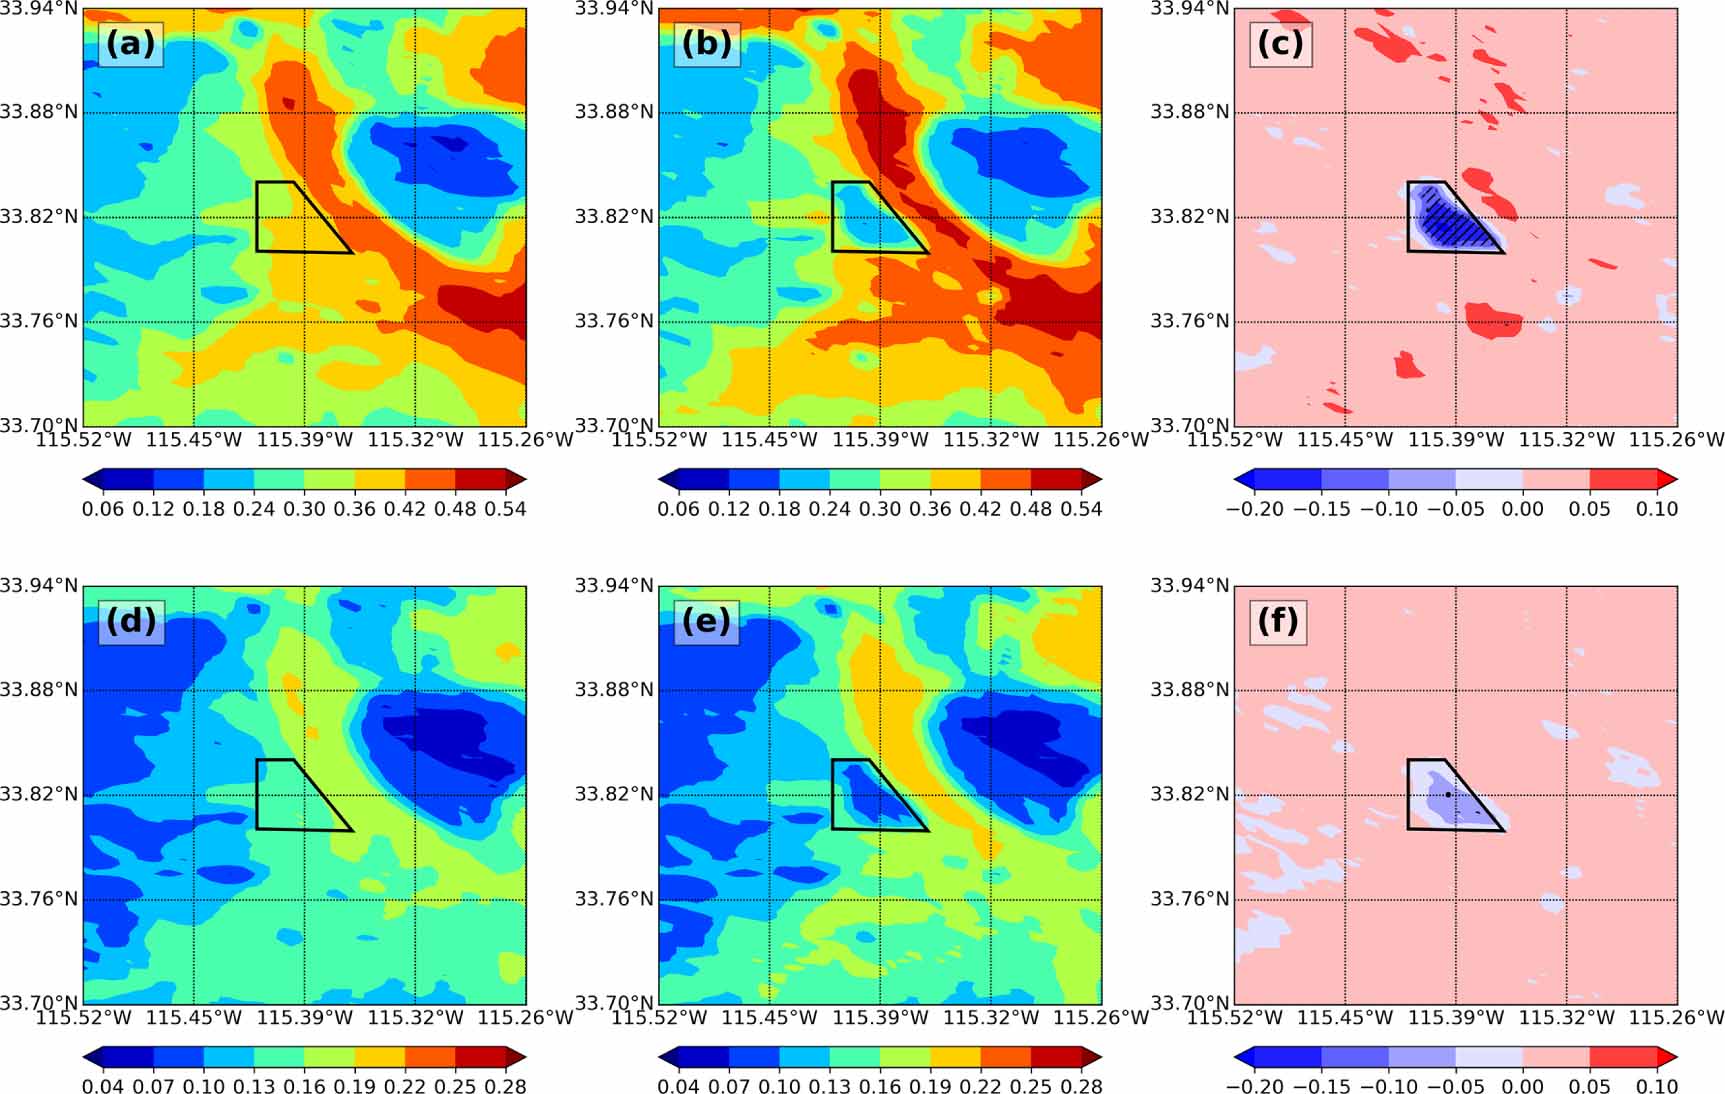
Standard image High-resolution imageFirst, using 2009 and 2018 to represent a typical year before and after the solar farm commissions, respectively, the annual-mean surface reflectances are compared to each other (figure 2). The statistical significance of the annual-mean difference is assessed by the student's t-test applied to the 8 d MODIS surface reflectance time series. The surface reflectance change over the solar farm is negative for both bands shown in figure 2. Reduction for the reflectance of MODIS Band 7, a near-infrared band centered at 2.13 μm, can be as large as 0.16. For MODIS Band 3, the blue band, the reduction is ∼0.06 or less. The reflectance changes in other areas are mostly positive and are all statistically insignificant. Using Band 7 as an example, the surface reflectance differences outside the DSSF site, as shown in figure 2, have a mean of 0.02 with a standard deviation of 0.01 and are statistically insignificant. In contrast, the changes within the DSSF site (black trapezoid in figure 2) have a mean of −0.12 with a standard deviation of 0.06.
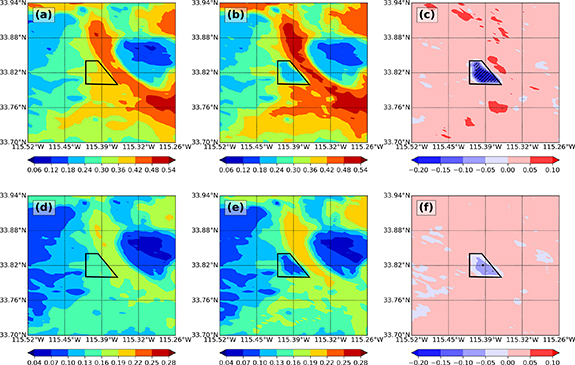
Figure 2. (a, b) MODIS Band 7 (a near-infrared band, 2.105–2.155 μm) annual-mean reflectance in 2009 and 2018, respectively. (c) The differences between the 2018 and 2009 results, with black hatches indicating a 1% significance level based on the student's t-test. (d–f) Identical to the first row but for Band 3 (the blue band, 0.459–0.479 μm). Note that different color scales are used for the Band 7 and Band 3 reflectances. The DSSF location is marked as a black trapezoid in all the panels. The MODIS spatial resolution here is 500 m.
Download figure:
Standard image High-resolution imageTo further establish the causality between the change of surface reflectance and the solar farm commission, we choose four rectangular areas (C1–C4 in figure 3) outside the solar farm (referred as control field sites hereafter) and plot their time series of the surface reflectance together with that of the solar farm (SF in figure 3). The control fields are selected based on the following criteria: (1) having the same surface area as the solar farm, (2) no visible land cover change from true color satellite imageries over the entire period, and (3) flat topography within the control field. Both the raw time series from 8 d MODIS reflectance product and their 13-point (i.e. 104 d) moving averages are shown in figure 3. All time series, after 13-point moving average, clearly show the same seasonal cycle, with a maximum in the summer and minimum in the winter. However, the solar-farm time series of both Band 7 and Band 3 reflectances have a drop from 2012 to 2015 in accordance with the construction period of the DSSF, while the rest time series does not have such changes between 2012 and 2015. Moreover, no such drops happened prior to 2012 or after 2015. Such time-dependent behaviors in figure 3 confirm that significant surface spectral reflectance decrease over the solar farm site was indeed due to the installation of solar panels. Similar time-dependent behaviors can also be observed in the surface reflectances in other MODIS visible and near-IR bands.
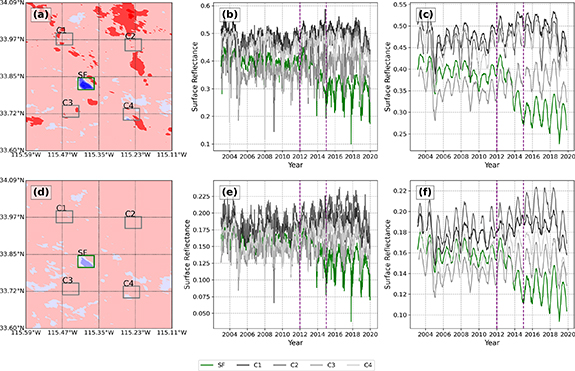
Figure 3. (a, d) The same as the right column in figure 2, showing the difference in surface reflectance between 2018 and 2009 for MODIS Band 7 and Band 3, respectively. C1–C4 denotes four control fields with the same area as the DSSF. (b, e) Raw time series of MODIS surface reflectance at C1–C4 sites (black and gray lines) and the DSSF site (green line). (c, f) The same as the middle column but smoothed with a 13-point (i.e. 104 d) moving average for better visualization of the long-term behavior. Purple vertical dashed lines in the middle and right columns indicate the start and end time of the DSSF construction.
Download figure:
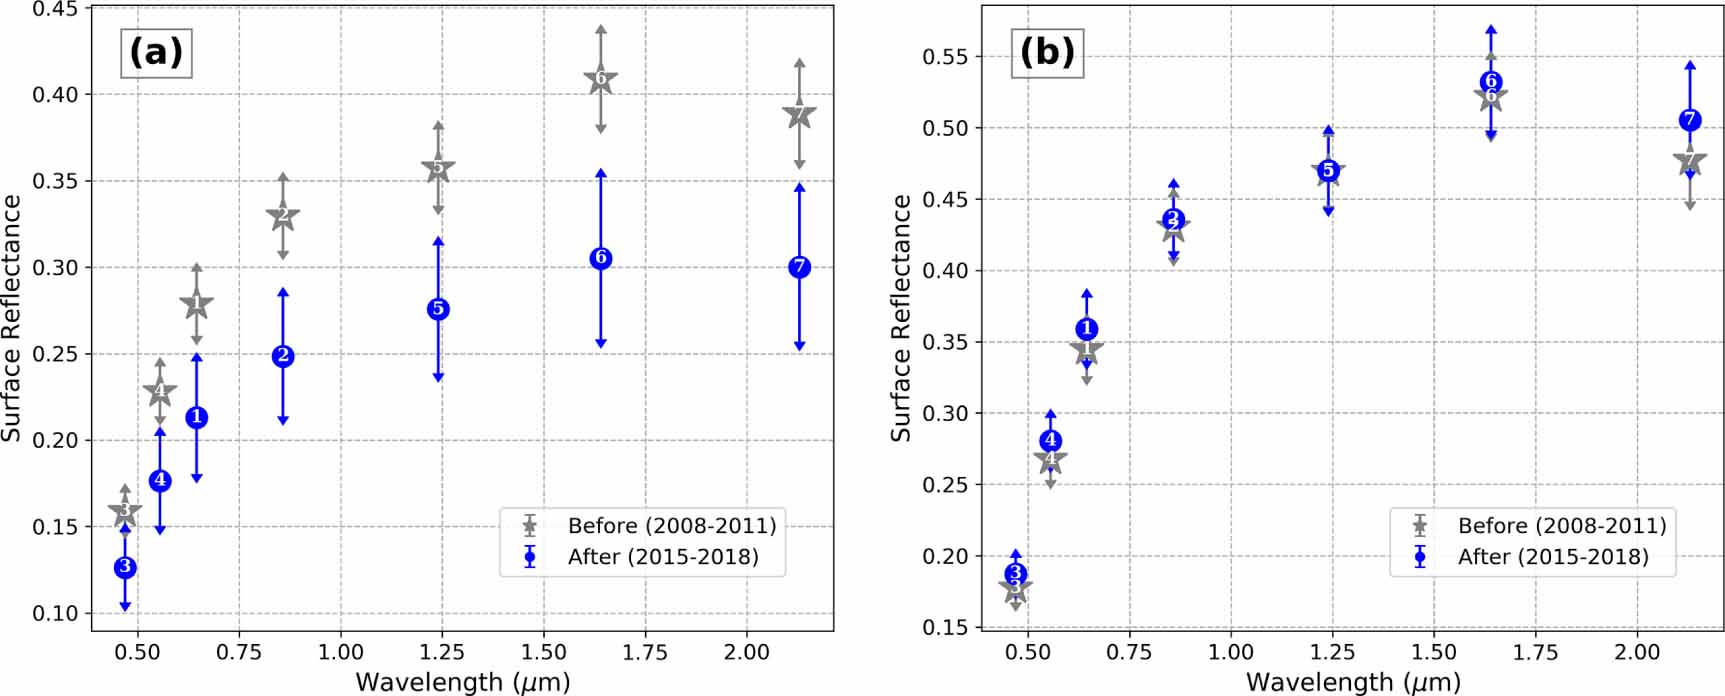
Standard image High-resolution imageThe impact of solar farm commission can be seen in all MODIS visible and near-IR bands that have surface spectral reflectance retrieval products available. Figure 4 shows the 4 year mean surface reflectances before the start of solar farm construction (i.e. 2008–2011) and after its commission (i.e. 2015–2018), for both the solar farm site and a control field site, C1. The statistics are summarized in table S1 (available online at stacks.iop.org/ERL/15/114047/mmedia). Before the solar farm construction, the site has the same surface reflectance as the C1 control site for all seven MODIS bands (gray dots in figure 4). After the commission, there is little change for the surface spectral reflectance at the C1 site but obvious decreases at the solar farm site across all the seven MODIS bands. The relative decrease ranges from −20.5% to −25.4%. Except Band 3, the difference between the two periods is larger than the standard deviation of the 4 year time series (figure 4(a)). Together with the little change over the control sites, it indicates that the reduction of surface reflectance over the solar farm site is not due to weather fluctuation, climate variation, or any other land cover change.

Figure 4. (a) Four year average of surface reflectance at all the seven MODIS bands before the construction (gray star) and after the commission (blue dot) of the DSSF. The vertical arrows correspond to one standard deviation from the average. MODIS band numbers are labeled in each scatter point with respect to their center frequencies. (b) Identical to (a) except for the neighboring control field 1 (DS CTRL 1).
Download figure:
Standard image High-resolution imageThe analyses above clearly establish the changes of surface spectral reflectance due to the DSSF commission. Next subsection will quantify the impact of such changes on the surface and TOA radiation budget.
3.2. Estimated clear-sky surface and TOA shortwave flux change
To estimate the radiative flux changes caused by the observed surface spectral reflectance changes, we use a typical mid-latitude summer profile (Mcclatchey et al 1972) to represent the atmospheric state over the DSSF and specify two sets of surface hemispheric spectral albedo. One set is shown as the red curve in figure S1, which is based on the MODIS retrieved spectral reflectances at the DSSF from 2008 to 2011 with interpolation among each MODIS band. It agrees well with the default barren desert spectral albedo in the MODTRAN5 (gray dots in figure S1). The other set is based on the MODIS retrieved spectral reflectances at the DSSF from 2015 to 2018 (blue curve in figure S1). The atmosphere is assumed to be clear-sky, and a two-stream solver is used for this calculation. The default desert extinction aerosol profiles from MODTRAN5 are used. The broadband shortwave flux here is the integration of spectral flux from 0.2 to 2.5 μm.
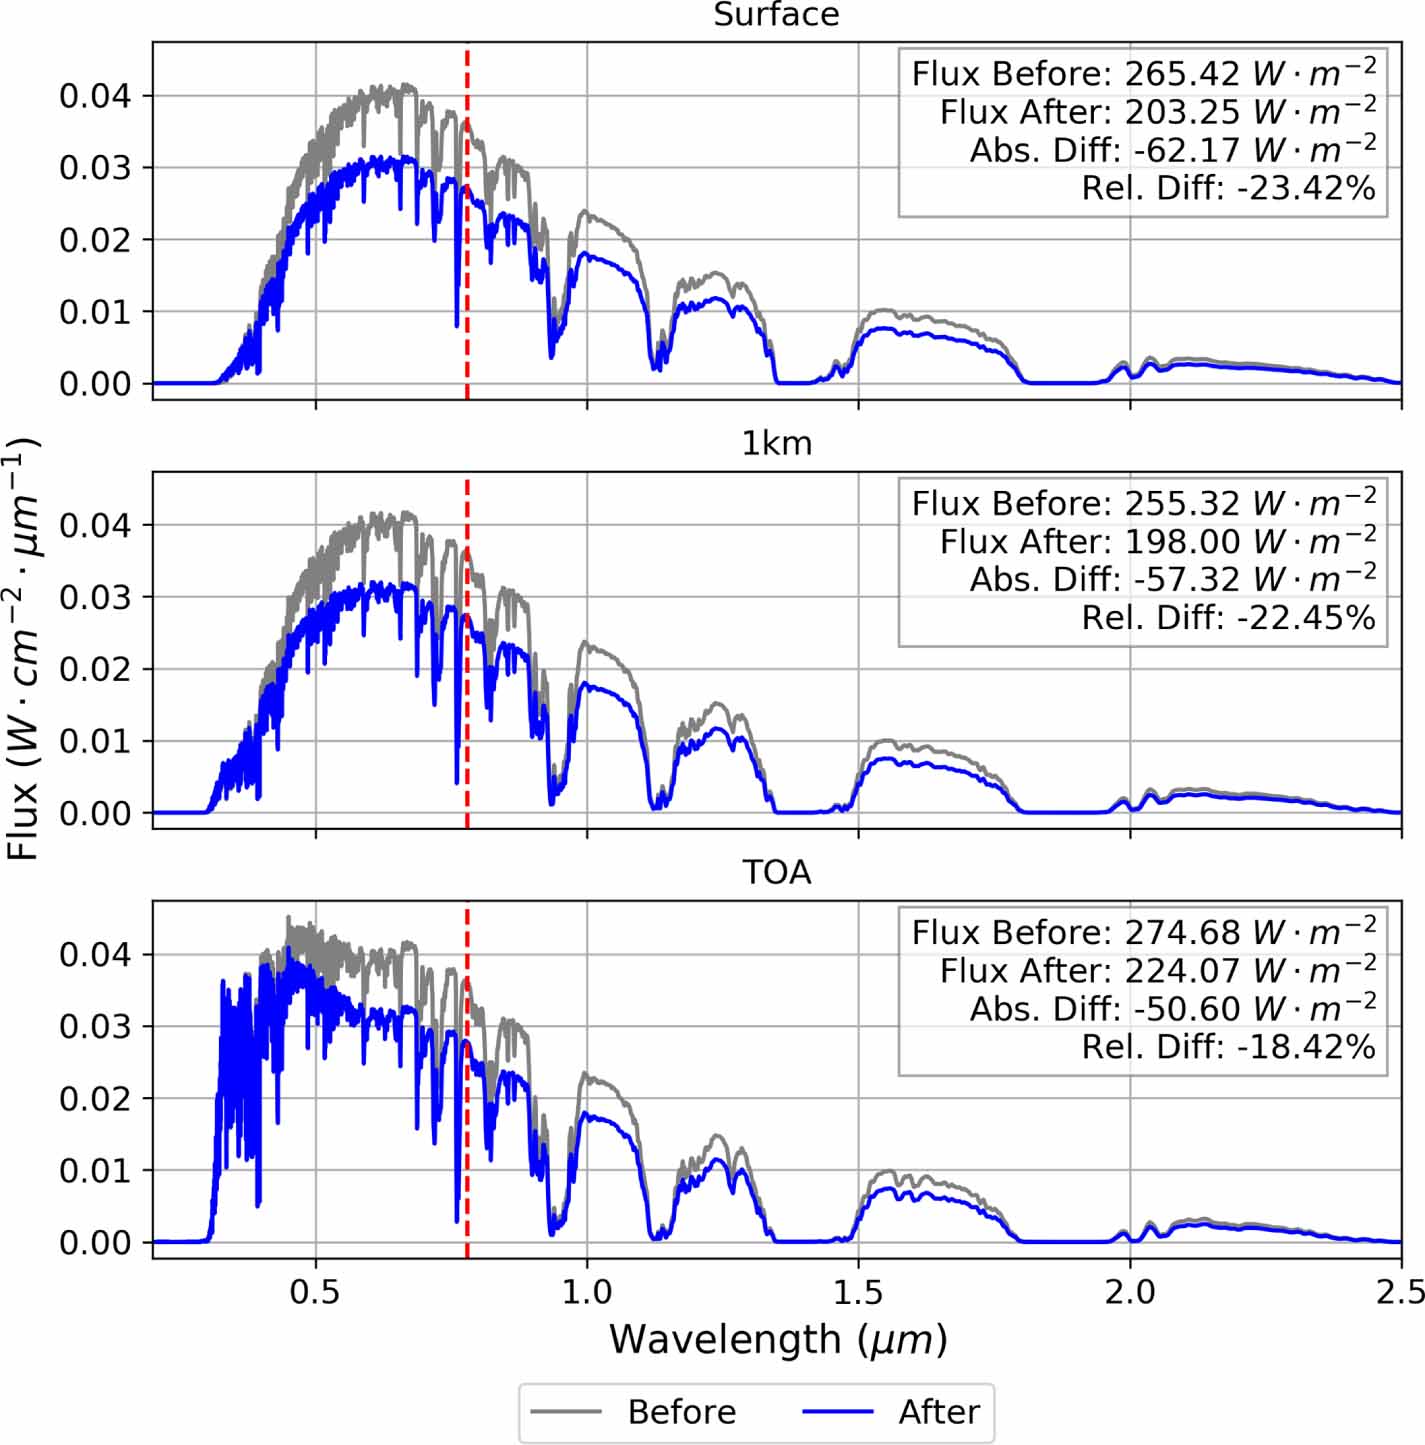
Figure 5 presents the simulated upward spectral fluxes at local noon and at three different vertical levels: the surface, 1 km above the surface, and the TOA, respectively. The spectral reflectance changes caused by the DSSF commission lead to a reduction of the surface upward shortwave flux by 62.2 W m−2( i.e. 23.4% reduction), among which 29.1 W m−2 is from visible and the rest from the near-IR. At the 1 km above the surface and the TOA, the decreases of the upward shortwave flux are 57.32 W m−2( 22.45%) and 50.60 W m−2( 18.42%), respectively, both being smaller than the difference at the surface due to gaseous absorptions and Rayleigh scattering. If the simulation is carried out for sunrise or sunset instead of local noon, the fractional reduction of upward SW flux at the surface is essentially the same (i.e. ∼23.4%). At the TOA, the reduction is ∼14%, which is due to increased atmospheric attenuation as the solar zenith angle decreases. Such clear-sky estimation can be deemed as an upper limit for the all-sky situation, given the cloud masking effect. Nevertheless, a ∼23.4% reduction of the upward shortwave flux at the surface, if scaled to a large region, can definitely influence local surface energy budget and the atmospheric energy flow, and thus can potentially alter local climate.

Figure 5. The simulated upward shortwave spectral flux before the construction (gray line) and after the commission (blue line) at the surface (top panel), 1 km above the surface (middle panel), and the top of atmosphere (bottom panel), respectively. Vertical red line denotes the boundary between the visible and near-IR. The broadband fluxes and their differences are shown on the panels as well. The simulation assumes solar geometry at local noon in the summertime. The spectral resolution is set to be 10 cm−1 in the calculation.
Download figure:
Standard image High-resolution image4. Observed surface reflectance changes for all six solar farm sites
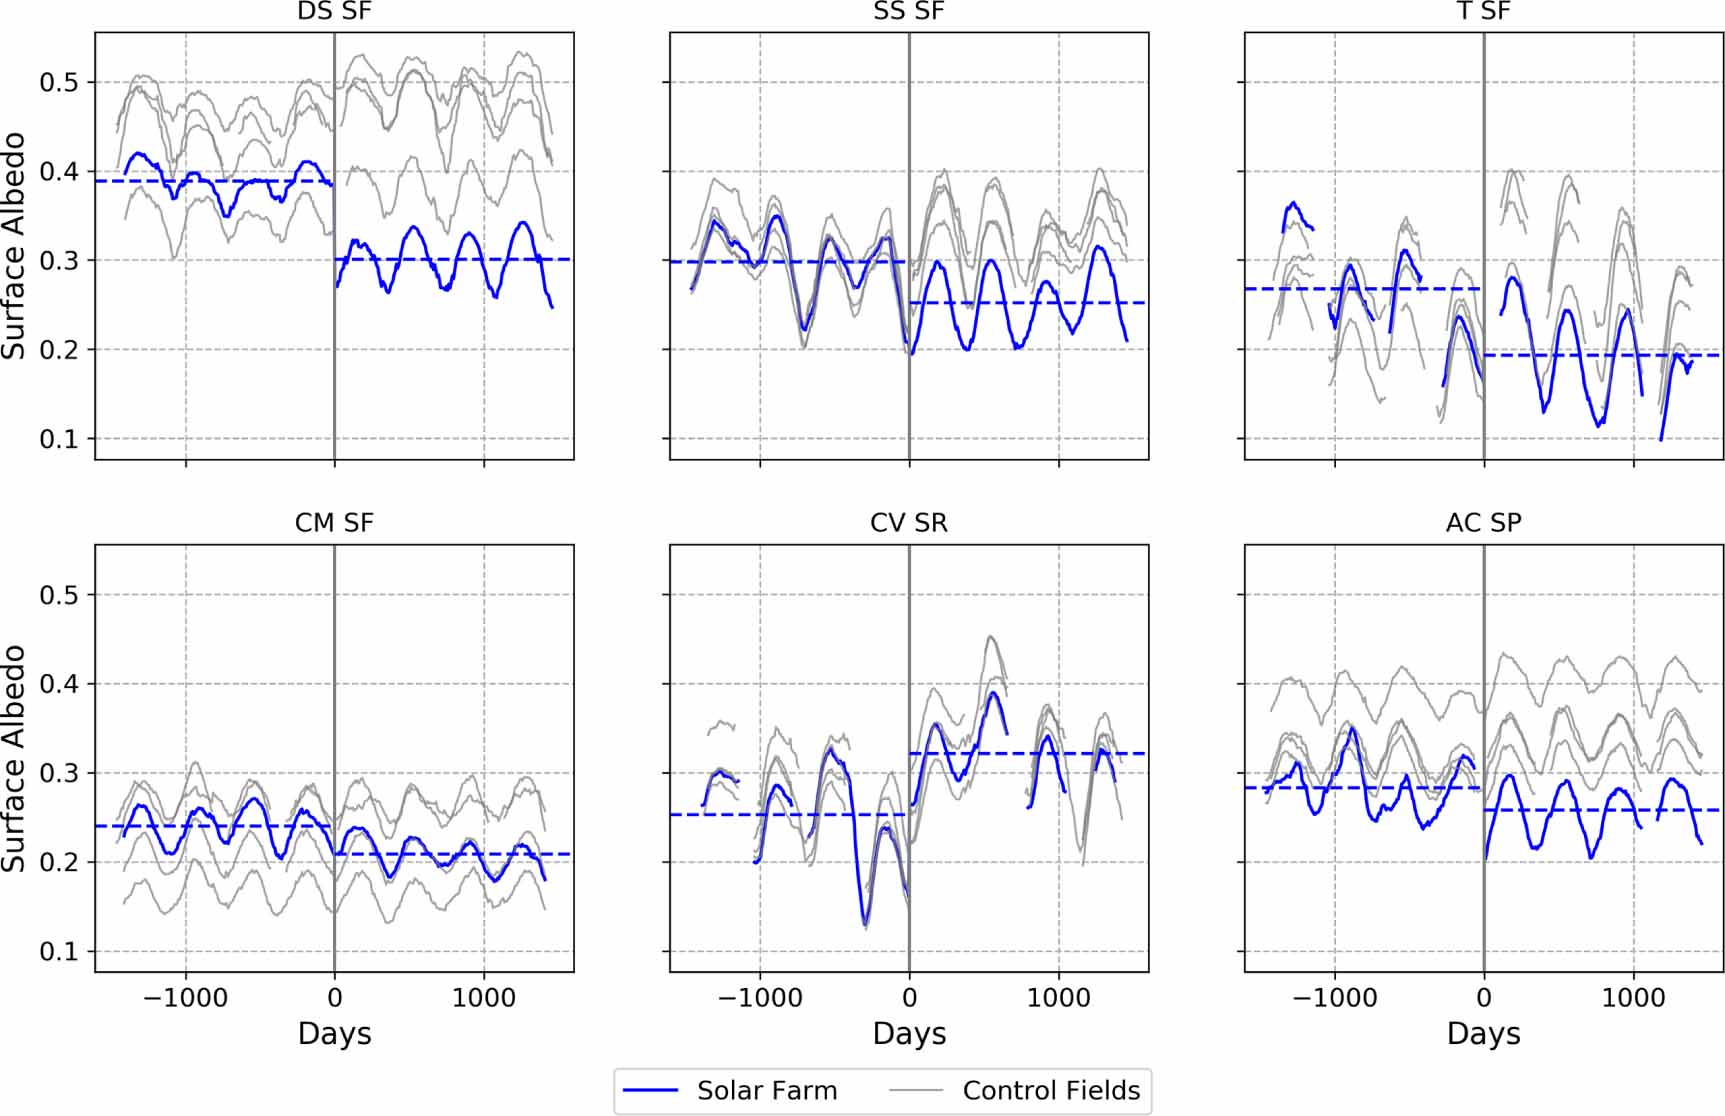
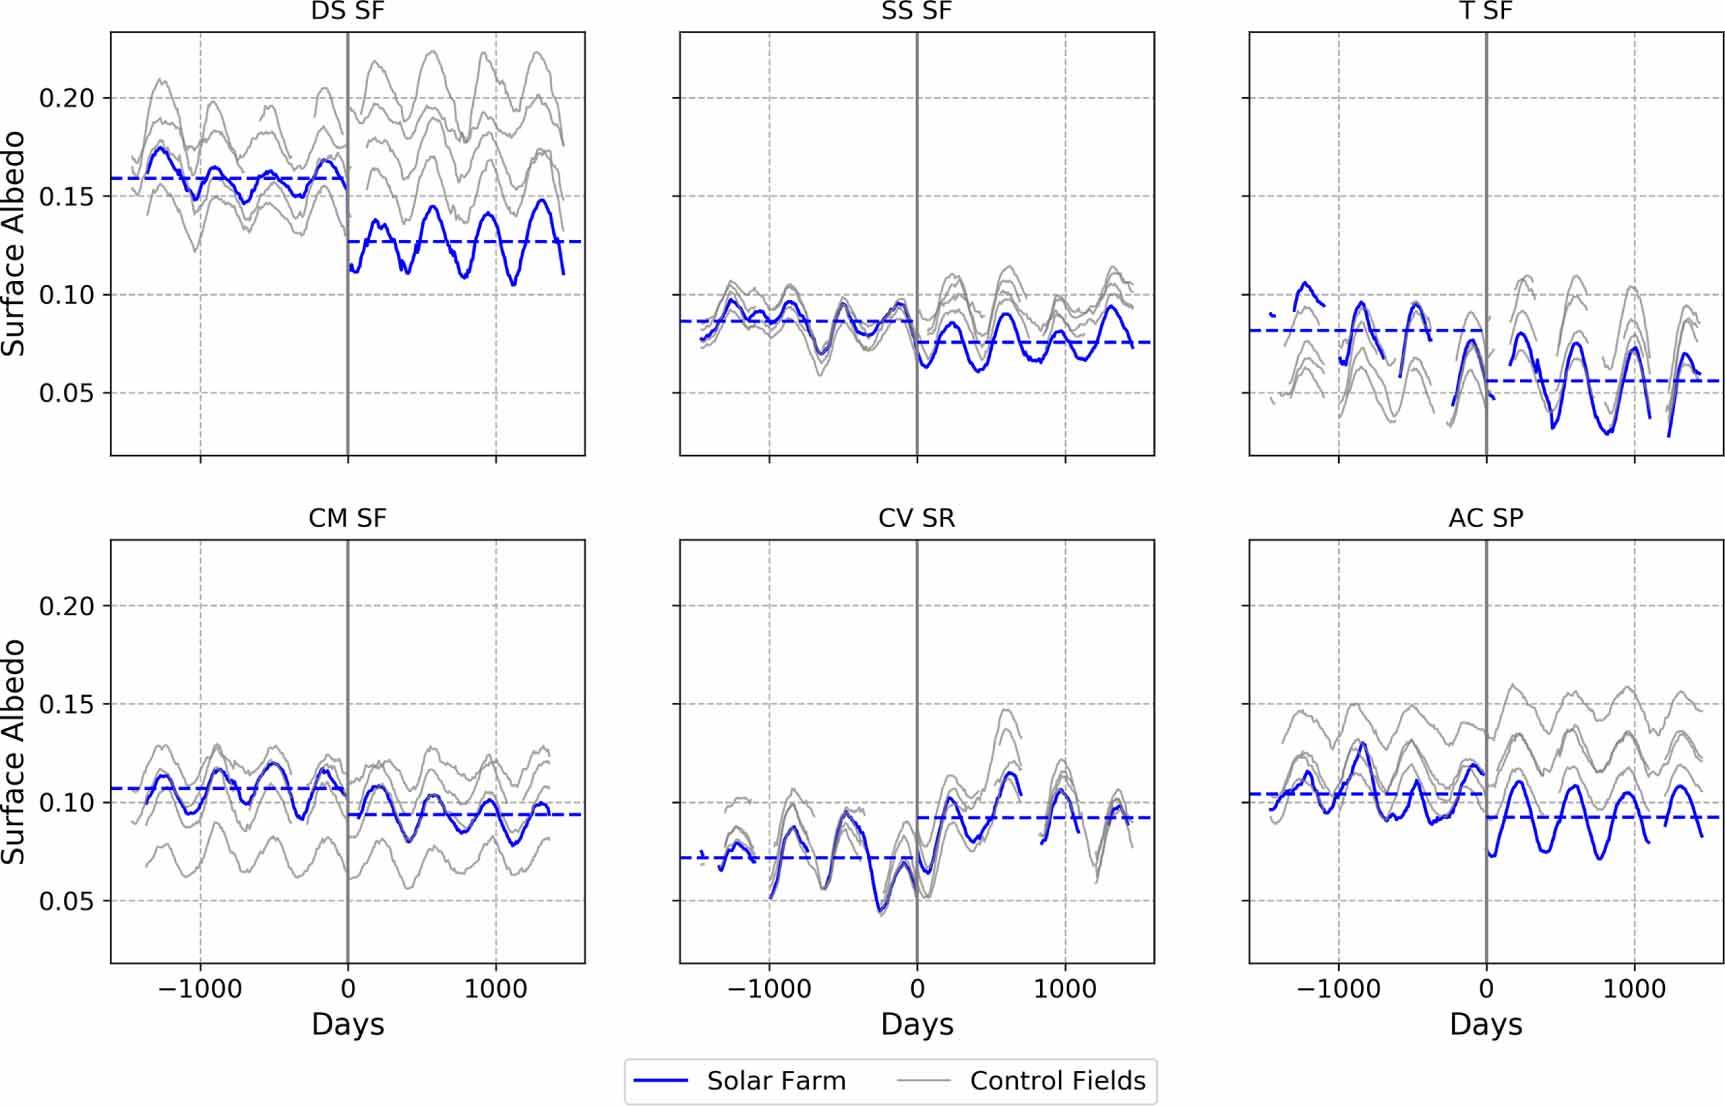
The analysis described in section 3 was then applied to all six solar-farm sites listed in table 1. Figures 6 and 7 show the composite time series of retrieved surface reflectance at Band 7 (a near-IR band) and Band 3 (the blue band), respectively. Each panel has the time series of one solar-farm site in blue and the counterparts of four neighboring control sites in light gray. Days before the start of construction are shown as negative days and days after the commission are shown as positive days. The Band 3 surface reflectance varies from 0.1 to 0.15 among the six sites before the construction. The variation is from 0.2 to 0.4 for the Band 7 surface reflectance. The seasonal cycle is clearly identifiable from all time series. By contrasting the time series of solar farms with those of their neighboring control sites, it can be seen that:
- 1)The decreases of surface spectral reflectances after the commission, such as at DSSF (described already in section 3), Topaz Solar Farm (TSF), Solar Star (SSSF) and Agua Caliente Solar Project (ACSP), are well separated from the time series of neighboring control sites. Such separation can be recognized from both the Band 3 and Band 7 time series.
- 2)The decrease of surface spectral reflectances at the Copper Mountain Solar Facility (CMSF) is notable but not well separated from the time series of neighboring control sites (no decrease seen in such time series of control sites).
- 3)The surface spectral reflectances at the California Valley Solar Ranch (CVSR) show an increase instead of a decrease after the solar farm commission. However, the time series of neighboring control sites all showed similar increases as well. Note that this behavior at the CVSR is different from all the rest sites, where the time series of the solar farm and the control fields clearly divert from each other after the commission.
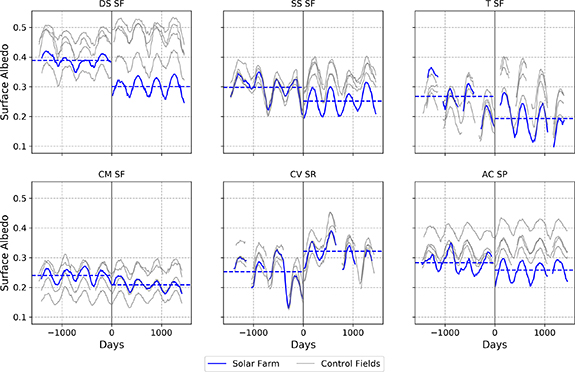
Figure 6. Composite time series of MODIS retrieved Band 7 surface reflectance for all six solar-farm sites. Negative value on the abscissa denotes the number of days before the start time of construction and positive value denotes the number of days after the commission. Solid blue line in each panel is the time series of the solar farm, of which the acronym is labeled as the title of each panel, and the light gray lines are the time series of four neighboring control sites. Dashed blue lines in each panel are the mean surface reflectance before the construction and after the commission.
Download figure:
Standard image High-resolution image
Figure 7. The same as figure 6, but for MODIS Band 3.
Download figure:
Standard image High-resolution imageBoth the aerosol optical thickness (AOT) and total column water vapor can affect the atmosphere correction used in the surface reflectance retrieval algorithm; we examined their multiple-year average and statistics (table 2), as well as daily time series (figure S2). Notably, the CVSR, a solar farm close to densely populated Santa Babara, California, has a larger mean AOT than the rest sites for both the before-construction and after-commission eras. The standard deviation of its daily time series is also the largest among all time series. Such relatively large AOT and its fluctuation can be a challenge for the atmosphere correction. Thus, it is likely that aerosol contamination has affected the surface reflectance retrievals over a broad region encompassing the CVSR solar farm site and its adjacent control fields, which masked out the land-cover change due to the solar panel installation and led to similar spectral reflectance changes over the CVSR solar farm site and the control sites as shown in figures 6 and 7. Such reflectance changes over the CVSR solar farm and the adjacent control sites could also be affected by surface background reflectance change over the broad region. Other observations besides the MODIS retrievals are needed to further quantify the causes for the CVSR case, which is beyond the scope of this study.
Table 2. Statistics of MODIS retrieved aerosol optical thickness (AOT) and water vapor column concentration at the six solar-farm sites. Both mean and standard deviation (stddev) are computed from four years of daily time series. The MODIS retrievals are from the MYD09CMA product. Data are sorted, in descending order, with respect to the mean value of AOT (or water vapor column concentration) before the construction.
| Solar Farm | Before Construction | After Commission | ||
|---|---|---|---|---|
| Mean | Stddev | Mean | Stddev | |
| Aerosol optical thickness (AOT) | ||||
| CVSR | 0.103 | 0.068 | 0.144 | 0.053 |
| SSSF | 0.091 | 0.046 | 0.096 | 0.041 |
| TSF | 0.087 | 0.047 | 0.104 | 0.034 |
| DSSF | 0.082 | 0.023 | 0.104 | 0.023 |
| ACSP | 0.077 | 0.030 | 0.112 | 0.035 |
| CMSF | 0.061 | 0.024 | 0.093 | 0.034 |
| Water vapor column concentration (g cm−2) | ||||
| ACSP | 1.680 | 0.942 | 1.711 | 0.905 |
| DSSF | 1.418 | 0.675 | 1.512 | 0.743 |
| TSF | 1.192 | 0.411 | 1.236 | 0.433 |
| CVSR | 1.182 | 0.391 | 1.224 | 0.397 |
| CMSF | 1.100 | 0.462 | 1.155 | 0.469 |
| SSSF | 1.033 | 0.360 | 1.089 | 0.381 |
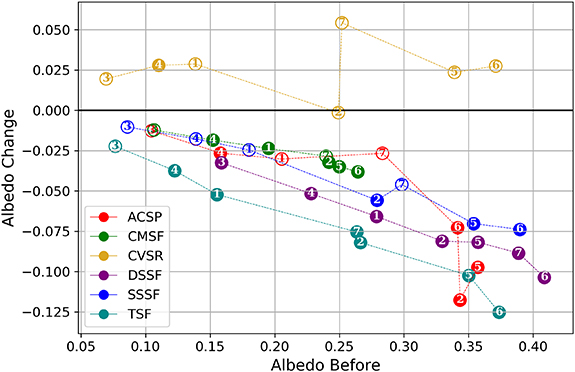
Figure 8 presents an overall summary of the surface reflectance changes at all MODIS bands analyzed here and for all the six solar-farm sites. Consistent with the discussion of figures 6 and 7, the retrieved surface reflectance change in the CVSR site is non-negative for all the seven MODIS bands, but such changes are indistinguishable from the counterparts derived from neighboring control sites (not shown). Such consistent behavior across all the bands further suggests that the retrieval artifact due to aerosol contamination could be an explanation for the CVSR results. Thus, the CVSR results are excluded in the following discussion.
Figure 8. A summary of surface-reflectance changes for all seven MODIS bands over six solar farm sites. The abscissa is the 4 years mean surface reflectance before the solar farm was built, and the ordinate is the 4 years mean surface reflectance difference after the commission and before the construction. Circled numbers indicate the MODIS band number and different color denotes different solar-farm site as labeled on the plot. Filled circles denote statistically significant differences (5% significance) as decided by the student's t-test. As shown in figure 4, Bands 1, 3, 4 are visible bands, and Bands 2, 5, 6, 7 are near-IR bands.
Download figure:
Standard image High-resolution image
The surface spectral reflectance changes are negative for all the rest five solar farm sites, as shown in figure 8. The larger the surface spectral reflectance before the construction is, the larger the decrease of the surface reflectance tends to be. Table S2 summarizes the statistics of the changes across the five sites, which shows that the near-IR bands (i.e. bands 2, 5–7) usually have larger surface reflectances than the visible bands (i.e. bands 1, 3–4) for all the sites. Consistently, figure 8 shows that the surface reflectance reduction in the near-IR bands is usually larger than those in the visible bands. Except three differences (Band 7 at ACSP and CMSF and SSSF), all the rest 17 near-IR differences are statistically significant. The smallest surface reflectance is usually seen at Band 3 (except the DSSF site, all less than 0.11). As a result, the corresponding surface reflectance decrease is also small and statistically insignificant. For the Band 1 and Band 4, the rest two visible bands, most sites exhibit statistically significant surface reflectance changes.
While there is certainly a spatial variation of the surface reflectance in all the bands, as shown in figure 8, our analysis shows that the decreases of surface spectral reflectances due to the solar farm commissions can indeed be consistently observed from space, over multiple solar-farm sites and at all the visible and near-IR MODIS bands. As shown in the case of the CVSR, the quality of surface reflectance retrieval can sometimes mask out the changes caused by solar panel installation.
5. Conclusions and discussion
By analyzing MODIS retrieved surface reflectances over the six solar-farm sites as well as their neighboring control sites, we show that the changes due to solar panel installation can be detected in surface spectral reflectances at the MODIS Bands 1–7. The case study with the DSSF site shows a 20%–25% reduction of surface reflectances at the seven MODIS bands. Radiative transfer calculation suggests that such a reduction of surface reflectance can lead to a ∼23% decrease in surface upward shortwave flux and a ∼14%–18% decrease in TOA clear-sky reflected shortwave flux. Such amount of decrease in surface upward shortwave flux can definitely alter the local surface energy budget. While aerosol and other factors can affect the quality of surface spectral reflectance retrievals, five out of the six sites examined here clearly show a decrease in surface spectral reflectance due to the solar farm construction and operation, especially over the MODIS near-IR bands. In general, the larger the original surface spectral reflectance is, the more the surface reflectance decrease tends to be.
If the surface spectral reflectance at the DSSF site is used as a threshold, globally there are several regions with the surface spectral reflectance consistently above such a threshold. As shown in figure S3, bright desert regions such as the vast majority of Sahara, Arabian Peninsula, and limited areas in Gobi desert and central Australia have the surface spectral reflectance above the threshold for both MODIS Band 1 (the red band) and Band 2 (a near-IR band), with an averaged Band 2 reflectance ∼0.42. Note that the Band 2 spectral reflectance over other surface types, as shown in figure S3, is comparable to that of the DSSF solar farm, which is ∼0.25. The Band 1 reflectance over other surfaces is comparable or less than that of the DSSF solar farm, which is 0.21. Based on the CERES-EBAF (Energy Balance and Filled) climatology (Loeb et al 2018, Kato et al 2018), the long-term averaged all-sky and clear-sky surface upward shortwave fluxes over the bright deserts are 61.4 and 67.8 W m−2, respectively. The TOA reflected all-sky and clear-sky shortwave fluxes are 119.4 and 92.0 W m−2, respectively. Similar to our analysis above, the averaged spectral reflectance over these bright deserts at each MODIS band can be derived, which is shown as the yellow line in figure S1. It closely tracks the default spectral reflectance of the barren desert in the MODTRAN5 and is higher than the DSSF background surface reflectance over all the bands. For the MODIS Bands 6 and 7 (wavelength > 1.5 μm), the retrieval data quality over the bright deserts is not consistently high so we simply use the default surface reflectance of barren desert in the MODTRAN5. If all the areas were covered by the solar panels used in the DSSF site, assuming the same reflectance as DSSF (i.e. the blue line in figure S1), we can perform a MODTRAN calculation similar to what has been done for figure 5. The results are shown in figure S4. Based on this estimation, the reduction of surface upward shortwave flux would be ∼36.19%, i.e. 22.2 W m−2 for all sky and 24.5 W m−2 for the clear sky. The reduction of TOA clear-sky reflected SW flux would be ∼23%, i.e. 21.6 W m−2. Given the masking effect of cloud for the surface reflection, the reduction of TOA all-sky reflected shortwave flux would be less than 23% of 119.4 W m−2, i.e. 27.5 W m−2. The bright desert regions occupy 4% of the global surface; therefore, the estimated global mean TOA shortwave flux change due to such large-scale deployment of solar panels would be 1.1 W m−2 or less, comparable to the radiative forcings by many anthropogenic factors such as greenhouse gas emissions, aerosols and their precursors (Myhre et al 2013).
However, according to the Key World Energy Statistics report by International Energy Agency (IEA 2019), the total electricity generation was 25 606 TWh in 2017. If the DSSF surface area and power generation listed in table 1 are used to estimate the power generation efficiency of solar panels, an area of 0.31 million km2( i.e. about 1.5% of the total bright desert areas mentioned above) covered by solar panels can already produce the same amount of electricity as generated in 2017. This implies that the shortwave radiative forcing due to solar farm deployments, even for replacing all the existing power generation, will be no more than ∼0.017 W m−2. Thus, while solar farms can alter the local energy budget by changing the amount of shortwave radiation absorbed by the surface, they have little direct impact on global radiation budget.
As satellite measurements are widely used to monitor the climate and its changes, here we elucidate the monitoring capability of MODIS for one specific land use, i.e. solar panel deployment, and estimate the related shortwave flux changes due to solar farm commissions. Given the global coverage of MODIS observations, similar assessments can be done for solar farms commissioned in other countries. MODIS has been operating in space since 2000. Its successors, VIIRS on Suomi-NPP, JPSS1, and future JPSS satellites can provide similar coverages in the visible and near-IR as MODIS does. Thus, such monitoring capability can be continued for the incoming decade, a period that more solar farm constructions are expected. In addition to surface spectral reflectance, it is also possible to deduce the changes in surface skin temperature and surface longwave spectral emissivity from such observations, which can further depict the impact of solar farms on local surface energy budget from a satellite and global perspective.
Acknowledgments
We want to thank two anonymous reviewers for thoughtful suggestions and comments. The MODIS/Aqua Surface Reflectance 8 d L3 Global 500 m (MYD09A1), Surface Reflectance Daily L3 Global 0.05 Deg CMG (MYD09CMG), and Aerosol Optical Thickness Daily L3 Global 0.05 Deg CMA (MYD09CMA) datasets were acquired from the Level-1 and Atmosphere Archive & Distribution System (LAADS) Distributed Active Archive Center (DAAC), located in the Goddard Space Flight Center in Greenbelt, Maryland (https://ladsweb.nascom.nasa.gov/). The CERES EBAF Edition4 products can be retrieved from the CERES project website (https://ceres.larc.nasa.gov/data/). CXF's effort is supported by a fellowship from the University of Michigan and XLH's effort is supported by NASA Grant No. 80NSSC18K1033 awarded to the University of Michigan.
Data availability statement
The data that support the findings of this study are available upon reasonable request from the authors.