

Abstract
Forest fragmentation is ubiquitous across urban and rural areas. While there is mounting evidence that forest fragmentation alters the terrestrial carbon cycle, the extent to which differences in ambient growing conditions between urban and rural landscapes mediate forest response to fragmentation and climate remains unexamined. This study integrates field measurements of forest structure, growth, and soil respiration with climate data and high-resolution land-cover maps to quantify forest carbon storage and sequestration patterns along edge-to-interior gradients. These data were used to contrast the response of temperate broadleaf forests to non-forest edges within rural and urban landscapes. We find that forest growth rates in both rural and urban landscapes nearly double from the forest interior to edge. Additionally, these edge-induced enhancements in forest growth are not offset by concurrent increases in total soil respiration observed across our sites. Forest productivity generally increases near edges because of increases in leaf area, but elevated air temperature at the edge tempers this response and imparts greater sensitivity of forest growth to heat. In particular, the adverse impacts of heat on forest growth are two to three times larger in urban than rural landscapes. We demonstrate that the highly fragmented nature of urban forests compared to rural forests makes them a stronger carbon sink per unit area, but also much more vulnerable to a warming climate. Collectively, our results highlight the need to include the effects of both urbanization and fragmentation when quantifying regional carbon balance and its response to a changing climate.
Export citation and abstract BibTeX RIS

Original content from this work may be used under the terms of the Creative Commons Attribution 4.0 license. Any further distribution of this work must maintain attribution to the author(s) and the title of the work, journal citation and DOI.
1. Introduction:
Forest ecosystems are the primary driver of the global terrestrial carbon (C) sink (Pan et al 2011), which offsets approximately one-third of anthropogenic carbon dioxide (CO2) emissions to the atmosphere each year (Le Quéré et al 2018). However, the strength of the forest C sink varies considerably from year-to-year, is the least certain component of the global C cycle, and is likely a main contributor to imbalances in the global C budget (Pan et al 2011, Le Quéré et al 2018). Land-cover change and climate are the primary controls over the magnitude and direction of terrestrial C fluxes (Schimel et al 2001, Schimel 2007). In particular, fragmentation—defined here as landscapes with forest patches interspersed by non-forest land covers—influences a large and growing proportion of the world's remaining forests (Haddad et al 2015). There is a mounting body of literature showing that patterns of C cycling within forests adjacent to non-forest edges are substantively different than within forest interiors (Laurance 1997, Chaplin-Kramer et al 2015, Remy et al 2016a, Reinmann and Hutyra 2017, Schmidt et al 2017, Smith et al 2018, 2019b, Wekesa et al 2019, Ordway and Asner 2020). Urbanization is also a major driver of land-cover change in many regions of the world and imposes its own suite of changes in environmental conditions that alter C cycling (Diem et al 2006, Awal et al 2010). A growing number of governments and municipalities are aiming to reduce net C emissions, creating an urgent need to accurately quantify the C balance and its response to changes in land cover and climate at scales necessary to develop, implement, and monitor the policies needed to attain these goals. Most regions targeted by these policies contain admixtures of intact and fragmented forests spread across a continuum of urban to rural landscapes. Currently, a major limitation to our capacity to quantify C balance across these heterogeneous regions is a lack of understanding of the separate and interactive effects that fragmentation and urbanization have on forest C cycling.
Globally, northern latitude forests (> 30°N) likely constitute the largest terrestrial net C sink (Schimel et al 2001, Goodale et al 2002, Pan et al 2011). A long history of land clearing for agriculture and urban expansion, as well as large-scale but discontinuous reforestation, have resulted in temperate forests being the most heavily fragmented and urbanized forest biome in the world, with fragmentation being ubiquitous in both rural and urban landscapes (Haddad et al 2015, Smith et al 2018). The temperate region is also experiencing the most rapid decline in the proportion of interior habitat of any forest biome (Riitters et al 2016) and urbanization is expected to continue being a major driver of land-cover change across many countries including the U.S. (Seto et al 2012, Lawler et al 2014, Homer et al 2015, Reinmann et al 2016). For example, between 2000 and 2050 urban extent in the U.S. is expected to double, surrounding nearly 120 000 km2 of currently non-urban adjacent forestland in the process (Nowak and Walton 2005).
Forest edges tend to be hotter, windier, and drier than the forest interior, but also experience greater light and nutrient availability (Laurance et al 1998, Remy et al 2016a, Schmidt et al 2017). The net effect of these differences in growing conditions on forest C cycling appears to be determined by a combination of prevailing meteorological limitations to forest growth (e.g. light, temperature) (Nemani et al 2003, Smith et al 2018) and forest structural characteristics (e.g. leaf area, tree height) (Ordway and Asner 2020). In tropical forests, fragmentation-driven shifts in microenvironment detrimentally increase water stress, facilitate the proliferation of lianas, increase vulnerability to blowdown, and alter canopy structure and foliar characteristics with the net effect of reducing forest biomass within 100 m of a forest edge (Laurance 1997, Laurance et al 2000, Laurance and Williamson 2001, Chaplin-Kramer et al 2015, Brinck et al 2017, Ordway and Asner 2020). Similarly, greater rates of windthrow cause biomass declines in boreal forest fragments (Jönsson et al 2007). By contrast, the creation of forest edges results in greater aboveground biomass and tree growth in temperate deciduous forests, in part because rates of tree mortality are not increased (Herbst et al 2007, Lhotka and Stringer 2013, Briber et al 2015, Reinmann and Hutyra 2017).
Urbanization imposes a unique suite of amendments to forest growing conditions (e.g. urban heat island, and elevated nitrogen deposition, CO2 concentrations and pollution exposure) that, compared to rural conditions, can result in faster tree growth (Gregg et al 2003, Zhang et al 2014, Briber et al 2015, Sonti et al 2019, Smith et al 2019a), but also lead to higher rates of mortality (Smith et al 2019a). These shifts in growing conditions likely enhance and/or exacerbate the changes imposed by the creation of forest edges. Although environmental conditions play an important role in mediating forest response to edge effects (Smith et al 2018) and a changing climate, the extent to which innate differences in growing conditions between urban and rural landscapes attenuate this response is unknown.
Reinmann and Hutyra (2017) documented the presence of enhanced forest biomass and growth near forest edges in Greater Boston in Massachusetts, U.S.A, but also higher sensitivity of forest growth to above average heat near edges. Here, we build on this previous work to provide insight into the mechanisms underlying forest edge growth enhancements and the role of landscape context (i.e. urban vs. rural) in mediating forest C cycle response to the presence of edges. We integrate data from urban landscapes (previously reported in Reinmann and Hutyra 2017) and rural landscapes to quantify temperate forest growth, biomass, and climate sensitivity responses to the separate and interactive effects of fragmentation and urbanization. We leverage field measurements from forest edge-to-interior transects, climate data, and high-resolution land-cover maps. We focus on Massachusetts, U.S.A. because it is one of the most heavily urbanized states in the U.S. (Nowak and Walton 2005), but also contains considerable extents of rural areas and is broadly representative of the landscape characteristics of the Northeast Corridor—the most densely populated region of the country.
2. Materials and methods
2.1. Site description
The rural components of this study were conducted at the Harvard Forest and nearby properties in central Massachusetts, USA (42° 30' N, 72° 10' W, 330 m above sea level) in mixed-hardwood forests (figure 1). This region was generally pasture until about the year 1900, after which the forest regenerated naturally until a stand-replacing hurricane in 1938. The current forest is the product of natural regeneration and trees that survived the 1938 hurricane. Soils are well-drained and developed on glacial till deposits and are predominantly mapped as Montauk, Whitman, and Woodbridge series defined by their generally coarse loamy texture with little clay content (Natural Resources Conservation Service, https://websoilsurvey.sc.egov.usda.gov, accessed in 2020). The climate is cool temperate and humid with mean temperatures of 20 °C in July and −7 °C in January. Mean annual precipitation is 1100 mm, distributed evenly throughout the year. For a description of our urban sites in Greater Boston see supplemental notes (available online at https://stacks.iop.org/ERL/15/114036/mmedia) and Reinmann and Hutyra (2017).
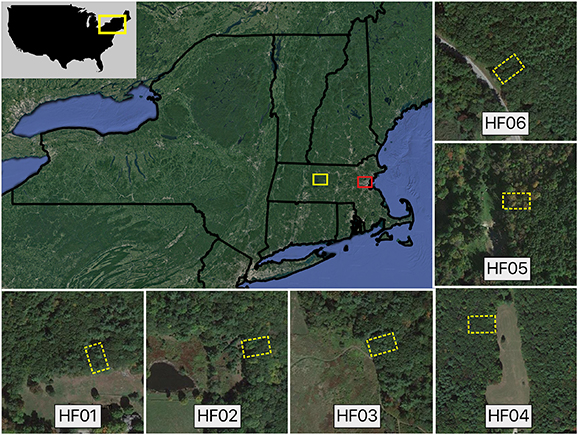
Figure 1. Rural and Urban Forest study areas (white and red boxes, respectively, in top left panel). Each of the six insets depicts the approximate location of each 20 m × 30 m Rural study plot (yellow dashed boxes). See Reinmann and Hutyra (2017) for aerial image of Urban plots.
Download figure:
Standard image High-resolution image2.2. Experimental design
We established six 'rural' plots in May 2016 and each plot was 20 m wide along the forest's edge and extended 30 m into the forest interior, which is analogous to the design used for the eight 'urban' plots located in Greater Boston (see Reinmann and Hutyra 2017). Earlier work has demonstrated that edge effects on microenvironment (Matlack 1993), forest biomass and productivity (Reinmann and Hutyra 2017), and soil respiration (Smith et al 2019b) largely dissipate within 20 m of the forest edge in temperate mixed-hardwood forests. We, therefore, assumed that the 20 m to 30 m section of each our plots is representative of the forest's interior. The rural forest fragments used here likely regenerated with the forest edges in their current location. The solar aspects of the urban and rural plots collectively span all four cardinal directions and adjacent land covers include residential development, roads, and pastures/meadows (supplemental table 1 and figure 1).
In each rural plot, we characterized gradients in microenvironmental conditions between the forest edge and interior. Soil temperature and soil moisture (i.e. volumetric water content) data were logged every 30 min using soil temperature sensors (10 cm soil depth; Onset HOBO Pendant Datalogger) and soil moisture time domain reflectometers (integrated over 0 cm to 10 cm soil depth; Onset Soil Moisture Smart Sensor). Air temperature and relative humidity were logged every 15 min at a height of 2 m above the forest floor using air temperature/relative humidity sensors in radiation shields (Onset HOBO U23-001). All sensors were deployed by late-June in 2016 and were located every 10 m along a transect through the center of each plot (i.e. 0, 10, 20, 30 m from the forest edge). Light absorbance by the forest canopy was quantified using hemispherical photos collected at each node of a 5 m grid in each plot from 5 m to 30 m from the forest edge (n = 30 images per plot). Images were processed using the Gap Light Analyzer software (version 2.0; see Supplemental Note for details) (Frazer et al 1999).
Oaks (Quercus spp.) comprised a plurality of forest basal area (BA) in both the urban and rural sites contrasted in this study (see supplemental note and Reinmann and Hutyra 2017). Satellite imagery and land-use/land-cover records indicate that all of the plots have mature forest edges that have existed for at least 40 years among the urban plots and at least 80 years among the rural plots.
2.3. Forest mensuration
The field measurement methodology described here for our rural plots is analogous to the approach used for our urban plots (see Reinmann and Hutyra 2017). During the 2016 growing season, within each rural plot the diameter at breast height (DBH) and species were recorded for every living tree and snag (when possible) larger than 5 cm DBH, and the location of each tree/snag was mapped using a coordinate system. The BA of each tree was calculated from:
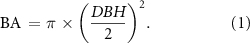
To quantify rates of tree growth, we collected two 5 mm tree cores (90° apart from one another) from each tree larger than 10 cm DBH in each plot. In total, 494 cores were collected (n = 2 cores per tree × 247 trees) from our rural plots. Cores were processed and crossdated using standard practices (see supplemental note). To control for tree size effects on ring widths and to quantify rates of radial wood production for each tree, we converted raw ring width measurements to basal area increment (BAI) from:

where Rn is the radius of the tree at the end of year n and Rn-1 is the radius of the tree at the end of the previous year.
Standing aboveground biomass and rates of aboveground biomass accumulation were quantified for each forest segment in each plot using a generalized allometric equation for 'Hard maple/oak/hickory/beech' forests from Jenkins et al( 2003). Aboveground biomass was quantified for each tree in each plot and forest biomass in each plot was calculated by summing biomass across individual trees for each forest segment. It is likely that allometries produce a conservative estimate of aboveground biomass near the forest edge because the greater light availability can alter canopy architecture (e.g. large, lateral branches) (Mourelle et al 2001) in ways that increase biomass. Aboveground biomass accumulation was quantified as aboveground woody increment (AGWI) from:

where AGBn is the aboveground biomass in year n( calculated using the allometric equation and DBH in year n) and AGBn-1 is the aboveground biomass in the previous year. To convert biomass to carbon, we assumed that 50% of biomass is carbon following findings from other temperate deciduous forests in the northeastern U.S. (Fahey et al 2005). Here, we focus on aboveground biomass. While belowground biomass in forests of the northeastern U.S. has been found to be equivalent to 26.4% of aboveground biomass (Fahey et al 2005), we do not believe this biases our accounting of forest interior-to-edge gradients in biomass C dynamics. Previous work in this forest type indicates no significant changes in belowground biomass between the forest edge and interior (Reinmann and Hutyra 2017).
Tree variables and canopy light transmittance data were binned into forest segments 0–10 m, 10–20 m, and 20–30 m from the forest edge to quantify the influence of edges on forest-scale (i.e. not tree-scale) variables. Forest BA, BAI, and AGWI were calculated by summing these tree-level variables for each forest segment, and forest canopy light transmittance was calculated as the mean light transmittance across the five images collected at each of the six distances between the forest edge and interior.
2.4. Climate data
Previous work from nearby (i.e. ∼ 100 km) urban forest fragments in Greater Boston, Massachusetts indicates that forest growth is negatively correlated to heat stress, defined as the number of days in June and July with high temperatures in excess of 27 °C (Reinmann and Hutyra 2017). We conducted the same analyses for our rural sites using Harvard Forest meteorological records (obtained from https://harvardforest.fas.harvard.edu) for the period 1990–2014 (i.e. same period used in Reinmann and Hutyra 2017).
2.5. Land cover analyses
Estimates of landscape scale forest edge area are based on a one-meter resolution thematic land-cover dataset that was created using multispectral imagery collected in 2016 for the USDA's National Agricultural Imagery Program then classified by NOAA's Coastal Change Analysis Program (data retrieved from the Massachusetts Bureau of Geographic Information https://docs.digital.mass.gov/dataset/massgis-data-2016-land-coverland-use). The area of edge-influenced forest was estimated by buffering all non-forest land cover 20 m into the forest.
2.6. Statistical analyses
All statistical analyses were conducted in R (v.3.6.0; R Core Team). Linear mixed effects models ('lme' function; (Pinheiro et al 2019)) were used to quantify the effects of forest edges on forest BA, BAI, and canopy light transmittance with forest segment as the fixed effect and plot as the random effect. We used the 10-year mean AGWI( 2006–2015) to compare forest growth rates across forest segments. Regression models were used to quantify the roles of edge-to-interior gradients in air temperature, soil moisture, and canopy light transmittance as drivers of edge effects on forest growth. Data collection by in-situ micrometeorology sensors deployed in our plots began in late-June 2016, but the AGWI data from tree cores ends in 2015. Therefore, we used the relative changes in micrometeorological variables between the forest interior and edge, rather than the absolute values, in our statistical analyses under the assumption that while absolute values change from year to year the relative magnitude will be much more constant. We also used linear regression to quantify relationships between canopy light transmittance and soil moisture. Analysis of covariance (ANCOVA) was used to compare the slopes of the relationships between heat stress and forest growth across the rural forest fragments used in the current study and the urban forest fragments described in Reinmann and Hutyra (2017). Lastly, measurements of soil respiration from the rural plots (described in Smith et al 2019b and Supplemental Note) were used to reconcile the impacts of edge enhancements of both carbon loss and forest growth (i.e. carbon uptake) on forest carbon balance. We used analysis of variance (ANOVA) to determine if the net of the AGWI and soil respiration enhancements (relative to the interior forest segment) was significantly different than zero (i.e. different than the forest interior). Unless otherwise noted, all values reported are the means and standard error (SE).
3. Results and discussion
3.1. Forest C cycle response to edges
We find that forest BA increases linearly from the forest interior to the edge in both urban and rural forests; however, the magnitude of this enhancement is 104 ± 23% in rural forests compared to 64 ± 12% in urban forests (see supplemental note and supplemental figure 1). By contrast, tree core analyses indicate that forest BAI—the mechanism driving the BA enhancement (Reinmann and Hutyra 2017)—nearly doubles between the forest interior and edge in both urban and rural forests (figure 2), with no significant differences in the relative enhancement between these two landscapes (p = 0.63). The differences in edge enhancements of BA between rural and urban forests may be driven by the forest and edge age. At current rates of growth enhancements near the forest edge, we estimate that the ∼40-year difference in timing of when the edges were created between the urban and rural sites would be sufficient to explain the observed differences in the magnitude of the BA enhancement within 20 m of the forest edge.
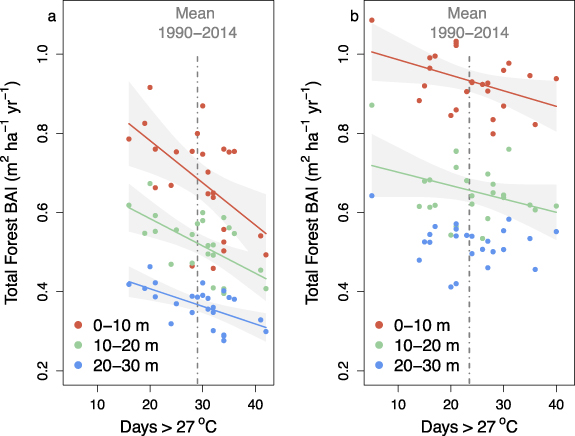
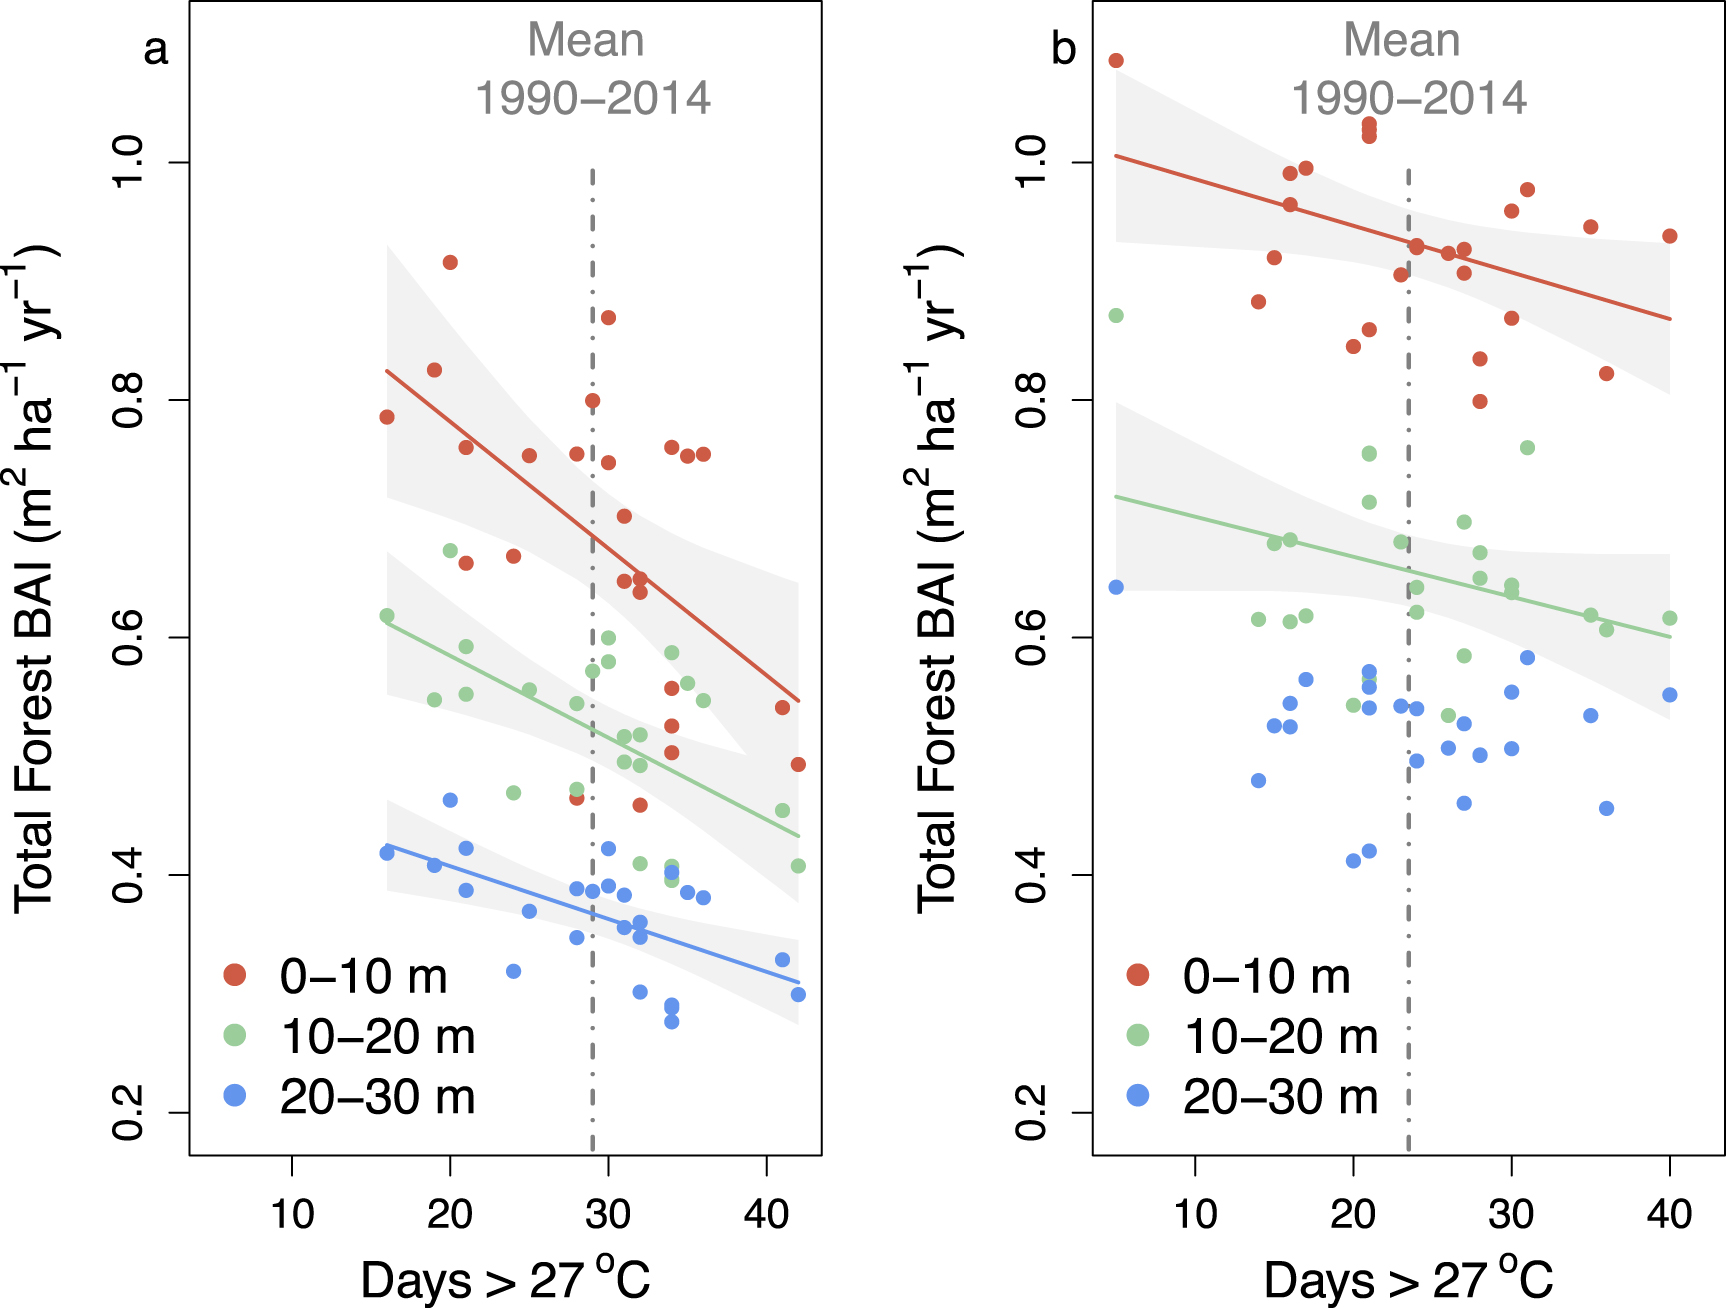
Figure 2. Relationship between forest growth and early growing season heat stress, defined as the number of days in the early growing season (i.e. June and July) above 27 °C, between the forest edge and interior for urban (a) and rural (b) temperate deciduous forests. Data are from the 25-year period spanning 1990 to 2014. Forest growth data are derived from tree cores and climate data are from the National Climate Data Center and Harvard Forest meteorological stations for the urban and rural locations, respectively. Urban forest growth data are reproduced from Reinmann and Hutyra (2017). Statistics are as follows: Urban 0–10 m (slope =−0.011, p = 0.005; r2 = 0.30), 10–20 m (slope = −0.007, p = 0.002; r2 = 0.36), and 20–30 m (slope = −0.004, p = 0.001; r2 = 0.36); Rural 0–10 m (slope = −0.004, p = 0.032; r2 = 0.18), 10–20 m (slope = −0.003, p = 0.087; r2 = 0.12), and 20–30 m (p = 0.31).
Download figure:
Standard image High-resolution imageGrowth rates of individual trees in urban areas of the northeastern U.S. have been shown to be faster than their rural counterparts (Gregg et al 2003, Briber et al 2015, Sonti et al 2019, Smith et al 2019a). In contrast, our measurements of forest-scale dynamics indicate that forest BAI is higher in rural areas than urban areas (figure 2), regardless of distance from the forest edge, but the extent to which these differences are driven by urban conditions (e.g. pollution) vs. forest structure (e.g. BA; supplemental figure 1) is unknown.
Reinmann and Hutyra (2017) found that heat stress is a significant hinderance to forest growth in urban forest fragments across greater Boston. Our urban sites experience more days of heat stress during June and July (29.6 ± 1.3 d yr−1) than our rural site (23.8 ± 1.6 d yr−1), but considerable interannual variability exists in both locations (figure 2). We find that the creation of edges also increased forest growth sensitivity to heat stress in rural landscapes, but the rate of forest growth decline in response to heat stress is two (10–20 m segment) to three (0–10 m segment) times higher in urban than rural forests (figure 2). Further, while interior (>20 m from edge) urban forests exhibit a significant growth decline in response to heat stress (p = 0.001), we found no significant response in the interior of rural forests (p = 0.27).
Most analyses of C cycling response to edges have focused on aboveground processes (Smith et al 2018). To place edge enhancements of aboveground forest growth in a broader ecosystem context, we measured soil respiration—the largest efflux of CO2 in forests (Fahey et al 2005, Giasson et al 2013)—in our rural plots during the 2016 growing season (data described in Smith et al 2019b). We find a significant increase in total soil respiration between the forest interior and edge (p < 0.001) with a 1.46 ± 0.38 Mg C ha−1 yr−1( 14.1 ± 3.8%) and a 0.44 ± 0.16 Mg C ha−1 yr−1( 4.4 ± 1.6%) enhancement of soil respiration (relative to the forest interior) in the 0–10 m and 10–20 m forest segments, respectively (figure 3 and supplemental figure 2). Despite these increases in the soil C flux, we find that because of the large increases in AGWI, the creation of edges still results in a net enhancement of forest C sequestration (relative to the forest interior) of 0.78 ± 0.93 Mg C ha−1 yr−1 in the 0–10 m segment and 0.51 ± 0.64 Mg C ha−1 yr−1 in the 10–20 m segment (mean across 0–20 segments = 0.64 ± 0.25 Mg C ha−1 yr−1; figure 3 and supplemental figure 2). At the Harvard Forest, ∼ 75% of soil respiration is from heterotrophic activity (Melillo et al 2011, Reinmann and Templer 2018), which is the primary mechanism of soil C loss in temperate deciduous forests (Fahey et al 2005). Because we did not separate heterotrophic respiration from root + rhizosphere respiration, we consider the data presented here to be lower bound estimates of the net enhancement of forest C sequestration. For context, net ecosystem exchange (NEE) at Harvard Forest varies considerably across years, but averaged 3.4 ± 0.6 Mg C ha−1 yr−1 between 2007 and 2016 (i.e. the period we used to quantify forest growth) (Munger and Wofsy 2019). While we did not directly quantify all facets of NEE, our findings suggest there is a large increase in the rate of net C sequestration within 20 m of an edge in temperate deciduous forests.
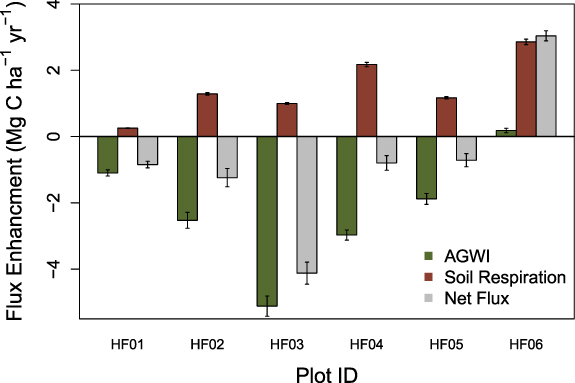
Figure 3. Edge enhancements of forest carbon fluxes associated with AGWI, soil respiration, and the net of these two fluxes for the forest edge (i.e. 0–10 m) forest segment. Data represent plot means and error bars represent the SE of the means. Note, plot HF06 is adjacent to a road while all other plots are adjacent to vegetated land covers. HF06 exhibited the largest enhancement of air temperature and the smallest enhancement of LAI (via canopy light transmittance).
Download figure:
Standard image High-resolution imageWe find large variation in the magnitude of growth enhancement observed along forest edges. For example, relative to the forest interior (20–30 m segment), AGWI at the forest edge (0–10 m segment) of our rural plots ranged from a 6.7% decline to a 152% increase (figure 3). However, the one rural site with a decline in growth in the forest edge segment (i.e. −6.7%) had the largest growth enhancement in the intermediate (10–20 m) forest segment (i.e. + 135%; supplemental figure 2).
3.2. Mechanisms of forest response to edges
Similar to previous work (Matlack 1993, Taylor et al 2012, Schmidt et al 2017), our measurements indicate that the forest edge is warmer than the forest interior (see supplemental Note and supplemental figure 3). In particular, we find that growing season daily maximum air temperatures increase by 0.78 ± 0.23 °C between the forest interior and edge (supplemental figure 3). For context, these interior-to-edge increases in air temperature are comparable to the amount of warming this region has experienced in response to climate change between 1900 and 1999 (Hayhoe et al 2007). The hotter conditions near the forest edge likely play an important role in mediating our observed increase in forest growth sensitivity to heat stress between the interior and edge.
We find that canopy light absorption increases between the forest interior and edge (supplemental figure 5). Nearly all of the variability in the magnitude of the forest edge growth enhancement across our plots can be explained by variations in canopy light absorption for both the 0–10 m (p = 0.002, r2 = 0.92) and 10–20 m forest segments (p = 0.009, r2 = 0.85) (figure 4). Similarly, the fraction absorbed PAR has been shown to be an important mediator of temperate forest productivity and is a central ecosystem model parameter (Bolstad et al 2001). These findings point to stimulated leaf production—likely in response to greater light availability—as the primary mechanism underpinning the forest edge growth enhancement in temperate deciduous forests. Recent research indicates that leaf production response to the creation of forest edges is also important in tropical rainforests where declines in forest biomass near the edge are linked to declines in leaf mass (Ordway and Asner 2020).
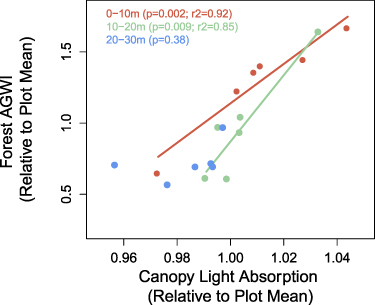
Figure 4. Relationship between forest AGWI and canopy light absorbance (% of above canopy), both normalized to plot mean. Points represent the forest 0–10 m, 0–20 m, and 20–30 m forest segments for each plot (n = 6). Note, canopy light absorbance is positively related to leaf area index.
Download figure:
Standard image High-resolution imageAcross our plots, the magnitude of edge-enhanced canopy light absorbance (p = 0.04, r2 = 0.69) and forest growth (p = 0.07; r2 = 0.65) are negatively correlated with edge enhancements of air temperature (supplemental figure 3). High exposure to heat can reduce tree leaf area (Teskey et al 2015), which in conjunction with our findings, might suggest the presence of a tipping point whereby large increases in air temperature can reduce the capacity of trees near the forest edge to capitalize on increased light availability. However, it is also possible that greater shading and transpiration associated with higher LAI values could attenuate edge enhancements of air temperature. Notably, our one plot located along a road, which exhibited a decline in forest growth in the 0–10 m segment (relative to the interior; figures 1 and 3), exhibited the largest increase in air temperature (+1.6 °C) near the edge, as well as a decline in canopy light absorption (i.e. decrease in LAI) between the forest interior and edge.
While gradients in soil moisture were not a significant driver of the magnitude of the forest edge growth enhancement, there is a significant negative correlation between canopy light absorbance and soil moisture (supplemental figure 4). Leaf area is an important mediator of canopy transpiration and, thus, soil moisture (Bréda and Granier 1996, Granier et al 2000). Although little data exist, there is evidence that altered growing conditions near forest edges can increase rates of canopy transpiration by over 50% in temperate deciduous forests (Herbst et al 2007). Collectively, higher temperatures near the forest edge coupled with higher leaf area and water demand could make temperate forest fragments in the northeastern U.S. more vulnerable to projected increases in heat and water stress during the growing season (Reinmann and Hutyra 2017, USGCRP 2018).
3.3. Landscape implications
The large enhancements of forest growth and net C sequestration along forest edges can have significant implications for landscape-scale C balance, depending on the proportion of edge-influenced forest. We find that 27.5% of the 1.44 Mha of forest in Massachusetts is within 20 m of a non-forest edge (figure 5). Assuming that the 0.64 ± 0.25 Mg C ha−1 yr−1 increase in net C sequestration within 20 m of an edge that we estimate for our plots at Harvard Forest is applicable to forests across the state, edge enhancements of net C sequestration increase statewide rates of C sequestration by 254 747 ± 97 416 Mg C yr−1, compared to conventional estimates that do not account for edge enhancements. For context, this previously unaccounted for C sink is approximately three orders of magnitude larger than annual declines in the forest C sink directly associated with deforestation across the state (1578 to 2493 ha forest lost yr−1) (Blumstein and Thompson 2015, Reinmann et al 2016). We stress caution in the interpretation of these findings for management applications because fragmentation necessarily reduces total forest area that the large C sequestration enhancements of new forest edges cannot fully offset. For example, even when accounting for edge enhancements of forest growth, the forest C sink of southern New England (i.e. Massachusetts, Connecticut, and Rhode Island) was estimated to be 31% lower than it would have been in the absence of net declines in forest cover since the precolonial era (Reinmann and Hutyra 2017).
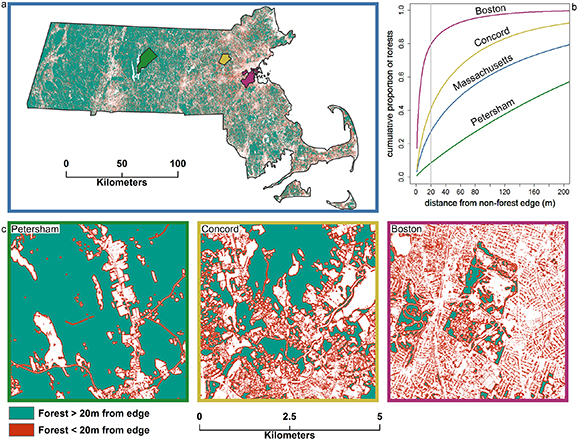
Figure 5. Spatial patterns in the prevalence of forest edges across Massachusetts (a) and the proportion of total forest at different distances from a forest edge for Massachusetts, Boston, the suburban town of Concord, and the rural town of Petersham (b). Panel c provides a representative area of each municipality to highlight the transition between the forest interior-dominated landscape of central Massachusetts (left) to the forest edge-dominated landscape of heavily urbanized Boston (right).
Download figure:
Standard image High-resolution image
The importance of edges for landscape C balance varies considerably at finer spatial scales. The proportion of forest area <20 m of an edge is an order of magnitude higher in Boston (79.5%) than 110 km to the west in the rural landscape near the Harvard Forest in Petersham (8.5%), which results in large differences in the effects of edges on landscape C balance and its response to climate (figure 5). In the edge-dominated forests of Boston, which is 24.9% forested, this equates to a 0.71 Mg C ha−1 of forest year−1 increase in net forest C sequestration. By contrast, forest edges in the interior-dominated forests of Petersham, which is 89.9% forested, have only a small impact on net C sequestration. Interestingly, we also find that even Concord—a leafy suburb of Boston with >60% forest cover—has >40% of its forest area <20 m of an edge, which increases net C sequestration by 0.37 Mg C ha−1 of forest year−1 compared to estimates not accounting for edge enhancements (figure 5).
4. Conclusions
Collectively, these findings suggest that (all else being equal) per unit forest area, urban forests are substantially more productive than rural forests, highlighting the disproportionate role that remnant forests play in developed landscapes (Blumstein and Thompson 2015). This work bolsters earlier findings that reforestation in urban areas can provide an important nature-based climate change mitigation opportunity (Fargione et al 2018) and suggests that the strength of the urban forest C sink may be stronger than initially thought. However, in light of our findings that both urbanization and fragmentation increase forest sensitivity to heat, warming climate conditions will likely have a disproportionately negative impact on rates of forest C sequestration across urban compared to rural landscapes. The rapid growth of cities globally is greatly increasing the area of forest influenced by urban conditions (Nowak and Walton 2005, Seto et al 2012), while growing interest in 'greening' as part of climate change adaptation and urban sustainability strategies is increasing our demand for the services they provide. As a result of these ongoing changes in urban forest extent and the pressures we place on these forests, it is critical that we understand how urbanization alters forest C cycling and its response to climate. Owing to similarities in forest type, landscape composition, and urban form we suspect our findings here are applicable to other locations within the Northeast Corridor, which is home to >50 million people and the highest concentration of U.S. municipalities with targets for reducing net C emissions (e.g. New York State's Climate Leadership and Community Protection Act and Boston's Carbon Neutrality program) (USGCRP 2018).
As an increasing number of governments and municipalities globally move to implement significant reductions in greenhouse gas emissions, accurate monitoring, reporting and verification (MRV) approaches will be essential to the success of these programs. Top-down approaches that attribute regional atmospheric CO2 enhancements to constituent sources and sinks show great promise as an MRV tool (e.g. Sargent et al 2018). Biological processes play an important role in mediating atmospheric CO2 across both urban and rural landscapes—for example, soil respiration can comprise a CO2 flux of similar magnitude to fossil fuel emissions (Decina et al 2016). Our findings here as well as those from earlier studies (Laurance and Williamson 2001, Gregg et al 2003, Herbst et al 2007, Lhotka and Stringer 2013, Briber et al 2015, Chaplin-Kramer et al 2015, Remy et al 2016a, Reinmann and Hutyra 2017, Smith et al 2018, 2019a) suggest that including the effects of both urbanization and forest fragmentation on forest C cycling dynamics is essential for reconciling the contribution of biogenic C fluxes to regional C balance. This is especially true for the large swaths of our landscapes that are influenced by both rural and urban growing conditions. Further, the different sensitivities of forest growth to heat in intact versus fragmented forests across rural and urban landscapes that we show here highlight the importance of accounting for these landscape variables when projecting the strength of the forest C sink under a changing climate.
Acknowledgments
We thank Josh Plisinski for helping with figure 5. We thank the Massachusetts Audubon, The City of Lynn, Massachusetts, The Trustees of Reservation and all land owners for allowing research on their properties. We also thank the Hutyra, Templer, Dietze labs at Boston University for support in the lab, field, and with instrumentation throughout this project. This work was supported, in part, by the United States Department of Agriculture National Institute of Food and Agriculture Award 2017‐67003‐26615, the Harvard Forest LTER Program (NSF DEB 18-32210), and the US National Science Foundation Research Experience for Undergraduates program.