


Abstract
Ecosystem service (ES) flows across geophysical and administrative boundaries are ubiquitous and are receiving more attention in an increasingly metacoupled world. Omitting trans-boundary ES flows from ES assessments will lead to unilateral conclusions and underestimation of ES contributions over distances. Inner Mongolia is an important ecological security barrier of China and Eurasia, but the trans-boundary effect of this barrier is difficult to be quantitatively evaluated and is rarely assessed. This study assessed the ecological security barrier function of Inner Mongolia from the perspective of trans-boundary ES flows, including wind prevention and sand fixation (WPSF), water provision (WP), carbon sequestration (CS) and livestock product provision (LPP) service flows. The trans-boundary value flows for the WPSF, WP, CS and LPP services in 2010 were 6.20 × 10¹⁰ CNY (Chinese currency, yuan), 0.21 × 10¹⁰ CNY, 1.29 × 10¹⁰ CNY and 1.27 × 10¹⁰ CNY, respectively, and 5.89 × 10¹⁰ CNY, 0.16 × 10¹⁰ CNY, 0.37 × 10¹⁰ CNY and 1.33 × 10¹⁰ CNY, respectively, in 2015; correspondingly, the percentages of these trans-boundary value flows in terms of the total value flow were 69.12%, 2.34%, 14.38% and 14.16%, respectively, in 2010 and 76.00%, 2.06%, 4.77% and 17.16%, respectively, in 2015. Therefore, WPSF service plays a more important role in the trans-boundary ecological security barrier function of Inner Mongolia. This study can enhance the understanding of trans-boundary telecoupling in an integral socio-ecological system and identify the critical ESs to form a foundation for ecological conservation measures considering sustainable development.
Export citation and abstract BibTeX RIS

Original content from this work may be used under the terms of the Creative Commons Attribution 3.0 licence. Any further distribution of this work must maintain attribution to the author(s) and the title of the work, journal citation and DOI.
1. Introduction
Ecosystem services (ESs) are the benefits that humans derive from natural ecosystems (MA (Millennium Ecosystem Assessment) 2005). The acquisition of these benefits is not limited to local areas but often exists as a transregional phenomenon, that is, the dislocation of service providing areas (SPAs) and service benefiting areas (SBAs) in time and space. This spatio-temporal mismatch leads to the spatial flow of ESs, but this spatial flow is often ignored or underestimated in existing ES evaluations (Pascual et al 2017). With rapid social and economic development, there is an increasing demand for ESs; the effect of ES flow is becoming increasingly obvious, and the scope of ES flow is increasing. ES flow, as an intermediate link between SPAs and SBAs, has an important impact on whether the demand for ESs can be satisfied (Burkhard et al 2012, Syrbe and Walz 2012) and is presently the focus of ESs research. Spatial mapping of ES supply and its characteristics represent incipient ES flow research, and mapping of ES supply and demand is the basis of ES flow research (Xiao et al 2016). Considering ES flow enriches research regarding the correlation between ES supply and demand (Bagstad et al 2013, Villamagna et al 2013, Serna-Chavez et al 2014) and emphasizes the diffusion path simulation of the ES effects. Clarification of the transregional effects of ESs on human welfare can provide a direct and scientific basis for ecological environmental protection measures, interregional ecological cooperation and horizontal ecological compensation policy.
The ES flow mechanism varies among ES types (Schröter et al 2018), leading to various spatio-temporal relationships between SPAs and SBAs, such as (1) global service flow does not rely on proximity to the service, e.g. climate regulation and carbon sequestration (CS); (2) adjacent services on a local scale include all-around services (e.g. pollination) and directional services (e.g. water provision (WP) and wind prevention and sand fixation (WPSF)); and (3) services related to a user's movement, e.g. scenery appreciation (Costanza 2008, Fisher et al 2009). Currently, there are two main understandings of ES flow (Yao et al 2018). One emphasizes the spatio-temporal connection process between the SPAs and SBAs and mainly reveals the dynamic mechanism of ES flows based on a distributed ecosystem model, such as the Artificial Intelligence for Ecosystem Services (ARIES) system constructed by the University of Vermont (Bagstad et al 2014, Bagstad et al 2016, Zank et al 2016) or the distributed hydrological model (Francesconi et al 2016, Schmalz et al 2016). The other understanding is based on the gray/black box theory, which does not consider the status and structure of the ecosystem and emphasizes only the ultimate utility and the balance between ES supply and demand (Baró et al 2016, Goldenberg et al 2017). However, regardless of the method adopted when simulating ES flows, the transregional effect should be quantitatively reflected to establish the spatio-temporal relationship between supply and demand.
Inner Mongolia is an important ecological security barrier in northern China and plays an important role in ensuring the quality of life and physical and mental health of Chinese and Northern Eurasian people (Chen et al 2018). The WPSF, WP, CS and livestock product provision (LPP) services are the main ESs of Inner Mongolia. These ESs benefit local areas and contribute to regional and global human welfare. In this research, the ecological security barrier function of Inner Mongolia was quantified by analyzing the ES flow effects of WPSF, WP, CS and LPP services based on differences in the corresponding ES flow mechanisms. This study can clarify the trans-boundary effects of ESs in Inner Mongolia and provide a scientific basis for the ES payments and ecological environmental protection measures to ensure that the ecological security barrier function of Inner Mongolia is fully utilized.
2. Methodology
2.1. Study area
Inner Mongolia is in northern China (37 °24'–53 °23' E, 97 °12'–126 °04' N) (figure 1(a)), with an average elevation of 1000 m (figure 1(c)). The total area of Inner Mongolia is 1.18 × 10⁶ km2. The climate is dominated by a temperate continental monsoon. The river distribution in Inner Mongolia is uneven, and flows are low. From east to west, there are 12 major river basins and seven river systems (figure 1(b)), including the Erguna River, Nenjiang River, Xiliao River, Yongding River, Luanhe River, Yellow River and Inland River, in Inner Mongolia. The basic ecosystem pattern is 'forest in the east, grass in the middle, sand in the west with grazing in the north and agriculture in the south'. Grassland is the main ecosystem type in Inner Mongolia.
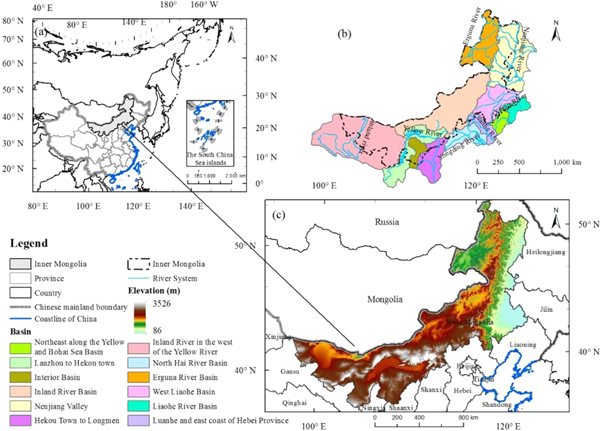
Figure 1. Location of the study area. (a) Map of the location of Inner Mongolia. (b) The basins and river systems of Inner Mongolia. (c) The elevation and regions adjacent to Inner Mongolia.
Download figure:
Standard image High-resolution image2.2. Methods and analytical framework
From the perspective of ES flow, ESs flow from SPAs to SBAs. Therefore, the spatial scope of SPAs and SBAs should first be identified. Among the four ESs involved in this study, WP, CS and LPP services have obvious supply-demand balances, which correspond to water yield and water consumption, CS and carbon emission amount, livestock product production and consumption, respectively. For such ESs, SPAs are the regions where the supply-demand balance is positive in Inner Mongolia, and the regions where the supply-demand balance is negative both in and out of Inner Mongolia are the potential SBAs (figure 2). WPSF is a protective service and it is difficult to quantify its service demand characteristics. In addition, the flow process of WPSF service is mainly controlled by natural conditions and is basically free from human interference. Therefore, the diffusion paths and SBAs of WPSF service can be simulated only without vegetation. According to the differences in ES flow characteristics, the spatial scales of SBAs extend from the local to regional and global scale, which reflects the transregional flow of ESs. The effects of ES flows are reflected in the diffusion of physical flow and the transfer of value flow. Physical flow is the carrier of value flow. Based on the ESs valuation and physical flow of ESs, the ES value flow can provide a more direct reference for the formulation of horizontal ecological compensation policies.
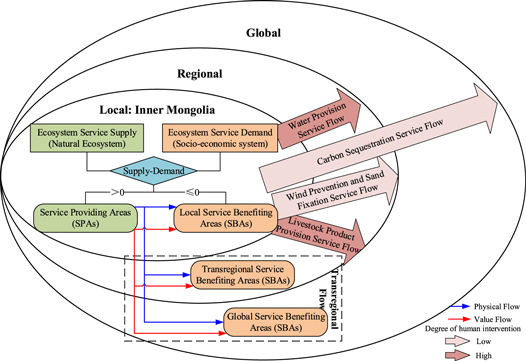
Figure 2. The analytical framework of the ecosystem service flow effect in Inner Mongolia.
Download figure:
Standard image High-resolution imageAs one of the most important ecological functions of natural ecosystems in arid and semiarid areas, WPSF service is conducive to the sustainable development of the regional economy and human welfare. WPSF service flow is associated with dust migration from the source region to the potential subsidence area. The physical WPSF service can be evaluated by the Revised Wind Erosion equation model from the perspective of wind erosion considering the model's applicability (Fryrear et al 1998, Du et al 2015, Du et al 2016, Jiang et al 2016a) (table 1). The value of WPSF service was estimated by the substitute cost method (supplementary A1 is available online at stacks.iop.org/ERL/14/065002/mmedia.). The WPSF service flow is a passive process involving air flow, and the demand for this service is nonquantifiable. We evaluated the flow effect by identifying the SBAs of the WPSF service and tracing the sand and dust transmission in the downwind direction based on the hybrid single-particle Lagrangian integrated trajectory model, which has high operability and computational efficiency (Draxler et al 2001, Escudero et al 2006).
WP is a typical ES with spatial mismatch between supply and demand. The water balance method is widely used in the physical calculation of WP. We estimated the water demand based on agricultural, domestic and industrial consumptive use by spatial visualization combined with population, gross domestic product and land use type distribution (Li et al 2017). The value of WP service was estimated by the market price method (supplementary A2). The WP service flow was simulated by simplifying the surface water supply of the Service Path Attribution Networks (SPANs) model (Johnson et al 2012) based on a digital elevation model and stream network data; WP service flowed from upstream to downstream after satisfying the local water consumption.
The flow mechanism of CS service is complex, and the effect is global. Few studies to date have quantified and visualized the CS service flow process. We attempted to evaluate the flow from the perspective of supply-demand balance (Li et al 2019). On the supply side, the physical CS service included the CS of vegetation and soil, which could be evaluated based on the net primary productivity (NPP) and soil organic carbon pool, respectively. The CS service was estimated by the reforestation cost method (supplementary A3). The demand of CS service could be calculated based on the emission coefficient method of the Intergovernmental Panel on Climate Change (IPCC).
LPP service is more influenced by human intervention than other services are. With the development of the economy and the diverse dietary needs of the people, the flow extent of LPP service is not restricted to the local scale but is transregional and even global due to trade (Kastner et al 2011, Xie et al 2014). The physical LPP service can be converted from NPP, and the demand calculation was based on the spatialization of livestock product consumption data. The value of LPP service was estimated by the market-price method (supplementary A4). Considering the data restriction, we estimated the LPP service flow from the perspective of supply-demand balance, which can sufficiently quantify the flow effects.
Table 1. Evaluation methods of related ecosystem service flow effect (supplementary A).
| Ecosystem service type | Physical amount calculation | Value amount evaluation | Demand calculation | Ecosystem service flow |
|---|---|---|---|---|
| Wind prevention and sand fixation service | RWEQ | Substitute cost method | Passive and nonquantifiable demand | HYSPLIT |
| Water provision service | Water balance method | Market-price method | Spatialization of water consumption data based on land cover, population density and GDP density | Water flow model based on DEM |
| Carbon sequestration service | Carbon sequestration of vegetation: conversion from NPP based on Carnegie-Ames-Stanford Approach (CASA) models carbon sequestration of soil: soil organic carbon pool | Reforestation cost method | Emission coefficient method of IPCC | Supply-demand balance |
| Livestock product provision service | Conversion from NPP based on CASA models | Market-price method | Spatialization of livestock product consumption data based on population density | Supply-demand balance |
3. Results
3.1. WPSF service flow of Inner Mongolia
In 2010 and 2015, the total physical amount of WPSF service in Inner Mongolia was 7.83 × 10¹² kg and 7.37 × 10¹² kg, respectively. The average physical amount of WPSF service per unit area was 6.90 × 10⁶ kg km−2 a−1 and 6.40 × 10⁶ kg km−2 a−1 in 2010 and 2015, respectively. Correspondingly, the total value of WPSF service in Inner Mongolia was 7.83 × 10¹⁰ CNY in 2010 and 7.37 × 10¹⁰ CNY in 2015. The average value amount of WPSF service per unit area was 6.90 × 10⁴ CNY km−2 a−1 and 6.40 × 10⁴ CNY km−2 a−1 in 2010 and 2015, respectively. In terms of spatial distribution (figure C1), the quantity of windbreak and sand fixation per unit area in central area was high, while that in the west and northeast was low.
The spatial distribution patterns of the flow paths of WPSF service in Inner Mongolia were similar in 2010 and 2015 (figure C2), mainly passing through northeastern and northern China and extending to North Korea, South Korea, Japan, Mongolia, southeastern Russia, Alaska of the United States and a small part of the northwest Philippines. The SBAs encompassed an area of 2832.75 × 104 km2 in 2010 and 3348.72 × 104 km2 in 2015, of which 22.87% and 18.83% were within China. In 2010 and 2015, the average trajectory frequency of SBAs was 1.11% and 0.91%, respectively, and the average of SBAs while that in China was 2.97% and 2.58%, respectively. The paths of the WPSF service passed through the following regions at a high frequency (≥10%): Hexi Corridor in Gansu Province, Hulunbuir in Inner Mongolia, Hunshandak Sandland and the wind erosion and desertification areas at the northern foot of Yinshan Mountain. The WPSF service of Inner Mongolia is not only conducive to alleviating the transmission of sand and dust in local wind-erosion-prone areas but also plays an important role in the prevention of sand and dust in China and neighboring countries.
The physical flow rate of WPSF service obtained locally in Inner Mongolia was 1.63 × 10¹² kg in 2010 and 1.48 × 10¹² kg in 2015, and the value flow rate was 1.63 × 10¹⁰ CNY and 1.48 × 10¹⁰ CNY in 2010 and 2015, respectively. The physical flow rate of WPSF service obtained within China across the Inner Mongolia border was 4.39 × 10¹² kg in 2010 and 3.74 × 10¹² kg in 2015, corresponding to a value flow rate of 4.39 × 10¹⁰ CNY and 3.74 × 10¹⁰ CNY, respectively. The distribution of physical and value flows decreased concentrically from the central concentration (figure 3), consistent with the service transmission paths passing through the region (figure C2).
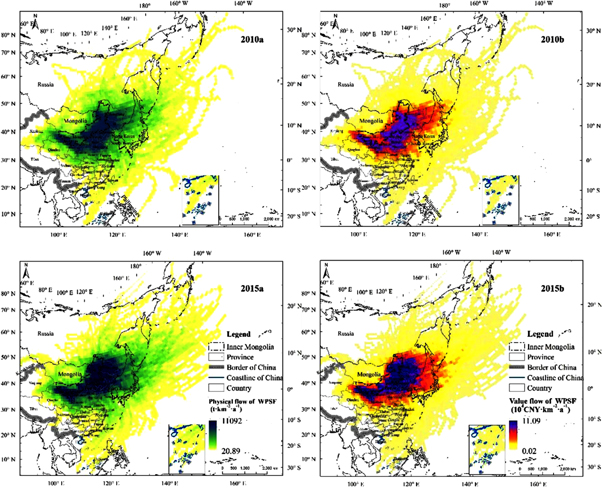
Figure 3. Flow effect of wind prevention and sand fixation service in Inner Mongolia's SBAs in 2010 and 2015. The figures labeled with a suffix a and b represent physical flow and value flow of wind prevention and sand fixation service in Inner Mongolia in 2010 and 2015, respectively.
Download figure:
Standard image High-resolution image3.2. WP service flow of Inner Mongolia
The total physical amount of WP service in Inner Mongolia decreased from 5.70 × 10¹⁰ m3 in 2010 to 3.73 × 10¹⁰ m3 in 2015, and the total value was 0.51 × 10¹⁰ CNY and 0.34 × 10¹⁰ CNY, respectively. The spatial distribution pattern was higher in the northeast and lower in the southwest (figure C3, table D). In 2010 and 2015, the dynamic water surplus in Inner Mongolia was 13.60 × 10¹² m3 and 7.26 × 10¹² m3, respectively. The spatial heterogeneity of the dynamic water surplus in Inner Mongolia was significant: high in the east and low in the west (figure 4).

Figure 4. Dynamic surplus and potential flow paths of water provision service in 2010 and 2015.
Download figure:
Standard image High-resolution imageIn 2010, the physical inflow of WP service in Inner Mongolia was 0.47 × 10¹⁰ m3, and the physical outflow was 2.82 × 10¹⁰ m3, corresponding to a value inflow of 0.42 × 10⁹ CNY and a value outflow of 2.53 × 10⁹ CNY, respectively. In 2015, Inner Mongolia had a physical inflow of 0.20 × 10¹⁰ m3 and a physical outflow of 1.78 × 10¹⁰ m3, corresponding to a value inflow of 0.18 × 10⁹ CNY and a value outflow of 1.60 × 10⁹ CNY, respectively. Overall, Inner Mongolia was a supply area of WP service. In 2010, except for the Inland River Basin west of the Yellow River, Lanzhou to Hekou and the Interior Basin, the amount of water transferred from Inner Mongolia was much greater than that from each river basin (figure C4, supplementary D). In 2015, the transregional effect of WP service in Inner Mongolia was similar to that in 2010, but the WP service from Lanzhou to Hekou was greatly reduced, which led to the physical flow from Lanzhou to Hekou being smaller than that from Inner Mongolia in 2015.
3.3. CS service flow of Inner Mongolia
In 2010 and 2015, the total carbon sequestered in Inner Mongolia was 18.05 × 10¹⁰ kg and 18.84 × 10¹⁰ kg, respectively, of which, the CS 13.72 × 10¹⁰ kg and 14.51 × 10¹⁰ kg was sequestered in vegetation, respectively, 4.33 × 10¹¹ kg was sequestered in soil (in both years). The total value of CS service was 4.71 × 10¹⁰ CNY in 2010 and 4.92 × 10¹⁰ CNY in 2015. The spatial distribution of the total CS service was similar to that of vegetation CS service, decreasing from northeast to southwest (figure C5). In 2010 and 2015, the total demand for CS service in Inner Mongolia was 12.88 × 10¹⁰ kg and 17.43 × 10¹⁰ kg, respectively, which was mainly concentrated in densely populated urban areas. The supply-demand balance of CS service in Inner Mongolia was 4.95 × 10¹⁰ kg in 2010 and 1.18 × 10¹⁰ kg in 2015, reflecting a the supply area of CS service overall.
The demand for CS service in surrounding urban areas of Inner Mongolia was in short supply (figure 5), including the potential SBAs of CS service, especially the demand gap in the Beijing-Tianjin-Hebei urban agglomeration. At the provincial and municipal scales, the supply-demand balance of CS service in Hebei, Shanxi, Liaoning, Tianjin, Ningxia and Beijing were all negative in 2010 and 2015; in 2010, the demand gaps in each province/city were 14.96 × 10¹⁰ kg, 7.52 × 10¹⁰ kg, 7.08 × 10¹⁰ kg, 4.10 × 10¹⁰ kg, 2.67 × 10¹⁰ kg and 1.47 × 10¹⁰ kg, respectively; in 2015, the demand gaps increased to 16.00 × 10¹⁰ kg, 12.32 × 10¹⁰ kg, 9.42 × 10¹⁰ kg, 7.22 × 10¹⁰ kg, 2.90 × 10¹⁰ kg and 2.85 × 10¹⁰ kg, respectively.

Figure 5. The supply-demand balance and potential flow paths of carbon sequestration service in Inner Mongolia's adjacent province/city in 2010 and 2015.
Download figure:
Standard image High-resolution image3.4. LPP service flow of Inner Mongolia
The provision of livestock products in Inner Mongolia increased from 8.92 × 10⁸ kg in 2010 to 9.26 × 10⁸ kg in 2015, and the demand for livestock products increased from 6.74 × 10⁶ kg in 2010 to 1.18 × 10⁷ kg in 2015, leading to a 3.11% increase in the balance of livestock products from 8.85 × 10⁸ kg to 9.12 × 10⁸ kg. In 2010 and 2015, the values of LPP service were 1.28 × 10¹⁰ CNY and 1.35 × 10¹⁰ CNY, respectively. The supply-demand balance of LPP service in 2010 and 2015 was lower in the east and higher in the west (figure C6). The supply-demand balance of LPP service in Inner Mongolia resulted in a deficit in only a few regions, and most other areas had a surplus of livestock products. Therefore, Inner Mongolia as a whole was a supply area of LPP service.
In 2010 and 2015, the local physical flow of LPP service was 0.67 × 10⁷ kg and 1.18 × 10⁷ kg, respectively, and the corresponding local value flow in Inner Mongolia was 0.01 × 10¹⁰ CNY and 0.02 × 10¹⁰ CNY, respectively. The transregional physical flow of LPP service was 8.85 × 10⁸ kg and 9.14 × 10⁸ kg with a transregional value flow of 1.27 × 10¹⁰ CNY and 1.33 × 10¹⁰ CNY in 2010 and 2015, respectively. The SBAs were concentrated in central Northeast China, North China and the Guanzhong regions (figure 6). The LPP service mainly flowed from the sparse shrubs and grasslands in the east and the forests and grasslands in the central areas of Inner Mongolia to the SBAs.

Figure 6. The supply-demand balance and potential flow paths of livestock product provision service in Inner Mongolia in 2010 and 2015.
Download figure:
Standard image High-resolution image3.5. Combined effects of ES flow of Inner Mongolia
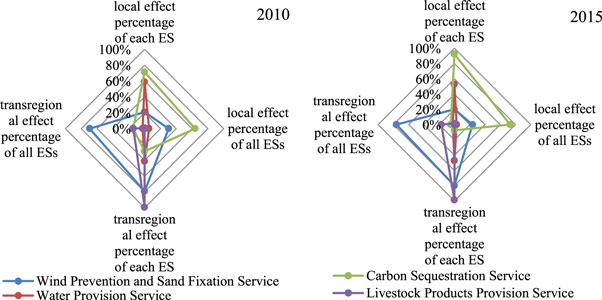
Based on the regional effects of WPSF, WP, CS and LPP service in Inner Mongolia (table 2), the total ES local value flow within Inner Mongolia was 5.36 × 10¹⁰ CNY in 2010 and 6.21 × 10¹⁰ CNY in 2015, which accounted for 37.40% and 45.56% of the total ES value, respectively (figure 7). In terms of the individual ES type, the local effect of CS service was the most significant, accounting for 71.34% and 92.48% of the total CS service values in 2010 and 2015, respectively. In 2010 and 2015, the total transregional ES value flow in Inner Mongolia was 8.97 × 10¹⁰ CNY and 7.75 × 10¹⁰ CNY, respectively, accounting for 62.60% and 55.44% of the total value flow in that year. The transregional effects of LPP service were the most significant, accounting for 99.22% and 98.52% of the total LPP service flow in 2010 and 2015, respectively. Overall, among the total local value flows, the percentage of the local value flow of CS service was 63.81% in 2010 and 73.03% in 2015. In terms of all four ESs, the transregional flow effects of the WPSF service cover the largest percentage of all transregional value flows, accounting for 69.12% in 2010 and 76.00% in 2015. Therefore, the ecological security barrier function of Inner Mongolia is mainly attributed to CS service at the local scale and WPSF service at the transregional scale. The improvement of ESs in Inner Mongolia can strengthen the local ecological environment and play an important role as a barrier to the ecological environment outside the region, especially the ecological security of surrounding large urban agglomerations.
Figure 7. The local and transregional effect of ecosystem service flow in Inner Mongolia.
Download figure:
Standard image High-resolution image
Table 2. The effect of ecosystem service flow in Inner Mongolia.
| Ecosystem service type | Year | Total physical amount | Total value amount/1010 CNY | Local physical flow | Local value flow/1010 CNY | Transregional physical flow | Transregional value flow/1010 CNY |
|---|---|---|---|---|---|---|---|
| Wind Prevention and Sand Fixation Service | 2010 | 7.83 × 10¹² kg | 7.83 | 1.63 × 10¹² kg | 1.63 | 6.20 × 10¹² kg | 6.2 |
| 2015 | 7.37 × 10¹² kg | 7.37 | 1.48 × 10¹² kg | 1.48 | 5.89 × 10¹² kg | 5.89 | |
| Water Provision Service | 2010 | 5.70 × 10¹⁰ m3 | 0.51 | 3.35 × 10¹⁰ m3 | 0.30 | 2.35 × 10¹⁰ m3 | 0.21 |
| 2015 | 3.73 × 10¹⁰ m3 | 0.34 | 1.98 × 10¹⁰ m3 | 0.18 | 1.75 × 10¹⁰ m3 | 0.16 | |
| Carbon Sequestration Service | 2010 | 1.81 × 10¹¹ kg | 4.71 | 12.88 × 10¹⁰ kg | 3.42 | 4.95 × 10¹⁰ kg | 1.29 |
| 2015 | 1.88 × 10¹¹ kg | 4.92 | 17.43 × 10¹⁰ kg | 4.55 | 1.18 × 10¹⁰ kg | 0.37 | |
| Livestock Product Provision Service | 2010 | 8.92 × × 108 kg | 1.28 | 0.67 × 10⁷ kg | 0.01 | 8.85 × 10⁸ kg | 1.27 |
| 2015 | 9.26 × 10⁸ kg | 1.35 | 1.18 × 10⁷ kg | 0.02 | 9.14 × 10⁸ kg | 1.33 |
4. Discussion and conclusions
This study reflects the various mechanisms of ES flows. For Inner Mongolia, the ES flows of WPSF, WP, CS and LPP extend from local to trans-boundary scales, while the degree of trans-boundary flows varies. ES flows are driven by both natural and human factors, such as natural ecology and social economy, leading to the spatio-temporal changes in ES supply and demand. The relationship between these factors are complex and interactive (Schröter et al 2018). WPSF is a typical example of passive ES flow, which is more influenced by natural conditions (e.g. wind speed and precipitation) and clearly changes with the season (Xu et al 2018). The provision of WP, CS and LPP service are more affected by the climate and vegetation, while their demand is basically driven by human needs and preferences.
The initial research on ES flows mainly focused on the identification of beneficiaries and quantified the supply and demand of ESs individually (Burkhard et al 2012). To forbid the segmentation of the supply and demand of ES, recent studies have attempted to reveal multi-dimensional supply-demand mismatches (Wei et al 2017). In increasingly metacoupled social-ecological systems, trans-boundary ES flows over distances are becoming more common and aim to link human-nature interactions in a more comprehensive way (Liu et al 2017). Liu et al (2016) established an integrated telecoupling framework to analyze the causes, effects, agents, and dynamics of ES flows and applied the framework to China's South–North Water Transfer Project. This framework proved the transregional effect of ES flows and the necessity of a more holistic assessment of socio-economic and environmental interactions over distances. Many studies evaluated the spatial pattern and impacts of distant virtual material flows embodied in the products and services (e.g. water, energy, land, CO2, and nitrogen) (Feng et al 2013, Duan et al 2018, Xu et al 2019b) but did not emphasize the contribution of ES flow. Xu et al (2019a) assessed the temporal evolution and interactions of virtual material and financial capital flows by comparing the trade between adjacent and distant countries, consistent with the cross-border physical and value flow perspective in this research. Schröter et al (2018) also stressed interregional ES flows by constructing a conceptual framework between the sending and receiving system of an ES. However, there is a lack of a spatio-temporal delineation of trans-boundary ES flows in a certain study area.
This study addresses the research gap in the mapping of various ES flows in a certain region. The analysis framework can be applied directly to the corresponding ES flow simulation in other areas. The supply-demand balance approach is more suitable for ESs that have obvious supply-demand relationships and for which the flow mechanism remains uncertain. This method is based on the gray/black box theory. ES flows with specific movement mechanisms, such as water and sand transport, should be better evaluated by the corresponding distributed ecosystem model. This research did not consider the stakeholders' intervention to the ES flow process or the seasonal variation in the supply, demand and flow paths. It is still challenging to quantify the complex interactions over space and time and among various stakeholders.
The trans-boundary ES flows have broad implications in the decision-making process, including ES management, sustainable development, land use policy, and payments for ESs (PES) not only for Inner Mongolia and China but also for any other regions worldwide. Due to population growth and economic development, demands for ESs are rapidly increasing, often beyond the supply capacity of the ecosystem; additionally, a gradual decline in certain ESs is occurring. In this case, the ES flow process is conducive to coordinating the relationship between supply and demand for a specific spatio-temporal location. ESs are the foundation of sustainable development. With globalization acceleration, transregional trading of goods, information interchange and population mobility are becoming increasingly common. Simultaneously, ESs are incorporated into the flow process by connecting SPAs and SBAs. Therefore, the sustainability of one region is not restricted to the local scale but is also closely related to the region's SPAs and ES flow process. Evaluating the regional sustainable development level by incorporating the ES flows can avoid unilateralism (Schröter et al 2018) and is conducive to balancing the ecological deficit, especially in an urban agglomeration. Simultaneously, ES flows and land use changes are highly interlinked. There exists competition and tradeoff between different ES in terms of land use patterns. In addition, interregional dependencies reflect the ES flow and make transregional ecological cooperation necessary. In this study, we analyzed the ES effect from the physical and value perspectives. The value flow is both the development opportunity cost of the SPAs and the receiving benefit of the SBAs. ES valuation provides an indispensable reference for stakeholder decision-making. To maintain the interregional development balance and guarantee the sustainable supply of ES, financial flows across regions occur and should be equal to the ES value flow (Boerema et al 2016), including PES and ecological engineering construction. Therefore, the ES flow can enhance understanding and promote the policy-making process in a more telecoupled world (Liu et al 2016).
Acknowledgments
This study was supported by the National Key Research and Development Program of China (2016YFC0503706 and 2016YFC0503403) and the Strategic Priority Research Program of Chinese Academy of Sciences (XDA20020402).