

Abstract
Aridity is a complex concept that ideally requires a comprehensive assessment of hydroclimatological and hydroecological variables to fully understand anticipated changes. A widely used (offline) impact model to assess projected changes in aridity is the aridity index (AI) (defined as the ratio of potential evaporation to precipitation), summarizing the aridity concept into a single number. Based on the AI, it was shown that aridity will generally increase under conditions of increased CO2 and associated global warming. However, assessing the same climate model output directly suggests a more nuanced response of aridity to global warming, raising the question if the AI provides a good representation of the complex nature of anticipated aridity changes. By systematically comparing projections of the AI against projections for various hydroclimatological and ecohydrological variables, we show that the AI generally provides a rather poor proxy for projected aridity conditions. Direct climate model output is shown to contradict signals of increasing aridity obtained from the AI in at least half of the global land area with robust change. We further show that part of this discrepancy can be related to the parameterization of potential evaporation. Especially the most commonly used potential evaporation model likely leads to an overestimation of future aridity due to incorrect assumptions under increasing atmospheric CO2. Our results show that AI-based approaches do not correctly communicate changes projected by the fully coupled climate models. The solution is to directly analyse the model outputs rather than use a separate offline impact model. We thus urge for a direct and joint assessment of climate model output when assessing future aridity changes rather than using simple index-based impact models that use climate model output as input and are potentially subject to significant biases.
Export citation and abstract BibTeX RIS

Original content from this work may be used under the terms of the Creative Commons Attribution 3.0 licence. Any further distribution of this work must maintain attribution to the author(s) and the title of the work, journal citation and DOI.
1. Introduction/motivation
The term 'aridity' originates from the Latin term 'arid', meaning 'dry, parched, barren'. This is reflected in common textbook definitions of aridity, defined as a lack of moisture ('dry') not able to promote and sustain life ('parched, barren', see also Greve et al 2017). The availability of moisture in a natural environment and at climatological time scales is thereby determined through the terrestrial water fluxes (precipitation P, evapotranspiration E and runoff Q), and variables, directly and indirectly, related to these fluxes, such as e.g., atmospheric and soil moisture, and the photosynthetic rate of plants. A comprehensive assessment of aridity changes thus needs to consider the wealth of variables shaping the common perception of a 'dry' landscape. This includes, but is not necessarily limited to, both hydroclimatological (e.g. P, Q) and agro-ecological drivers (e.g. soil moisture, vegetation cover and productivity, etc.).
Assessments of aridity changes under conditions of observed and projected global warming and increased levels of atmospheric CO2 are due to the complex and somewhat fuzzy definition of aridity are subject to an ongoing scientific debate. A wealth of studies have suggested that global aridity will increase over the 21st century (Dai 2011, 2013, Feng and Fu 2013, Sherwood and Fu 2014, Zhao and Dai 2015, Scheff and Frierson 2015, Huang et al 2016, Fu et al 2016, Lin et al 2018, Park et al 2018, Marvel et al 2019) due to the thermodynamic response of a warming atmosphere (Fu and Feng 2014, Sherwood and Fu 2014). The majority of these studies use simple models/indices as a proxy for aridity with the aridity index (AI) approach being the most widely used. Here we follow previous practice and define the AI as the ratio of potential evaporation to precipitation Ep/P (sometimes the inverse, denoted as the wetness index: P/Ep, is used). The AI summarises the aridity concept into a single number. It is simple and ideally represents the complex interplay of atmospheric and land surface processes that shape the terrestrial dryness. The AI has been found to almost ubiquitously project conditions of increasing aridity under global warming (Feng and Fu 2013, Scheff and Frierson 2015, Fu et al 2016, Lin et al 2018, Park et al 2018), leading to projections of widespread and accelerated dryland expansion (Huang et al 2016). The AI is further used by the United Nations Environment Programme (UNEP, Barrow 1992) to classify aridity—from hyperarid and arid to semi-arid (see also Roderick et al (2015) for a brief discussion). The AI-based framework builds the foundation for the majority of assessments on desertification under climate change—including the most recent version of the World Atlas of Desertification (Cherlet 2018)—projecting widespread and severe expansions of deserts and semi-arid landscapes. Aridity assessments based on the AI are also featured in various reports of the Intergovernmental Panel on Climate Change (IPCC), including the 5th Assessment Report (AR5, Stocker et al 2013) and the recent Special Report on Climate Change and Land (SRCCL, Mirzabaev 2019), highlighting both uncertainties in aridity projections but also pointing out various severe issues and impacts on natural and socio-economic systems related to potential increases in aridity/desertification.
Estimating aridity based on the AI largely depends on the parameterization of Ep. Since Ep represents a hypothetical flux, it must be modeled from either meteorological observations or climate model output. The most common parameterizations of Ep originate from various models aiming to estimate evaporation (or evapotranspiration) over open water or well-watered land surfaces and range from simplistic formulations requiring only limited input variables to sophisticated representations using multiple meteorological and land surface parameters. In the majority of recent studies assessing changes in the AI (Feng and Fu 2013, Scheff and Frierson 2015, Fu et al 2016, Huang et al 2016, Lin et al 2018, Park et al 2018), potential evaporation is modeled based on the rather sophisticated Penman–Monteith reference evaporation (hereafter PMref; Allen et al 1998). PMref was introduced as the standard method by the Food and Agriculture Organization (FAO) and has been widely used within the last two decades. The projected increase in PMref is substantial and primarily occurs due to an increase in vapor pressure deficit as a consequence of increasing temperatures and the nonlinear increase of saturation vapor pressure as a function of temperature (Clausius–Clayperon relationship) (Sherwood and Fu 2014, Scheff and Frierson 2014).
However, considering a distinct vegetation response to elevated CO2 as simulated in the fully-coupled climate models, it is important to point out that some of the assumptions that underlie the computation of PMref (and hence the AI) are incorrect under conditions of changing CO2 concentrations. A basic assumption in PMref is that the minimum surface resistance over a wet surface is fixed and is thus explicitly assumed to show no response to changing CO2. This assumption is ultimately not valid for vegetated surfaces as the minimum stomatal resistance—a measure representing the opposition of plants to the exchange of CO2 and water vapor with the surrounding air—is expected to increase with increasing CO2 (Field et al 1995, Roderick et al 2015, Milly and Dunne 2016, Swann et al 2016, Scheff et al 2017, Greve et al 2017, Scheff 2018, Swann 2018, Lemordant et al 2018, Yang et al 2019), while additionally also soil moisture feedbacks need to be considered (Seneviratne et al 2010, Berg et al 2016a, Swann et al 2016). Increases in the stomatal resistance are also expected to lead to an increase in the minimum surface resistance.
Assessments of the impact of using a potentially inaccurate parameterization of the fixed minimum surface resistance in PMref on projections of the AI are missing to date. By considering three alternative approaches that directly and indirectly account for increasing CO2 concentrations in the parameterization of Ep (Milly and Dunne 2016, Yang et al 2019), our first goal in this study is to investigate potential biases in aridity projections based on the AI calculated using PMref. Comparing projected estimates of AI based on different Ep models—some of them aiming to correct for changing CO2 concentrations—enables us to assess the impact of using PMref in predictions of future aridity based on the AI. We are further able to assess the sensitivity of aridity projections to the choice of Ep model. The obtained results will thus help to revisit and evaluate previous aridity assessments based on the AI using PMref (projecting widespread and substantial aridity increases) and highlight uncertainties related to different Ep parameterizations.
More generally, a single dimensionless metric such as the AI might also just barely represent the wealth of processes shaping a 'dry' landscape. Similar to the Köppen–Geiger climate classification, the AI potentially provides a sufficient geographical representation of what is usually perceived as arid. However, it is up to debate if projected changes in the AI under conditions of global warming and increasing atmospheric CO2 provide a good proxy for the complexity of processes driving changes in the mean dryness of the land surface. Hence, instead of using the AI as a secondary, offline impact model (and thereby using climate model output as input) providing a single number to represent the complex aridity concept, a growing number of recent publications have recommended the direct assessment of climate model outputs of relevant ecohydrological variables (Roderick et al 2015, Zhao and Dai 2015, Swann et al 2016, Scheff et al 2017, Greve et al 2017, Milly and Dunne 2017, Scheff 2018, Swann 2018, Lemordant et al 2018, Mankin et al 2018, Yang et al 2018, 2019). These studies show that, in comparison to the ubiquitous increase in projected aridity as shown by the AI, both increases and decreases in aridity occur in different regions worldwide for different variables. A variety of recent studies have also assessed vegetation changes, which are, based on the common definition of aridity, vital to obtain a comprehensive picture of future aridity. These studies show that climate models project a widespread greening under conditions of global warming and increased atmospheric CO2 (Roderick et al 2015, Swann et al 2016, Scheff et al 2017, Greve et al 2017, Scheff 2018, Swann 2018, Lemordant et al 2018, Mankin et al 2018, Yang et al 2019), a finding also supported by observations (Donohue et al 2009, de Jong et al 2011, Fensholt et al 2012, Donohue et al 2013, Zhu et al 2016).
The mixed hydroclimatological response and the widespread greening clearly contradict the overall increase of projected aridity in the AI. Hence, by systematically comparing AI projections (ideally representing aridity in terms of a single number) against projections for various hydroclimatological and ecohydrological variables, our second primary goal is to validate if the AI provides a robust proxy for projected aridity changes in general. This will help to evaluate the question if the AI, a single-numbered impact metric, is appropriate for the communication of projected aridity changes. The validation will hence support a more accurate and comprehensive interpretation of projected changes in aridity. This is especially important given the widespread use of the AI as an impact-relevant metric (for example in the context of desertification).
Thus, after introducing the different parameterizations of Ep and the climate data (Section 2), we will assess projected changes in aridity with respect to the sensitivity of AI projections to the choice of Ep model (section 3.1) and validate AI projections against direct hydro-ecological climate model outputs (section 3.2). We will further summarize and discuss the obtained results, also in the context of previous, impact-related assessments (section 4).
2. Data and methods
Here we aim to obtain a comprehensive picture of anticipated aridity changes as projected by the AI model by comparing in a first step the sensitivity of AI projections to the choice of four different Ep parameterization schemes. In a second step, the AI based on different Ep models is evaluated against both hydroclimatological and ecohydrological variables.
2.1. Climate data
In order to estimate the AI, a variety of meteorological variables is required. These are P and depending on the Ep model: surface net radiation (Rn), temperature, relative humidity and wind speed at 2 m, and atmospheric CO2 concentrations. We use data from the Coupled Model Intercomparison Project, Version 5 (CMIP5) ensemble (Taylor et al 2012). CMIP5 includes climate model projections forced by four representative concentration pathway (RCP) emissions scenarios (Moss et al 2010), corresponding to their relative top of the atmosphere radiative imbalances reached by the end of the 21st century with respect to the preindustrial period. Here we use the high-emission RCP8.5 scenario, consequently resulting in an imbalance of 8.5 W m−2 in the Earth's (top of the atmosphere) radiative budget by 2100. We use a set of 21 climate models (see table 1), each providing monthly data of the required variables within the time period from 1980 to 2100. The reference period is here defined from 1980 to 1999 by using historical simulations, whereas the future period is set to 2080–2099. All data are regridded to a common 2.5° × 2.5° grid.
Table 1. Overview of CMIP5 climate models. We use the following variables from the CMIP5 archive: pr (P), mrsos (uppermost 10 cm soil moisture), gpp (Gross Primary Productivity), and mrros (surface runoff, Q). Required to compute Ep are: hurs (near-surface relative humidity), rsds, rsus, rlds, and rlus (up- and downward long- and shortwave radiation components), sfcWind (surface wind speed), and tas (near-surface air temperature).
| Model | AI, P | Q | SM | GPP |
|---|---|---|---|---|
| ACCESS1-0 | x | x | x | |
| ACCESS1-3 | x | x | x | |
| CanESM2 | x | x | x | x |
| CNRM-CM5 | x | x | x | |
| CSIRO-Mk3-6-0 | x | x | x | |
| GFDL-CM3 | x | x | x | |
| GFDL-ESM2M | x | x | x | x |
| GISS-E2-H | x | x | x | |
| GISS-E2-R | x | x | x | x |
| HadGEM2-CC | x | x | x | |
| HadGEM2-ES | x | x | x | |
| INMCM4 | x | x | x | x |
| IPSL-CM5A-LR | x | x | x | x |
| IPSL-CM5A-MR | x | x | x | x |
| IPSL-CM5B-LR | x | x | x | x |
| MIROC5 | x | x | x | |
| MIROC-ESM | x | x | x | x |
| MIROC-ESM-CHEM | x | x | x | x |
| MRI-ESM1 | x | x | x | x |
| MRI-CGCM3 | x | x | x | |
| NorESM1-M | x | x | x | x |
The dimensionless aridity estimates obtained from the AI model are compared with simulated hydroclimatological (P and surface runoff, Q) and ecohydrological variables (surface soil moisture and gross primary productivity (GPP), see also Roderick et al (2015)) from the same climate models. All data estimates are computed within the same time periods and are regridded to the same common grid. Please note that the surface soil moisture here represents conditions within the uppermost 10 cm of the soil. We argue that a combined assessment of these variables provides a comprehensive (but not necessarily complete) picture of what is commonly perceived as arid. Please note that not all variables are provided by each model (see table 1 for more information on the available variables). It is also important to note that the associated uncertainties in the projected estimates of these variables are substantial. Hence, in the evaluation of the AI against the hydroecological variables, we only consider regions where the majority of models (16 out of 21) agree in sign. Further note that the ensemble of climate models is not weighted, even though several models are from the same modeling center.
2.2. Modeling potential evaporation
Ep is here parameterized based on four different methods:
2.2.1. Penman–Monteith reference evaporation (PMref)
This model is widely-used and recommended by the FAO as the standard method for reference evapotranspiration (FAO-56). It is defined by using a hypothetical crop as reference, assuming a standard plant height of 0.12 m, a fixed surface resistance of 70 sm−1 and an albedo of 0.23, thus ideally representing a surface of well-watered green grass (Allen et al 1998). These values were defined to avoid the need for local calibrations of the aerodynamic and stomatal resistances in the original Penman–Monteith equation, which differ depending on plant and crop type, plant characteristics, and season. To obtain and implement a standard set of resistance terms, bulk formulas have been applied by using the characteristics of the reference crop surface. This implies the use of fixed roughness lengths, a fixed leaf area index of 2.88 and a fixed stomatal resistance of 100 sm−1, resulting in an aerodynamic resistance of ra = 208/u2 (with u2 denoting wind speed at 2m (m s−1)) and a surface resistance of  . Ep is thus computed as follows:
with Rn denoting net radiation (herein MJ m−2 day−1), T mean daily air temperature at 2 m (degC), es − ea the saturation vapour pressure deficit (kPa), Δ the slope of the saturation vapor pressure curve with respect to temperature (kPa/degC), and γ the psychrometric constant (kPa/degC). The term (0.34u2) is finally obtained through the ratio rs/ra and represents the suggested reference crop surface. We further estimate es − ea by using relative humidity. PMref can thus be used and applied using standard meteorological output. The FAO further recommends use at daily to monthly time scales.
2.2.2. Corrected Penman–Monteith reference evaporation (cPMref)
After establishing a linear relationship between the surface resistance rs and changes in the atmospheric CO2 concentrations within a set of 16 CMIP5 models, Yang et al (2019) introduced a modified version of PMref accounting for changing CO2 levels. By assuming the original  under historical conditions of CO2 = 300 ppm, they were able to modify the resistance term in PMref depending on the obtained relationship between rs and the respective CO2 (units: ppm) levels as (0.34 + 0.00024[CO2 − 300]). Ep is thus computed as follows:
With an atmospheric CO2 concentration of CO2 = 300 ppm (representing atmospheric CO2 levels from the mid-20th century), the modified equation (2) and unmodified equation (1) versions are identical.
2.2.3. Net radiation based Ep
Considering the energy balance at the land surface, net radiation Rn provides the maximum estimate of energy available to both sensible and latent heat fluxes. The first method (hereon referred to as Rn80) builds on empirical evidence. Milly and Dunne (2016) found that PMref largely overpredicts changes in evaporation over well-watered surfaces in climate models. However, by using estimates of Rn as the energy constraint to evaporation, they found a reasonable empirical correspondence between wet surface evaporation and ca. 0.8Rn/λ, with λ denoting the latent heat of vaporization (and thus Rn/λ denoting the water equivalent of net radiation). Hence,

However, by further considering the inherent relationship between surface temperature and Rn, being directly coupled through outgoing longwave radiation, Yang and Roderick (2019) derived a new formulation (hereon referred to as Rnx) of the maximum evaporation over wet surfaces. This formulation provides the physical foundation to the empirical factor introduced by Milly and Dunne (2016) and can be written as follows:

3. Projected changes in aridity
Comparing projected estimates of AI based on different Ep models enables us to (i) assess the sensitivity of aridity projections to the choice of Ep model, (ii) evaluate the AI model against hydro-ecological climate model outputs in order to assess whether the AI model provides a good proxy for anticipated aridity changes, and (iii) to assess the impact of changing atmospheric CO2 concentrations on AI projections.
3.1. Sensitivity to different Ep models
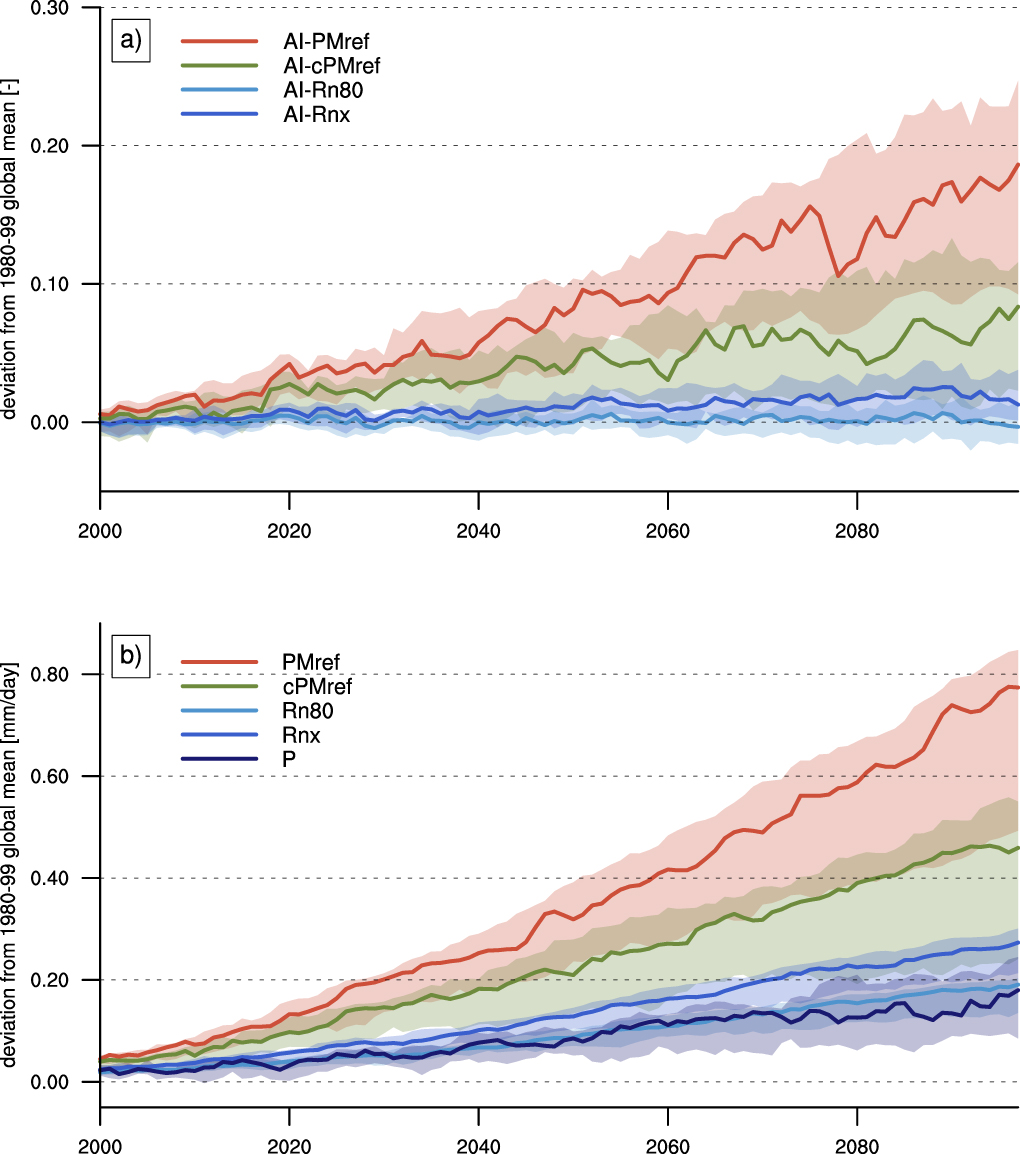
Using the PMref model, global mean AI is projected to substantially increase over the course of the 21st century (figure 1(a), supplementary figure 1 is available online at stacks.iop.org/ERL/14/124006/mmedia for a regional analysis). The increase is caused by a larger increase in modeled Ep in comparison to simulated P (figure 1(b)). As both Rn80 and Rnx increase at similar rates as P (while the increase in Rnx is, however, slightly larger), there is little change in aridity when estimating Ep through radiation-based models. By correcting PMref for increasing atmospheric CO2 levels, cPMref increases at a slower rate than PMref. However, the overall increase is still larger than changes in P, leading to an overall increase in AI ranging between the AI time series based on PMref and those time series based on the radiation-based models.

Figure 1. Yearly deviations from the 1980–99 global multi-model mean for (a) aridity index, and (b) P, Ep from 2000 to 2100. (a) AI time series are based on (red) PMref, (green) cPMref, (light blue) Rn80, and (darker blue) Rnx. (b) Ep time series are provided for (red) PMref, (green) cPMref, (light blue) Rn80, and (darker blue) Rnx. Time series of P are provided in black. Solid lines illustrate the multi-model median (21 models considered). The transparent, colored shading represents the respective multi-model interquartile range. A 5 yr running mean was applied to the time series.
Download figure:
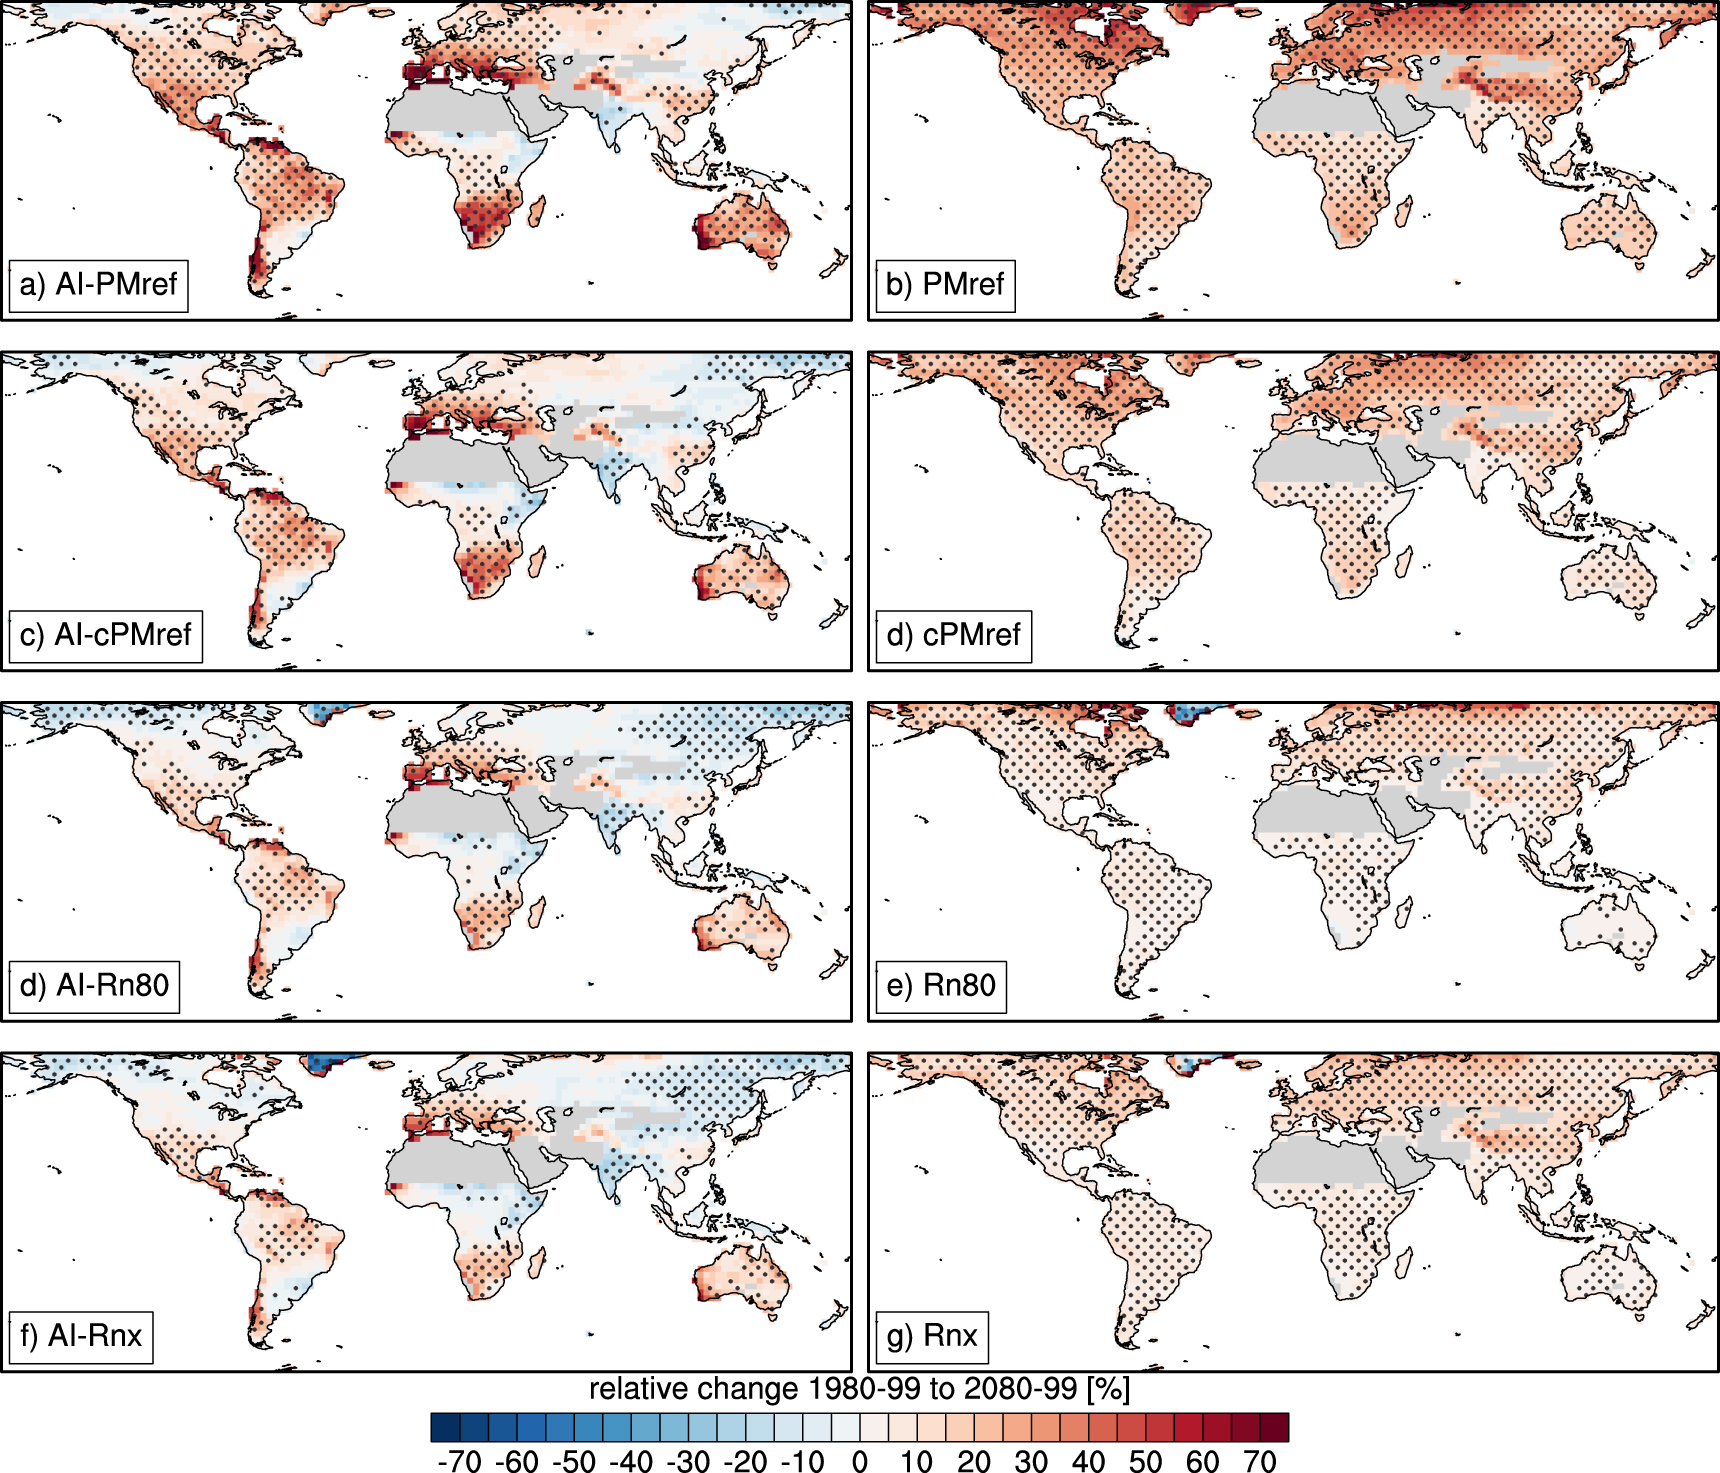
Standard image High-resolution imageEp increases in all parts of the world, while the magnitude of changes differs both regionally and between the individual Ep models. The multi-model median changes in Ep between 1980–99 and 2080–99, as illustrated in figure 2, show the strongest relative increases for PMref, especially in the northern high latitudes. Projected increases in the radiation-based AI estimates are robust, but substantially smaller. This results in stronger projected increases in AI when using PMref, showing large contiguous regions of robust and substantial aridity increases worldwide. This signal weakens when using cPMref and aridity changes are relatively mixed (showing regionally both increases and decreases) when using radiation-based Ep. There are, however, several regions (e.g. the Mediterranean region, southern Africa) where the AI is consistently increasing independent of the choice of Ep parameterization due to consistent and significant decreases in P.

Figure 2. Relative changes in the aridity index (left column) and Ep (right) using the four different methods. Illustrated is the ensemble median change between 1980–99 and 2080–99 under the RCP8.5 emission scenario. Stippling denotes regions where at least 75% of all climate models agree in sign. Grey colors mask regions with ensemble-mean annual rainfall below 100 mm. Please note that based on the definition of the aridity index used here, an increase (decrease) in the index also denotes an increase (decrease) in aridity.
Download figure:
Standard image High-resolution imageA more detailed illustration of differences between PMref and the other Ep models is provided in figure 3. In comparison to the projected relative changes in cPMref, changes in PMref are higher by ca. 10%. Such overestimations in PMref are even more pronounced in comparison to the radiation-based estimates, especially for large projected changes in PMref (thus also showing significant conditional biases). Hence, increases in the AI are generally about 20%–30% smaller when using Rnx and especially Rn80, compared to PMref.

Figure 3. Relative changes (1980–99 to 2080–99) in the aridity index based on PMref against relative changes in the aridity index based on (a) cPMref, (b) Rn80, and (c) Rnx at each grid point. Colored lines illustrate the respective regression lines.
Download figure:
Standard image High-resolution imageOur analysis thus shows that projected increases in AI are especially pronounced when using PMref, whereas such changes are both substantially smaller and regionally more variant for AI based on the radiation-based Ep models. cPMref further clearly reduces the general increases in AI in comparison to the uncorrected PMref model, while projected increase in aridity are, however, still substantial and regionally more pronounced compared to changes in the radiation-based AI.
3.2. Is the AI model a good proxy for anticipated aridity changes?
The AI is an impact model ideally providing a reasonable proxy for the historical, current and projected ecohydrological state of the land surface with respect to long-term dryness in terms of a single, dimensionless number. Regarding projected AI, an evaluation against several ecohydrological variables can provide a useful assessment of the predictive quality of AI under conditions of global warming and increasing atmospheric CO2 concentrations. These variables should represent both estimates of land surface water availability, such as P and Q, and estimates representing soil water and vegetation characteristics, such as soil moisture and e.g. GPP, which is here used as an indicator of changing vegetation activity.
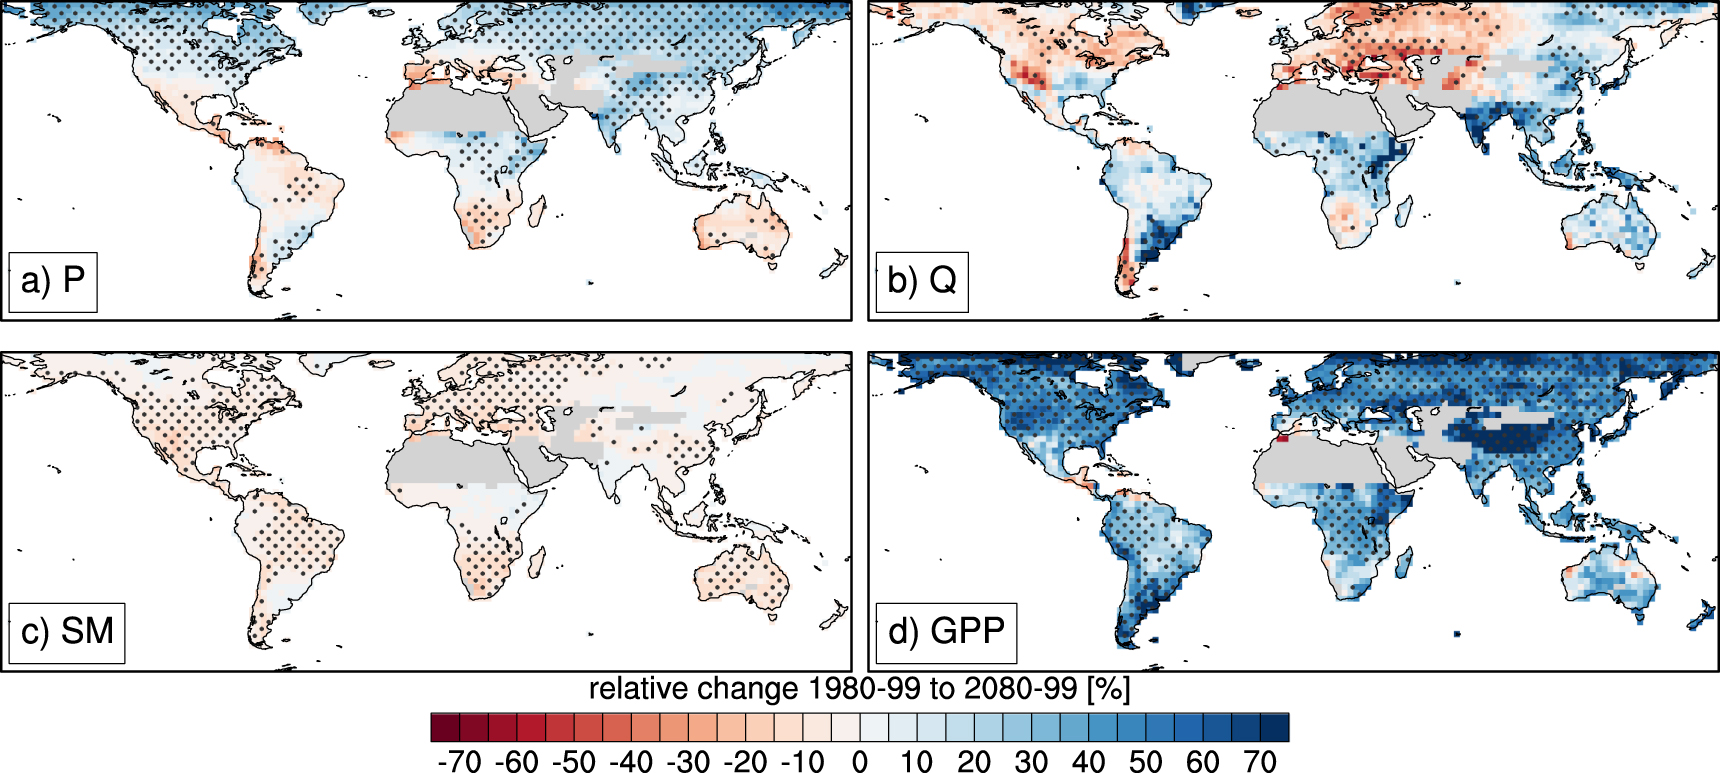
The multi-model median changes in P, Q, surface soil moisture, and GPP between 1980–99 to 2080–99 are illustrated in figure 4. Compared to the respective changes in AI as illustrated in figure 2, regional increases in P, Q and especially ubiquitous increases in GPP contradict the widespread increasing aridity as projected by AI-PMref in many regions, especially in parts of tropical Africa and East Asia. Apart from decreasing Q (albeit not robust in many regions), changes in P and GPP indicate decreasing aridity in the northern high latitudes of North America, Central, and Northern Europe and Asia, whereas Q is also increasing in parts of Australia. In these regions, AI-PMref and to a lesser extent also AI-cPMref, clearly project an overall increase in aridity, thereby contradicting the hydro-ecological response as projected by the fully-coupled climate models. However, the widespread signal of slight decreases in surface soil moisture partly supports the AI-PMref projections. A better correspondence between projections of AI and the variety of variables shown in figure 4 is indeed found for radiation-based estimates of AI.

Figure 4. Relative changes in hydroclimatological and agro-ecological variables related to aridity. Illustrated is the ensemble median change between 1980–99 and 2080–99 under the RCP8.5 emission scenario for (a) P, (b) Q, (c) surface soil moisture (SM), and (d) GPP. Stippling denotes regions where at least 75% of all climate models agree in sign. Grey colors mask regions with ensemble-mean annual rainfall below 100 mm.
Download figure:
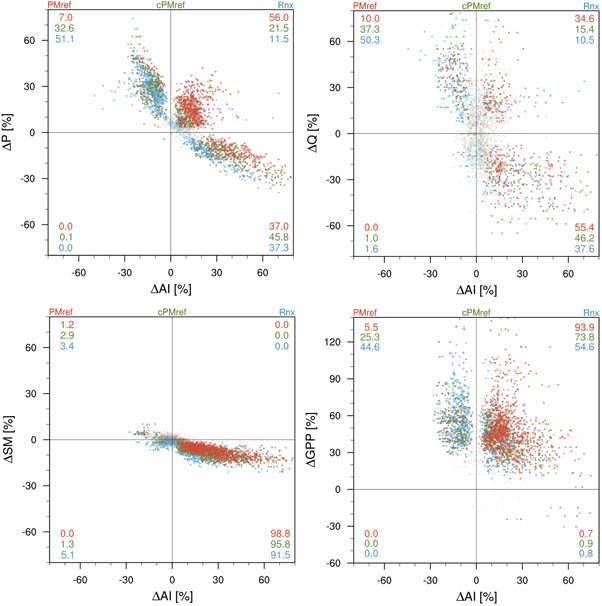
Standard image High-resolution imageA more detailed evaluation of projected relative changes in AI based on AI-PMref, AI-cPMref, and AI-Rnx against relative changes in the four hydroclimatological and ecohydrological variables is provided in figure 5. P (Q) shows robust signals of decreasing aridity in more than 50% (30%) of the land area where robust increases in AI-PMref are projected. Regarding GPP, such increases are found in more than 90% of all grid boxes showing increasing AI-PMref. For P and Q, these percentage numbers are at least halved when using cPMref and even further reduced when using radiation-based estimates of Ep. Such reductions are also substantial for GPP, despite being not as large. Projections of decreasing aridity for the radiation-based estimates and AI-cPMref also correspond better to projected increases in P, Q, and GPP (i.e. also pointing towards decreasing aridity). It can thus be concluded that in only about 44% (65%) of all land area with robust changes (16 out of 21 models agree in sign), aridity increases and decreases in AI-PMref and P (Q) correspond. This correspondence is, however, substantially larger (almost 90%) between AI-Rnx and P, Q and almost no correspondence is found between GPP and AI-PMref. However, the AI largely represents projected changes in surface soil moisture independent from the choice of the Ep model, i.e. increases in projected AI almost entirely correspond to regions of decreasing surface soil moisture. Similar to Ep models, surface soil moisture is sensitive to a projected drying of near surface atmospheric conditions and potentially overestimates potential decreases in soil water availability, especially with respect to deeper soil layers that are also more relevant to plants (Berg et al 2016b).
Figure 5. Relative changes in aridity (1980–99 to 2080–99) based on three different aridity index models against relative changes in P, Q, surface soil moisture and GPP at each grid point (due to Rn80 and Rnx being very similar, we only show Rnx for clearer illustration). The colors highlight different Ep parameterizations: PMref (red), cPMref (green), and Rnx (blue). Darker, opaque colors indicate robust changes in both variables (more than 75% of climate models agree in sign), whereas light, transparent colors indicate less robust changes (less than 75% of climate models agree in sign). Colored numbers in each corner denote the percentage of global land area showing robust changes within the particular sector (text colors correspond to those of the Ep parameterizations).
Download figure:
Standard image High-resolution image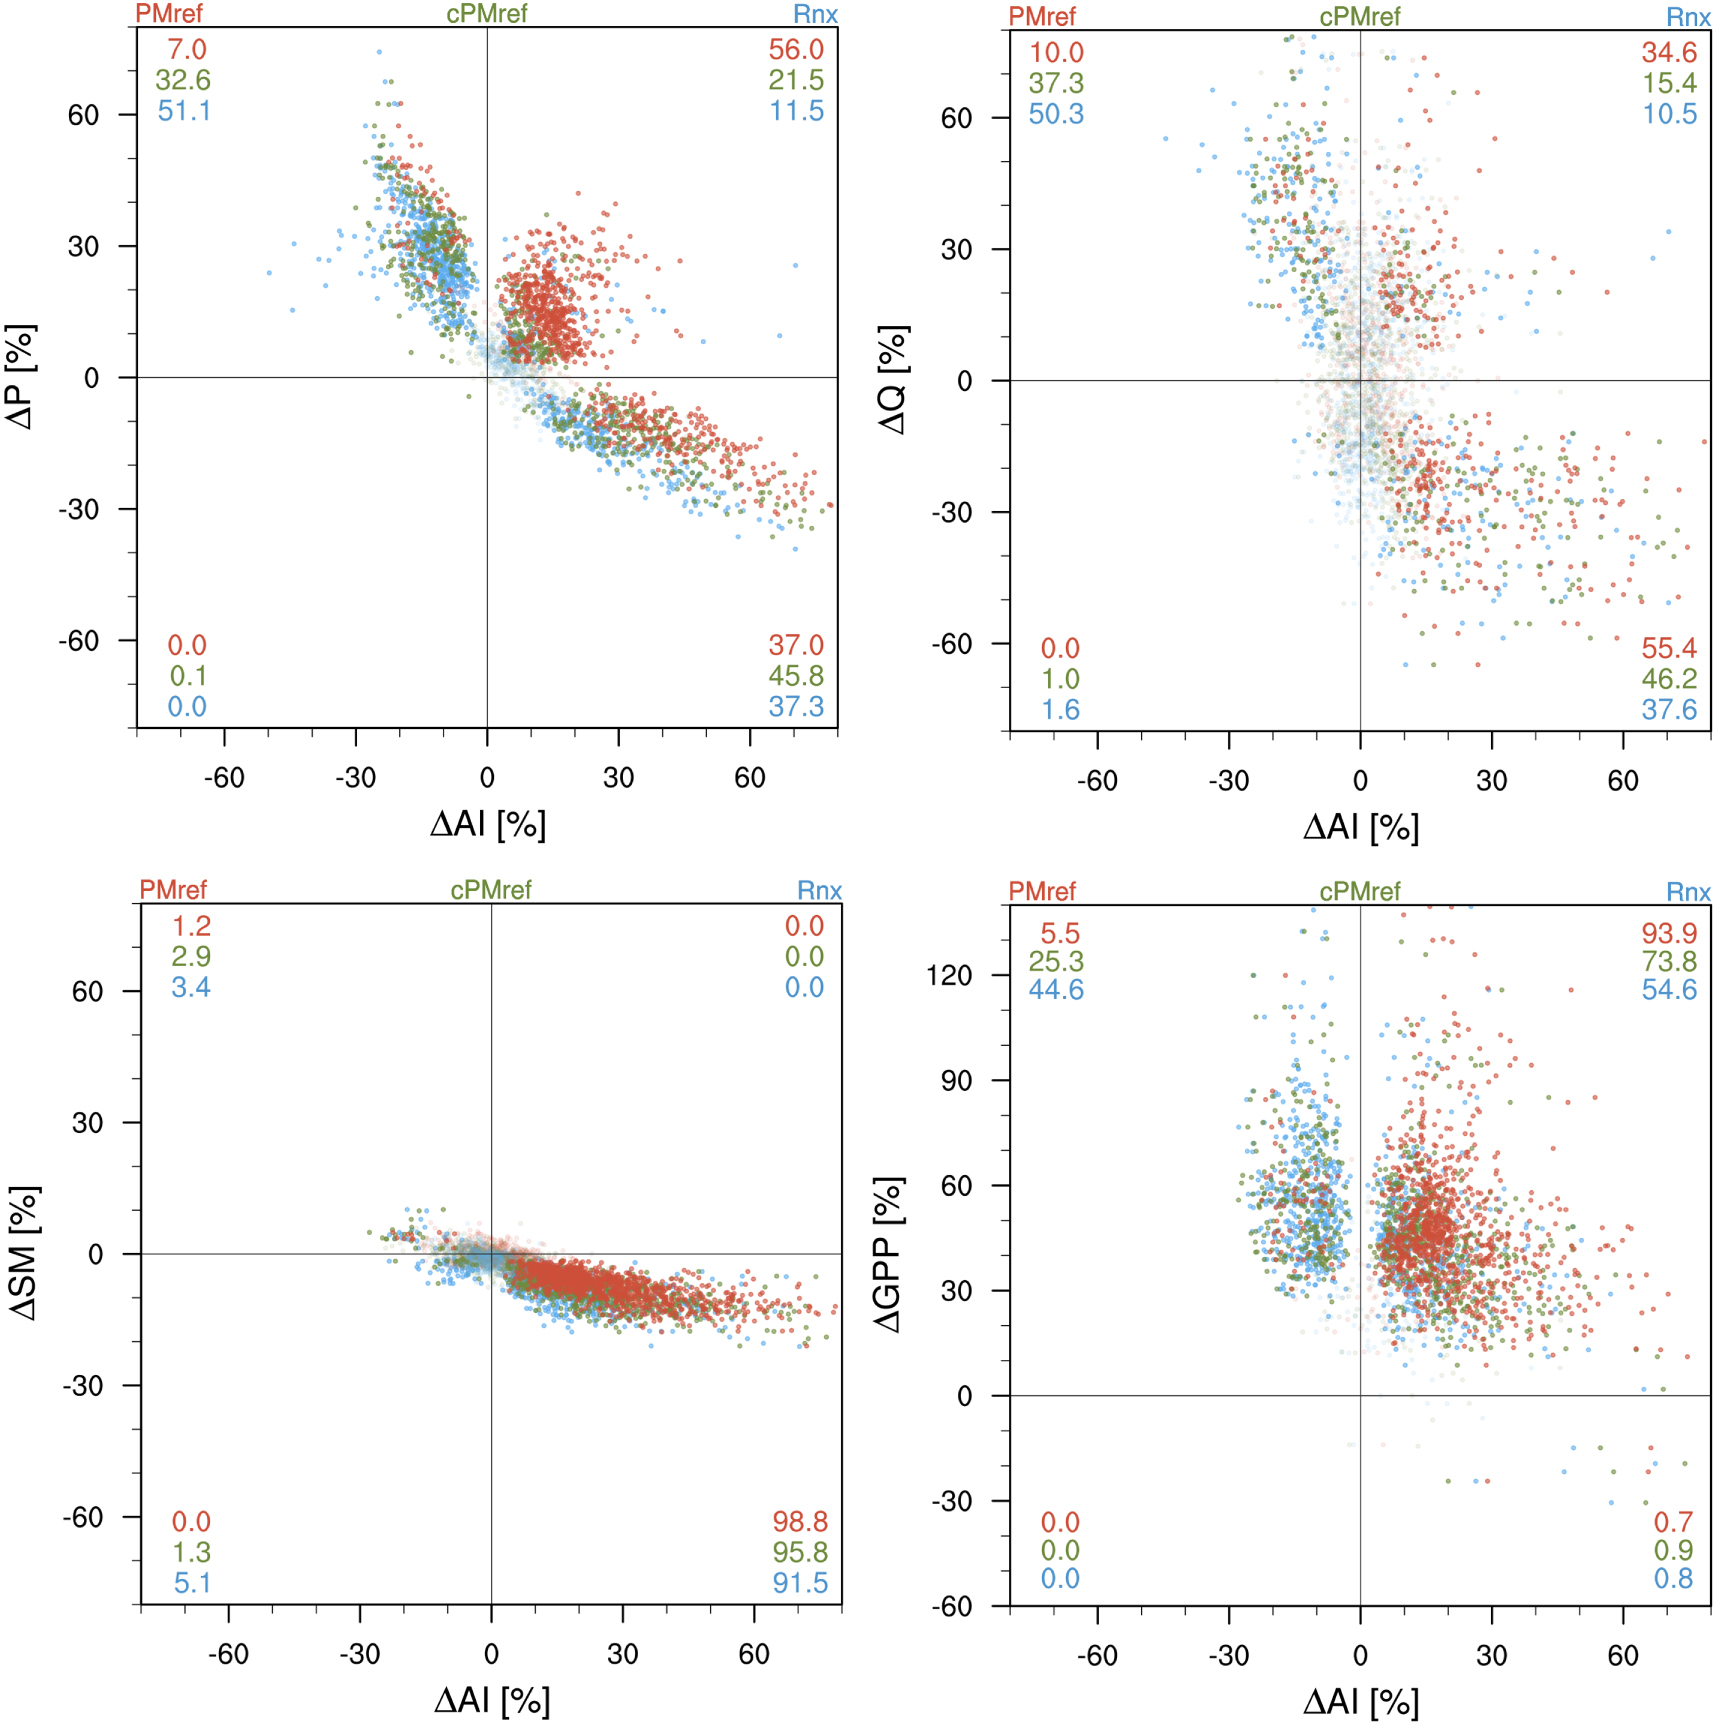
4. Discussion and concluding remarks
Aridity is a complex concept that requires a comprehensive assessment of hydroclimatological and hydro-ecological variables to fully understand anticipated changes. However, it was shown here that the AI, that is widely used to assess anticipated aridity changes, does provide a rather poor proxy for the projected future hydro-ecological characteristics of the land surface. We found that, when using PMref as the most common approach to parameterizing the AI, direct climate model outputs contradict signals of increasing aridity obtained from the AI model in at least half of the global land area with robust changes. This result especially corresponds to recent findings regarding the 'aridity paradox' (Roderick et al 2015, Greve et al 2017, Scheff et al 2017), showing that the climate model response to global warming under conditions of increasing atmospheric CO2 concentrations does not imply a general drying and aridity increase. We further show that the overall performance of the AI model with respect to climate model output can be substantially improved when using radiation-based estimates of Ep or after correcting PMref for increasing atmospheric CO2 concentrations. As Rn is direct output of the fully-coupled climate models (which simulate effects of increasing atmospheric CO2), radiation-based estimates of Ep potentially better account for impacts of changing CO2 levels on the hydro-ecological conditions at the land surface. In combination with the AI projections based on cPMref, providing results that more consistently follow the climate model projections in comparison to PMref based estimates, this provides confidence to the hypothesis that at least part of the 'aridity paradox' could be related to biased projected changes in PMref (Milly and Dunne 2016, Yang et al 2019).
Even though it is clearly evident from our results that PMref based assessment are likely biased, we do not necessarily intend to advocate the use of other Ep parameterizations, especially as they are not needed since the direct model output contains all the information necessary to characterise aridity. Our main intention is indeed to highlight that the AI in itself might not be sufficient to represent a complex concept such as aridity in general.
Nonetheless, changes in the AI models do largely correspond to projected decreases in surface soil moisture (whereas changes in total soil moisture might contradict these trends, see Berg et al 2016b). The AI further highlights several hotspots (such as the Mediterranean region, and South Africa) where robust aridity increases are projected across all considered metrics. However, the AI does not provide a robust proxy for changes in hydroclimatological variables in general and shows almost no skill regarding GPP. This is not a surprise since changes in atmospheric CO2 break the existing correlation between hydrology and ecology by changing the water use efficiency of photosynthesis (Sherwood 1997, Roderick et al 2015).
Our results confirm the hypothesis that projected changes based on AI-PMref overestimate future aridity compared to direct climate model outputs due to incorrect assumptions under increasing atmospheric CO2. However, it needs to be mentioned that climate models are also subject to various sources of uncertainty. Especially assessments of hydroclimatological changes show substantial uncertainties and inconclusive evidence in many parts of the world as the relevant variables and fluxes are highly integrated (see e.g. Greve and Seneviratne 2015). Further, hydro-ecological assessments potentially suffer from various uncertainties related to vegetation modeling under future climatic and land surface conditions. Especially, the ubiquitous increase of GPP projected in the climate models could be overestimated due to nutrient constraints (Hungate et al 2003, Penuelas et al 2011, Piao et al 2013), and changes in seasonal (Murray-Tortarolo et al 2016) and climatic extremes (Reichstein et al 2013). Nonetheless, it is our assessment that the realization of future aridity conditions is more reliable in fully-coupled, physically consistent climate simulations in comparison to results obtained from secondary, offline impact models using the same climate model output as input. Our results indeed confirm that the AI substantially overestimates future aridity conditions when compared to the original climate model outputs.
We stress the importance of cautiously considering the potential biases in all research assessing aridity in terms of the AI based on PMref. This will likely also apply to other offline impact models using PMref, ranging from more simple models and indices, such as e.g. the Palmer drought severity index to more sophisticated, state-of-the-art integrated assessment models including e.g. global hydrological and vegetation models. However, how biases in PMref translate into biases in the output of these particular impact models needs to be quantified individually.
Neither the AI nor other single metrics and/or variables are able to fully represent the complexity underlying the aridity concept and the potential overestimation of aridity based on the AI has implications for various impact assessments using the index. This is first and foremost related to desertification and future dryland expansion. The AI based on PMref (as suggested by the UNEP and the FAO) usually serves as the most commonly used tool to assess future changes in these quantities. Given the severe potential impacts—including water scarcity, land degradation, and substantial landscape and land-use changes—and the extensive actions needed to adapt to the anticipated future desertification, it is vital to provide reliable estimates of projected future conditions to the affected public, stakeholders and decision-makers. Based on our results, we have shown that the AI-based approaches do not correctly communicate changes projected by the fully coupled climate models. The solution is to directly analyse the model outputs rather than use a separate offline impact model. The general notion pointing towards overall drier conditions across the globe, arising from assessments based on the AI and as stated not just in a wealth of research studies within the last decade, but also within various synthesis reports such as the IPCC AR5 and the recent SRCCL, might further be at least partly misleading. The potential impacts of climate change and increasing CO2 concerning the terrestrial water cycle are instead more diverse, posing other severe challenges to future water adaptation management and planning. A more direct communication of climate model output rather than using simple index-based impact model results is thus more useful to address the upcoming challenges—also in the context of inherent associated uncertainties (Greve et al 2018). In conclusion, and also as suggested in previous studies (Roderick et al 2015, Greve et al 2017, Milly and Dunne 2017, Scheff et al 2017), we urge once more for a direct assessment of climate model output when assessing future aridity changes rather than using simple index-based impact models that use climate model output as input and are potentially subject to significant biases.
Acknowledgements
This study is financially supported by from EUCP (European Climate Prediction System) project funded by the European Union under Horizon2020 (Grant Agreement: 776613). We thank the anonymous reviewers for providing helpful and constructive feedback.
Data availability statement
The CMIP datasets used in the study are openly available through the Earth System Grid Federation (ESGF): https://esgf-node.llnl.gov/projects/esgf-llnl/.