

Abstract
Millions of people in South Asia face water scarcity every year. Previous studies based on the multi-model ensemble mean reported a decline in dryness (the ratio of potential evapotranspiration and precipitation) in South Asia under the warming climate. However, using observations and simulations from skilful climate models (BEST-GCMs) that simulate the critical monsoon features and show less bias to simulate observed climate, we show that dryness has significantly increased over the Gangetic Plain and parts of Pakistan during 1951–2016. Moreover, a rise in global mean temperature of 1.5 °C from the pre-industrial level will result in an increased dryness over half of South Asia affecting more than 790(±336) million people. Population affected by dryness is projected to 890 (±485) and 1960 (±1033) million under 2.0° and 2.5° warming worlds, respectively. Previously reported reduced aridity under the warming climate based on multi-model ensemble is mainly due to the GCMs that have less skill to simulate monsoon features. The GCMs with less skill project a higher increase (∼25%) in the monsoon season precipitation, which is largely due to their higher sensitivity of convective precipitation to warming. We show that the risk of water scarcity and dryness in South Asia under warming climate is higher than previously reported.
Export citation and abstract BibTeX RIS

Original content from this work may be used under the terms of the Creative Commons Attribution 3.0 licence. Any further distribution of this work must maintain attribution to the author(s) and the title of the work, journal citation and DOI.
Corrections were made to this article on 28 January 2020. Figure 3 was amended to make the different formats of the article consistent.
1. Introduction
South Asia is likely to face challenges associated with water availability and food production due to increased dryness index (Ramarao et al 2019) and climate change (Lobell et al 2008, Immerzeel et al 2010). The warming climate in South Asia is projected to result in increased potential evapotranspiration (PET), which is supply (precipitation) independent measure of evapotranspiration (Scheff and Frierson 2014), loss of glaciers (Bolch et al 2012), and a decline in agricultural production (Rosenzweig et al 2013). The drying estimated using Palmer Drought Severity Index (PDSI) has increased in Africa and South Asia during 1950–2008 (Dai 2011). Moreover, Ramarao et al (2019) reported that the dryness index (PET/P) has increased over India in response to the warming climate during 1951–2005. Understanding of changes in dryness in the future is vital for planning and management of water resources and food security for millions of people living in South Asia. However, projections of precipitation in the future climate remain uncertain in South Asia (Turner and Annamalai 2012, Mathison et al 2015, Sharmila et al 2015, Vinke et al 2017) primarily due to lack of skill in global climate models (GCMs) to simulate the summer monsoon precipitation.
To provide reliable future projections of precipitation and potential evapotranspiration in South Asia, a careful evaluation of CMIP5-GCMs is required. Recent studies (Chen and Zhou 2015, Sabeerali et al 2015) reported that the ensemble mean projections of the monsoon precipitation in South Asia are not reliable. Most of the CMIP5-GCMs show a large bias against observed precipitation and temperature. In addition, the majority of GCMs fail to capture the observed variability and trends of Indian summer monsoon rainfall during the post-1950 (Saha et al 2014), which covers a large part of South Asia. Xavier et al (2007) and Sabeerali et al (2015) found that the strength of Indian summer monsoon is strongly linked with upper tropospheric temperature, which is a large scale thermodynamic driver. Moreover, CMIP5-GCMs simulate inconsistent upper tropospheric temperature gradient (Sabeerali et al 2015) of the South Asia monsoon region and project an increase in the precipitation with weakening upper tropospheric temperature. As reported in the previous studies (Menon et al 2013, Sabeerali et al 2015), a majority of the CMIP5-GCMs show a dry bias, and only a few of them capture the observed declining trend in precipitation (Saha et al 2014, Ashfaq et al 2017). Therefore, future projections of dryness change over South Asia based on multi-model ensemble (Scheff and Frierson 2015, Huang et al 2016, Park et al 2018) need to be re-evaluated. The selection of GCMs that show a reasonable skill (better performance) in simulating the monsoon dynamics and land-atmospheric process (Ashfaq et al 2017) over South Asia is crucial.
The observed and projected changes in dryness over South Asia received less attention notwithstanding the importance of projected changes in water availability (Turner and Annamalai 2012, Mathison et al 2015, Sharmila et al 2015, Vinke et al 2017). Here, we use observations and simulations from 32 CMIP5-GCMs to identify the changes in area and population exposed to increased dryness under the 1.5 °C, 2.0 °C, and 2.5 °C warmer worlds from the pre-industrial level. We mainly address the following questions: to what extent do the projections of dryness from the ensemble mean and better performing GCMs (BEST-GCMs hereafter) differ over South Asia? And if the projected increase in area and population exposed by increased dryness index in South Asia under 2.0° and 2.5° warmer worlds are considerably different than 1.5 °C temperature rise from the pre-industrial level? To address the first question, we use all (32, ALL-GCMs hereafter) and the BEST-GCMs as identified in Ashfaq et al (2017). We address the second question using population projections from shared socio-economic pathways (SSP) and simulations from CMIP-GCMs. Moreover, to analyse the physical reasons of why most of the GCMs are showing inconsistent projection in the warming climate, we use convective precipitation from CMIP5-GCMs.
2. Data and methods
2.1. Observed and model data
We use observed monthly precipitation (P), maximum temperature (Tmax), minimum temperature (Tmin), and potential evapotranspiration (PET) from climate research unit (CRU TS4.01, http://data.ceda.ac.uk//badc/cru/data/cru_ts/cru_ts_4.01/data/) (Harris et al 2014). We then analyse dryness index (ratio of PET and P: PET/P) (Budyko 1974) over South Asia (figure S1 is available online at stacks.iop.org/ERL/14/114021/mmedia) during the 1951–2016 period at 0.5° spatial resolution. PET from CRU is based on monthly observed gridded temperature, vapor pressure, and cloud cover and is estimated using the Penman–Monteith method (Penman 1948, Monteith 1965).
We use CMIP5 simulations (Taylor et al 2012) from 32 GCMs (table S1) for r1i1p1 initial condition for the historical (1861–2005) and future (2006–2100) periods. We obtain monthly precipitation, surface air temperature, convective precipitation, wind speed, specific humidity, surface pressure, latent heat flux, and sensible heat flux from CMIP5-GCMs, which are then regridded to 1°. Energy budget variables (latent and sensible heat fluxes) are required to estimate PET. To understand the changes in convective and large-scale precipitation under the warming climate, we use convective and total precipitation from GCMs. We compare the regridded variables to their native resolution and find that both the datasets are consistent spatially and temporally (figure S2). We use data for two representative concentration pathways (RCP 4.5 and RCP 8.5), which are available for all the variables from 32 GCMs except convective precipitation that is available only for 26 GCMs.
The Paris agreement aims to limit the global mean temperature below 2 °C and more ambitiously below 1.5 °C from the pre-industrial level by the end of 21st century (King et al 2017). However, Raftery et al (2017) reported that likely range of global temperature rise is 2.0 °C–4.9 °C by the end of 21st century. Moreover, they (Raftery et al 2017) found that there is only 5% chance that global mean temperature rise, as targeted in the Paris agreement, will be less than 2.0 °C. We, therefore, select an additional scenario of 2.5 °C, which is essentially 1.0 °C overshoot from the 1.5 °C temperature target. We define the time period (in decades) of 1.5°, 2.0°, and 2.5°C warming worlds using global mean temperature for each GCM. We then identify the decades with global mean temperature change in the range of 1.3 °C–1.7 °C, 1.8 °C–2.2 °C, and 2.3 °C–2.7 °C from the pre-industrial (1861–1890) to represent 1.5 °C, 2.0 °C, and 2.5 °C warming worlds, respectively as described in King et al (2017). We use the 1971–2000 period as a reference period to represent the current climate and to compare the changes (from the current climate) in PET and dryness index under the 1.5 °C, 2.0 °C, and 2.5 °C warming worlds. We use two RCPs (4.5 and 8.5) to increase the number of decades with 1.5 °C, 2.0 °C, and 2.5 °C warming, which is essential for estimation of robust changes in warming as explained in King et al (2017). We could not use the other two RCPs (2.6 and 6.0) as data are not available for all the GCMs.
We aim to identify if the projections of dryness over South Asia from the BEST-GCMs differ multi-model ensemble mean of ALL-GCMs. We use the BEST-GCMs identified in Ashfaq et al (2017) who evaluated over 50 GCMs for the monsoon dynamics [meridional tropospheric gradient (MTG) and vertical easterly shear of zonal winds at 200 mb (U-shear)], annual precipitation and temperature, the onset of the monsoon, and pre-monsoon land-atmosphere process (heat and moisture transport) over South Asia using observed and reanalysis data. The evaluation of GCMs in Ashfaq et al (2017) is based on both spatial as well as area-averaged matrices. For instance, the performance of GCMs for annual precipitation and temperature cycles were evaluated using the area-averaged values while the onset of summer monsoon was evaluated for each grid. Ashfaq et al (2017) used 25% bias in precipitation, 2 °C bias in temperature, 1 °C bias in MTG, and 5 m s−1 bias in U-shear as the thresholds to identify better performing GCMs. Moreover, the onset of the monsoon should be correct over more than 60% of the land grids. They (Ashfaq et al 2017) reported that most of the GCMs are unable to capture the key features of the summer monsoon precipitation, temperature, and associated intra-seasonal variability. For instance, most of the GCMs are unable to capture the monsoon onset timing, MTG, U-Shear, and show a large dry and warm bias (Ashfaq et al, 2017). After a detailed evaluation, Ashfaq et al (2017) identified eight GCMs that show relatively better performance for the South Asian monsoon. Our selection of the BEST-GCMs is based on Ashfaq et al (2017, see table 2 in Ashfaq et al 2017 for more details). Out of total 32 GCMs (table S1), we use six (BNU-ESM, CESM1-CAM5, MIROC-ESM-CHEM, GFDL-ESM2M, MPI-ESM-LR, and NorESM1-M) GCMs as BEST-GCMs that show a reasonable skill as reported in Ashfaq et al (2017). We could not use two GCMs (bcc-csm1–1 m and CMCC-CESM) as all the variables required for our analysis are not available.
We estimate the changes in the observed PET (Penman–Monteith method) and dryness Index using the non-parametric Mann–Kendall test (Mann 1945, Kendall 1975) and Sen's slope method (Sen 1968) for the period 1951–2016. As PET estimates for the projected future climate show uncertainty (Kingston et al 2009, Sheffield et al 2012, Trenberth et al 2014), we use ensemble mean PET (to reduce the method-specific uncertainty) from the three different methods namely energy-budget based method (Milly and Dunne 2016), Hargreaves-Samani (Hargreaves) method (Hargreaves and Samani 1985), and Penman–Monteith method (Penman 1948, Monteith 1965). Previous studies (Kingston et al 2009, Trenberth et al 2014, Valipour et al 2017) have compared different methods for PET estimation and reported that Penman–Monteith and Hargreaves are the most reliable PET methods in the changing climate. Penman–Monteith and Hargreaves methods are widely used for estimating PET (McKenney and Rosenberg 1993, Vangelis et al 2013, Yuan and Quiring 2014, Valipour et al 2017). PET based on Hargreaves and Samani (1985) is estimated as:

where Ra is the extra-terrestrial radiation, Tmax is daily maximum temperature, Tmin is daily minimum temperature, and T is daily mean temperature.
Penman–Monteith method considers a larger number of variables (radiation, humidity, temperature, surface pressure, and wind-speed) to estimate the PET. The Food and Agricultural Organization (FAO) defines the Penman–Monteith equation as:
where Rn is net radiation at the surface, G is ground heat flux, Δ is the slope of the vapor pressure curve, u is wind speed at 2 m, D is vapor pressure deficit, and γ is psychometric constant.
However, Milly and Dunne (2016) reported an overestimation in PET using Penman–Monteith method under the future climate due to the reduction of stomatal conductance, which is attributed to the increase of CO2 emission (Roderick et al 2015). They (Milly and Dunne 2016) suggested PET estimates based on energy budget as :

where Rn and G are net radiation at the surface and ground heat flux. To calculate the Rn−G, Milly and Dunne (2016) used the energy balance as: Rn−G = LvE + H, where LvE is latent heat flux and H is sensible heat flux.
Using ensemble mean annual PET and annual precipitation (P) from each GCMs, we estimate the dryness Index (DI = PET/P) for each GCM. Then, change in the dryness index (equation (4)) is estimated with respect to the current climate (1971–2000) for the 1.5 °C, 2.0 °C, and 2.5 °C warming worlds for each GCMs.
Change (%) in the dryness index is defined as:

where DIwarm is the mean dryness index value under the warming climate (for decades representing the rise of 1.5 °C or 2.0 °C or 2.5 °C from the pre-industrial level) and DIref is the mean dryness index during the current climate (1971–2000). Then, we estimate ensemble mean change (%) in the dryness index in the BEST-GCMs and in ALL-GCMs.
To estimate the potential impact of dryness on the population over South Asia, we obtain gridded population data (http://cger.nies.go.jp/gcp/population-and-gdp.html) for shared socioeconomic pathway (SSP) at 0.5 ° (Murakami and Yamagata 2019), which is aggregated to 1° for our analysis. Here, we use SSP-1, SSP-2, and SSP-3 scenarios and linked them with the 1.5 °C, 2.0 °C, and 2.5 °C warming levels, respectively. According to the Paris agreement, we assume that 1.5 °C, 2.0 °C, and 2.5 °C temperature change at the end of the 21st century with respect to pre-industrial and consider the exposure of population at the end of the 21st century. The SSP scenarios assume different population growth and migration rate in under-developed, developed, and developing countries (KC and Lutz 2017). For instance, SSP-3 indicates the high mitigation and adaptation risk scenario for climate change research (O'Neill et al 2014). Recently, Mishra et al (2017) used SSP scenarios to project population exposure to heatwave.
3. Results
3.1. Changes in dryness during the observed period (1951–2016)
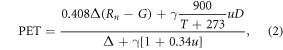
First, we estimate observed changes in dryness index (PET/P), annual PET, precipitation (P), and temperature in South Asia for 1951–2016 (figure 1). Dryness index has significantly (p-value < 0.05) increased (in magnitude) over the Gangetic plain (GP, India) and southwest Pakistan, which is in agreement with previous studies (Huang et al 2016, Ramarao et al 2019). Dryness in South Asia is mainly driven by the changes in precipitation (figure 1(c)). Changes in mean annual precipitation (P) and dryness index for 1951–2016 are consistent, showing an increase in precipitation and decrease in dryness over north Pakistan and western India (figures 1(a) and (c)).
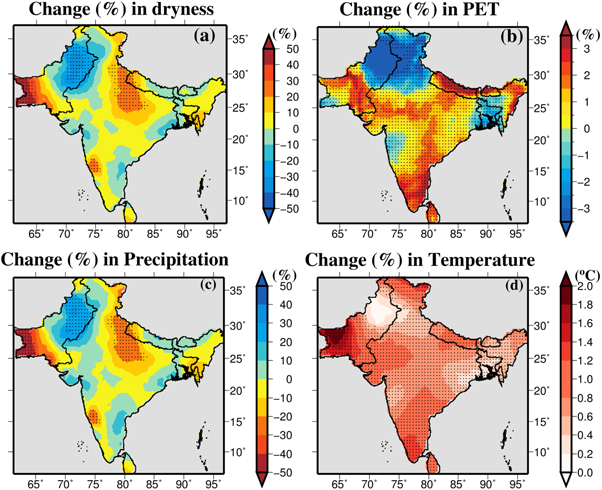
Figure 1. Observed changes (%) in dryness index, potential evapotranspiration (PET), Precipitation, and Temperature during 1951–2016. (a) Changes (%) in dryness index, (b) changes (%) in annual PET, (c) changes (%) in annual precipitation, and (d) changes (%) in annual mean temperature during the observational record of 1951–2016 based on the Climate Research Unit (CRU) data. Changes [trend slope X duration] in (a)–(d) were estimated using non-parametric Mann–Kendall test and Sen's slope method. Stippling in (a)–(d) shows statistically significant changes at 5% significance level.
Download figure:
Standard image High-resolution imageA significant (p-value <0.05) warming of 0.8 °C has occurred in South Asia during the observed record of 1951–2016 (figure 1(d)). Consistent with the previous studies based on the observations (Mishra et al 2012, Roxy et al 2015, Shah and Mishra 2016), we find a significant (p-value <0.05) decline in mean annual precipitation over many regions (Gangetic plains, central India, West Pakistan). PET has increased over a large part of South Asia (figure 1(b)) except the northern region.
3.2. Projected changes in dryness under 1.5°, 2.0°, and 2.5° warming worlds
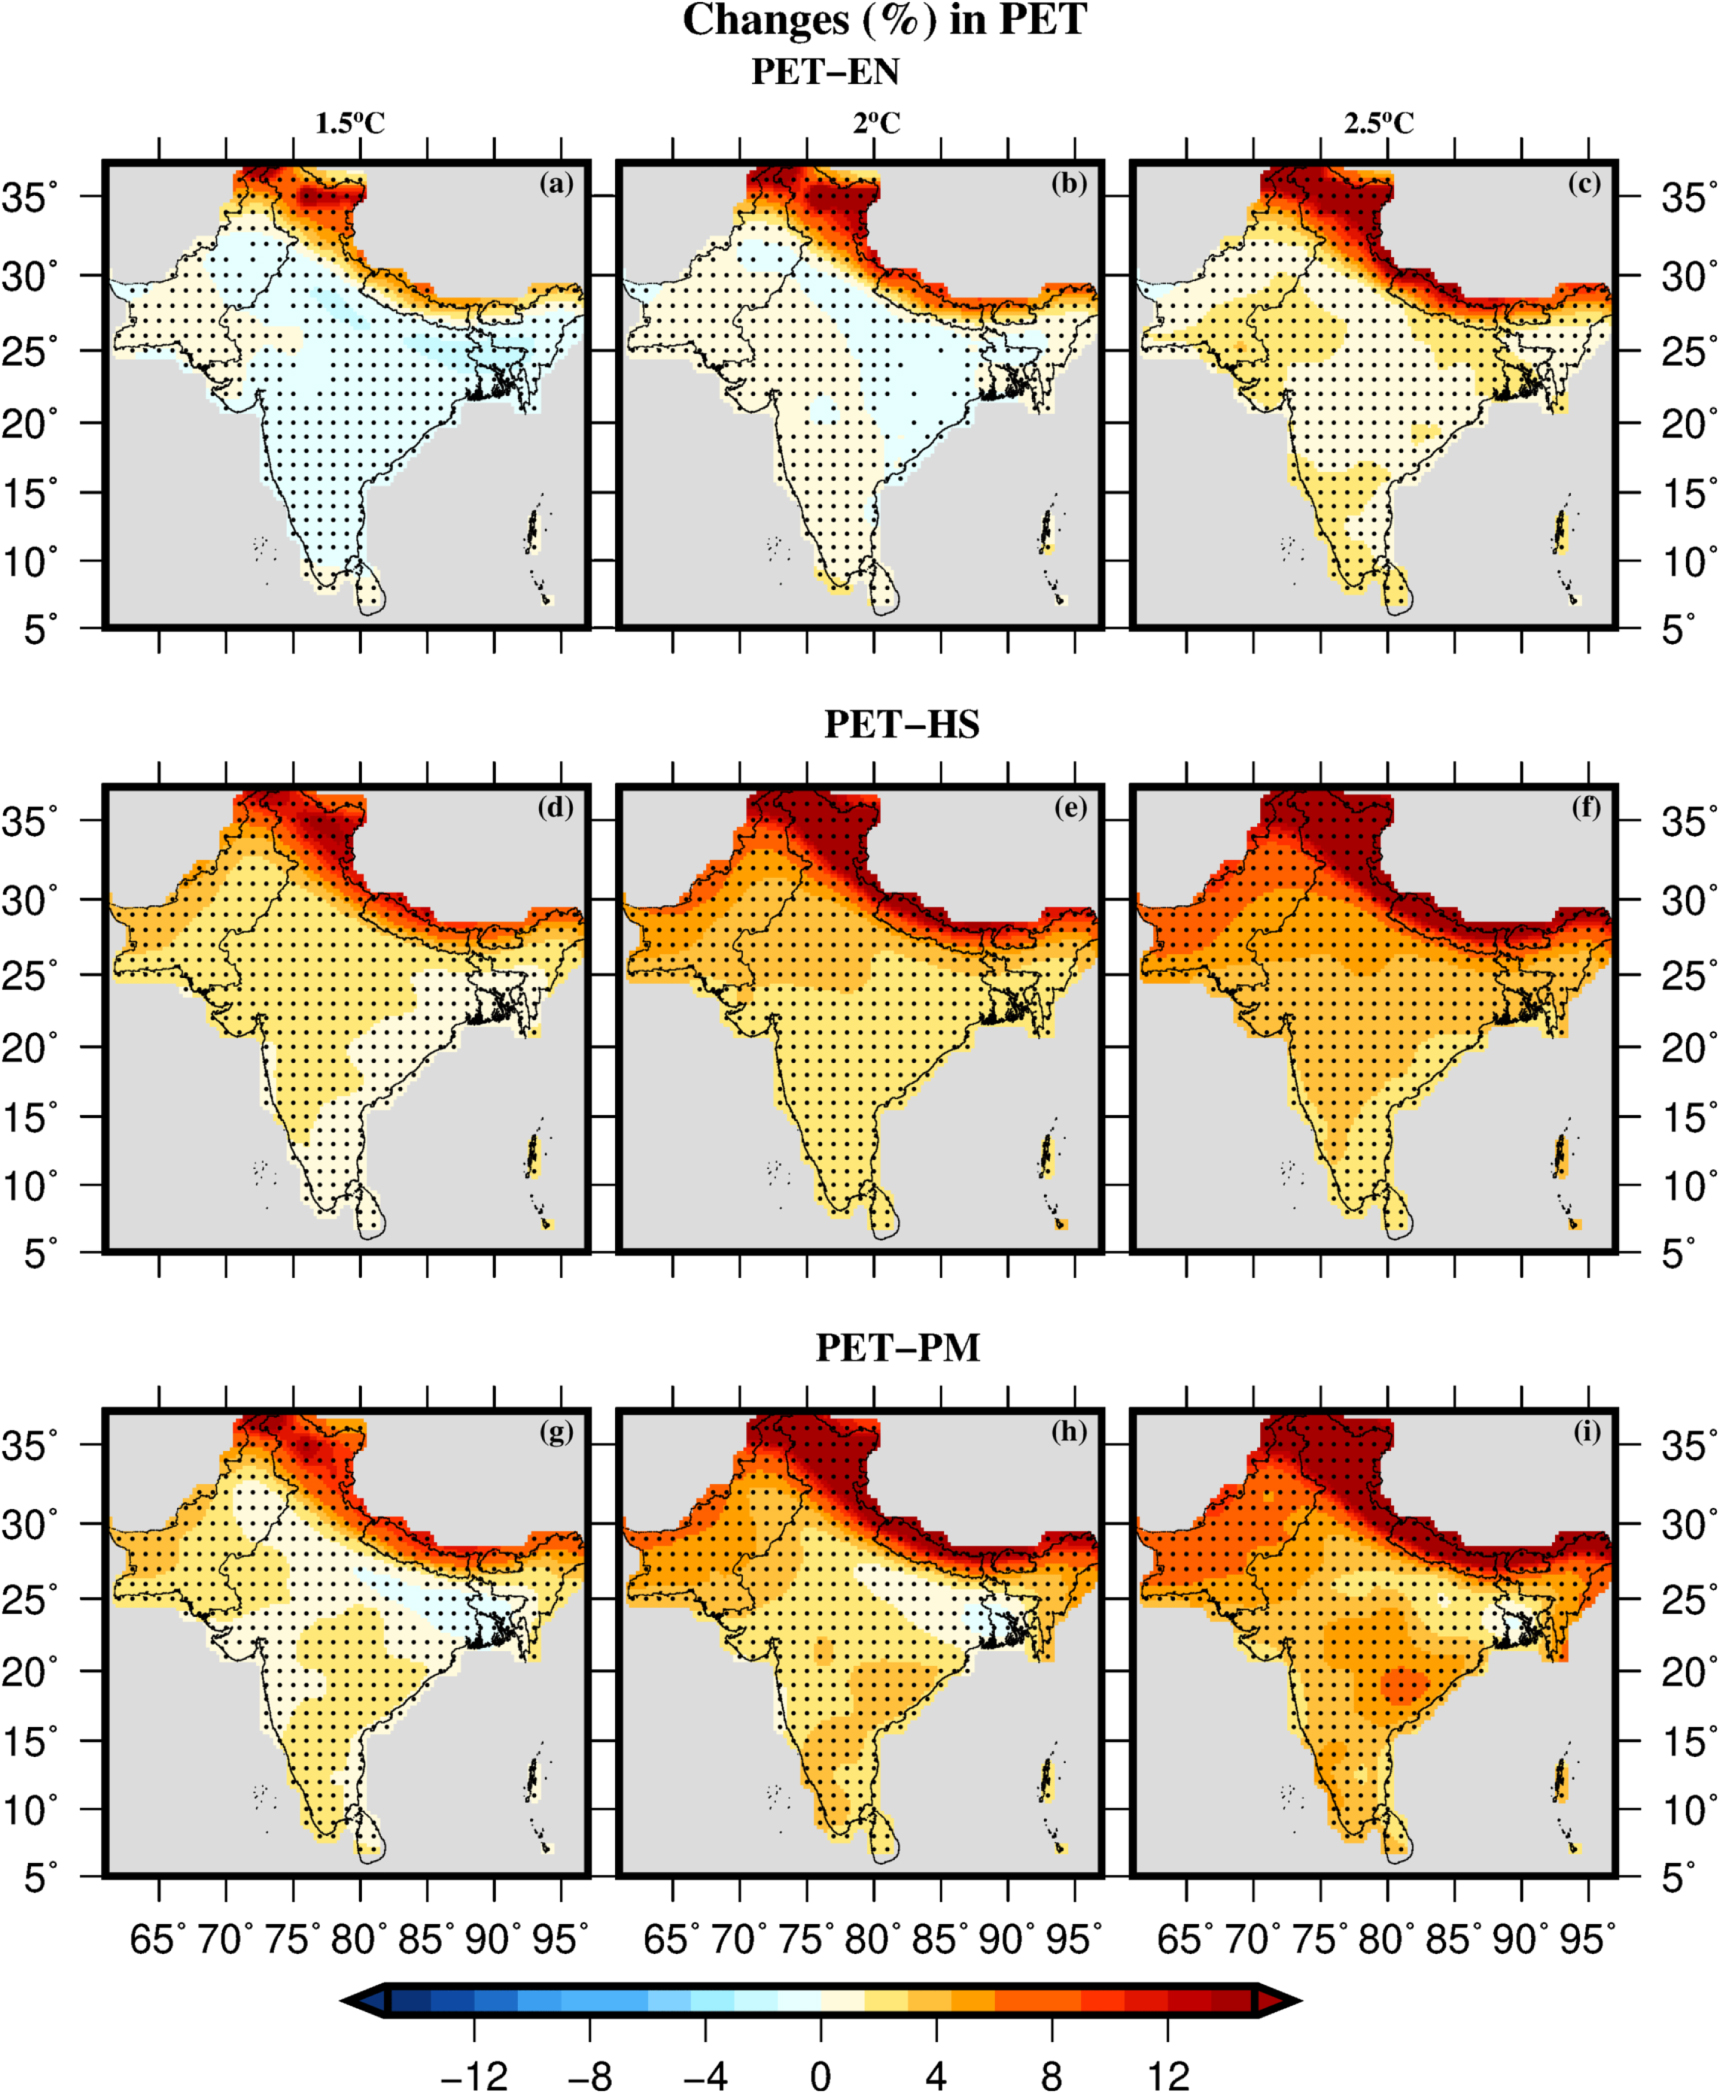
We find that even the BEST-GCMs do not satisfactorily capture the observed changes in PET and dryness in South Asia during 1951–2016, however these have significantly less bias in precipitation and temperature (figure S3, table S4 and table S5). On the other hand, ensemble mean changes from ALL-GCMs show a larger over or underestimation during 1951–2016 (figure S4, table S4 and table S5). Apart from the differences in PET and dryness estimates associated with GCMs, PET methods also contribute to uncertainty. Using the three PET methods (Energy, Hargreaves, and Penman–Monteith), we estimate the ensemble mean changes (%) in PET for ALL-GCMs (figure 2). The energy based PET shows a lesser increase under the warming climate in comparison to the other two methods (Hargreaves and Penman–Monteith methods). Moreover, PET estimates based on Hargreaves and Penman–Monteith methods project the similar changes in the PET in 1.5°, 2.0°, and 2.5° warming world (figure 2). These differences in the projections of PET from different methods translate to uncertainty in the projection of dryness (figure S5 and figure S6). Therefore, to reduce the method specific uncertainty in the PET estimation, we use ensemble mean of all the three PET methods.

Figure 2. Projected changes (%) in PET using three different methods under 1.5 °C, 2.0 °C, and 2.5 °C warming worlds Ensemble mean projected changes (%) in annual PET in 1.5 °, 2.0°, and 2.5 ° warming world from energy method (top), PM method (middle), and Hargreaves method (bottom) using ALL-GCMs in South Asia. Changes are estimated with respect to the current climate (1971–2000) using ALL (32) CMIP5-GCMs. Stippling shows more than 50% GCMs agree on the same sign of change.
Download figure:
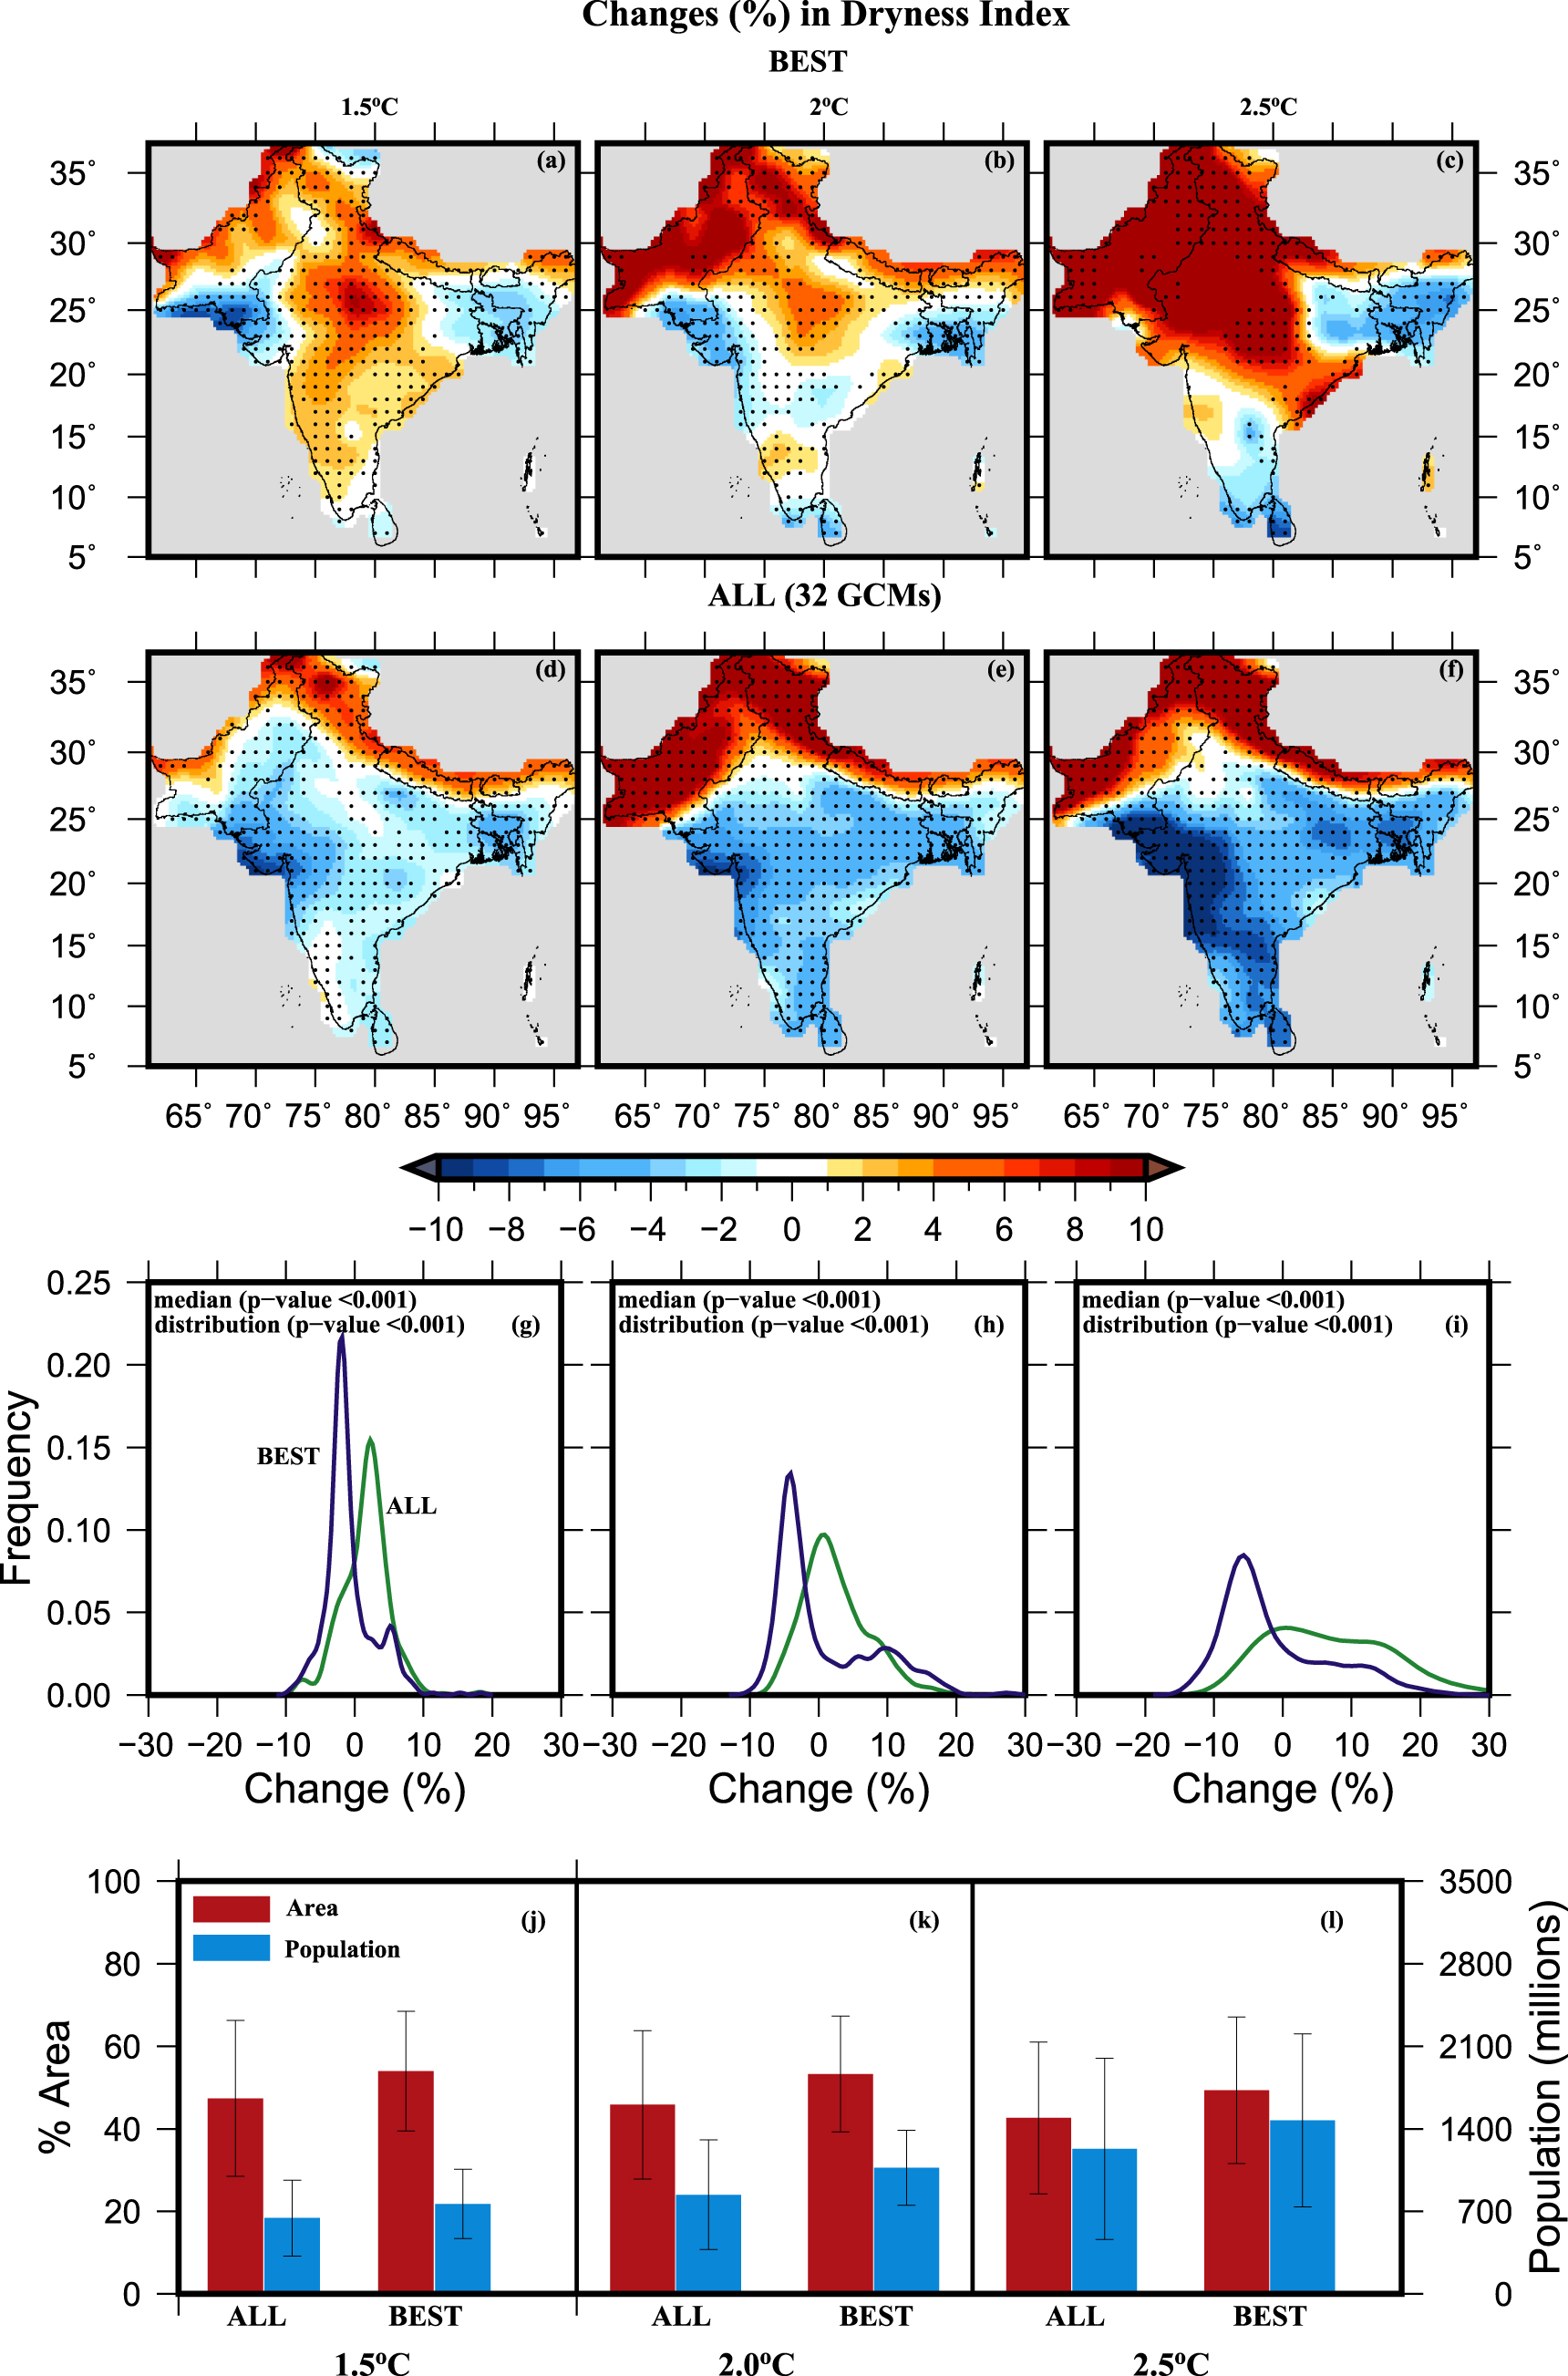
Standard image High-resolution imageNext, we estimate changes in PET and dryness index in South Asia under the 1.5°, 2.0°, and 2.5° warming worlds (figure 3 and figure S7). Dryness is projected to increase in western, northern, and southern parts of South Asia under 1.5º warming world (figure 3(a)). Under the 2.0 °C warming (an additional 0.5° warming above 1.5° warming world), dryness is projected to increase over Northern part of South Asia and projected to decline in Southern regions of South Asia (figure 3(b)). Failing to keep the warming below 2.0º from the pre-industrial, dryness is projected to increase substantially in the central, northern, and west South Asia and projected to decline over East India (figure 3(c)). However, the multi-model ensemble of ALL-GCMs shows a decline in dryness in the majority of South Asia (except North India and Pakistan) under the warming climate (3(d)–(f)). The projections of changes in dryness from the BEST-GCMs are significantly (p-value < 0.05) different from the ensemble mean of ALL-GCMS in South Asia (figures 3(g)–(f)). Our results show that the dryness projections based on the multi-model ensemble mean in previous studies (Schewe et al 2014, Scheff and Frierson 2015, Huang et al 2016, 2017, Park et al 2018) underestimate the risk of increased dryness in one of the most populated regions of the world.

Figure 3. Projected changes in dryness index and affected population in South Asia under 1.5 °C, 2.0 °C, and 2.5 °C warming worlds. (a)–(c) Ensemble mean projected changes (%) from BEST-GCMs in dryness index in South Asia for 1.5 °C, 2.0 °C, and 2.5 °C rise in global mean temperature from the pre-industrial level. Changes (%) in (a)–(c) were estimated against the current climate of 1971–2000. (d)–(f) Same as (a)–(c) but for ALL-GCMs, respectively. (g)–(i) Empirical probability distribution of changes (%) in dryness index for BEST GCMs (in green) and ALL-GCMs (in blue) in South Asia under 1.5 °C, 2.0 °C, and 2.5 °C warming. (j) Area (%, in red) and population (millions, in cyan) affected by increased dryness index in South Asia under 1.5 °C warming world from ALL-GCMs and BEST-GCMs, and ((k) and (l)) same as (j) but for 2.0 °C and 2.5 °C warming worlds. Error bars in (j)–(l) show inter-model variation (estimated using one standard deviation) in area and population using the ALL and BEST-GCMs. Stippling in (a)–(f) shows more than 50% GCMs agree on the same sign of change.
Download figure:
Standard image High-resolution imageWe estimate area and population affected (using gridded population data at the end of 21st century for the study region under SSP1, SSP2, and SSP3, figure S8) by the increased dryness index (∆DI > 0) under the warming climate in South Asia (figures 3(j)–(l)). Here, we use SSP-1, SSP-2, and SSP-3 scenario for 1.5°, 2.0°, and 2.5° warming, respectively. We note that projected population rise is the highest under SSP-3 and lowest under SSP-1 at the end of 21st century (figure S8). Moreover, in all the three SSPs, population is projected to rise more in the foot hill of Himalayas and in the coastal regions of South Asia (figure S8). A rise in global mean temperature of 1.5 °C from the pre-industrial level is projected to result in an increased dryness in 54.4 (±18)% area of South Asia (figure 3(j)). More than 790 (±336) million people (SSP-1) will be affected by the increased dryness in South Asia under the 1.5 °C warmer world (figure 3(j)). Under the 2.0 °C warming world, change in the dryness is projected to increase predominantly in northern parts of South Asia (figure 3, table S2, and table S3). We find a moderate decline (14% compared to 1.5 °C) in the area affected by dryness under the 2.0°C warming in the southern part of South Asia, which is attributable to the projected increase in precipitation in the region (figure 4). However, this additional 0.5°C warming (above 1.5 °C) will expose more people to the increased dryness due to the rise in population under SSP-2 scenario (figure S8 and table S2). About 890 (±485) million people (SSP-2) will be affected by the increased dryness in South Asia under 2.0 °C warmer world. Moreover, if we fail to limit the global mean temperature below 1.5 °C or 2.0 °C from the pre-industrial level, as aimed under the Paris agreement, 58.60 (±22.4)% area of South Asia will be affected under the 2.5 °C warmer world. This additional warming of 1.0 °C above the 1.5 °C temperature will result in exposing more than 1960 (±1033) million people (SSP-3) in South Asia, which is due to increase in the population under SSP3 and area under increased dryness (table S2 and figure 3).
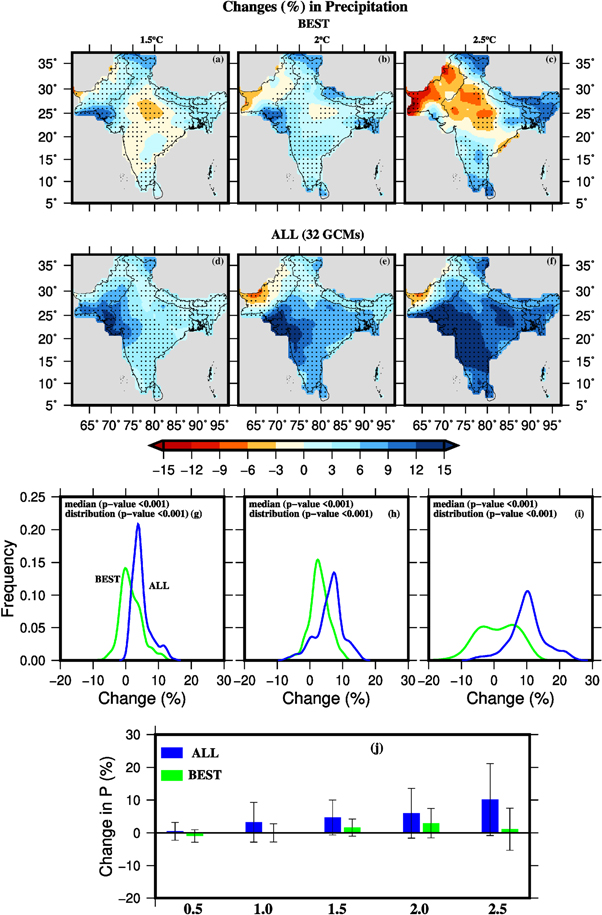
Figure 4. Ensemble mean projected changes in precipitation under 1.5 °C, 2.0 °C, and 2.5 °C warming world. (a)–(c) Changes (%) in the precipitation using the BEST-GCMs under the 1.5°, 2.0°, and 2.5° warming worlds with respect to the current climate (1971–2000). (d)–(f ) Same as (a)–(c) but for the ALL-GCMs. (g)–(i) Empirical probability distribution of changes (%) in the precipitation for BEST GCMs (in green) and ALL-GCMs (in blue) in South Asia under 1.5 °C, 2.0 °C, and 2.5 °C warming. (j) Area averaged change (%) in convective precipitation for the different levels (0.5 °C–2.5 °C) of warming. Error bars in (j) show inter-model variation (estimated using standard deviation) in the ALL and BEST-GCMs. Stippling in (a)–(f) shows more than 50% GCMs agree on the same sign of change.
Download figure:
Standard image High-resolution imageThe multi-model ensemble mean from ALL-GCMs shows a decline in dryness index over the majority of South Asia under the 1.5 °C, 2.0 °C, and 2.5 °C warming world (figures 3(d)–(f)). We note that the difference between ALL-GCMs and BEST-GCMs for the dryness projections increases with the warming in the northern, western, and central region (figures 3(d)–(f)). Northern, Western, and central regions are projected to become drier with the warming in BEST-GCMs while these regions are likely to become wetter with the warming in ALL-GCMs, which shows the increasing importance of the selection of skilful GCMs. Moreover, the projections of area and population affected by dryness under the 1.5 °C, 2.0 °C, and 2.5 °C warming worlds based on the ALL-GCMs show a lesser increase in comparison to the BEST-GCMs (figures 3(j)–(l)).
3.3. Dryness projections in the BEST-GCMs and ALL-GCMs under warming climate
We diagnose the potential causes of the previously reported (Schewe et al 2014, Scheff and Frierson 2015, Huang et al 2016, 2017, Park et al 2018) decline in the dryness over South Asia. To do so, we evaluate projected changes in supply (P) and demand (PET) of water under the warming climate (figure 4, and figure S7). The projected increase in the water supply (P) under the 1.5 °C, 2.0 °C and 2.5 °C warming worlds in South Asia will not be able to meet increased demands (PET) causing an increase in the dryness. We find that PET is projected to increase across South Asia under the warming climate (figure S7) with a more prominent increase in the northern Himalayan region compared to the other regions. Mean annual PET over South Asia is projected to increase by about 2%, 3%, and 4.4% in BEST-GCMs under the 1.5 °C, 2.0 °C, and 2.5 °C warming worlds, respectively (figure S7). Mean annual precipitation averaged over South Asia is projected to rise by about 1.6%, 3.0%, and 1.0% in the BEST GCMs under the 1.5 °C, 2.0 °C, and 2.5 °C warming worlds, respectively (figure 4). Therefore, the warming climate is projected to result in a higher increase in water demand than supply causing an increased dryness over South Asia.
Projections based on multi-model ensemble of ALL-GCMs show that mean annual PET is projected to increase by about 1.3%, 2.4%, and 3.8% while mean annual precipitation is projected to rise by about 5%, 6%, and 10% under 1.5 °C, 2.0 °C, and 2.5 °C warming worlds, respectively (figure 4 and S7). We note that the projections of PET based on the multi-model ensemble mean of ALL-GCMs and BEST-GCMs are similar (slightly higher in the BEST-GCMs) for all the three warming levels. However, the projected increase in precipitation from ALL-GCMs (5%, 6%, and 10%) is significantly (p-value < 0.05) higher than that of the BEST-GCMs (1.6%, 3.0%, and 1.0%). Therefore, the projected decline in dryness in ALL-GCMs is largely due to a higher increase in precipitation.
Next, we identify potential causes of differences in precipitation projections in ALL-GCMs and BEST-GCMs under the warming climate. To do so, we analyse projected changes in convective and stratiform (large-scale) precipitation under the warming climate (figure 5 and S8; table S4 and S5). The convective precipitation increases more rapidly in a few GCMs (>10%) in comparison to the BEST-GCMs (less than 5%) in response to 1° rise in temperature (if the global mean temperature rises to 1.0° from the pre-industrial level) (table S4 and S5). GCMs that show higher sensitivity of convection precipitation to warming also display poor performance in simulating the monsoon dynamics (Ashfaq et al 2017). A majority of the GCMs that have a high sensitivity of convective precipitation show a large dry bias in the monsoon season and annual precipitation and warm bias in the temperature (tables S4 and S5). The BEST-GCMs project a decline in the convective precipitation in the future in a few regions of South Asia (figure 5) while ALL-GCMs project an increase in the convective precipitation under the warming climate.
Figure 5. Ensemble mean changes (%) in the convective precipitation under the 1.5°, 2.0°, and 2.5° warming worlds. (a)–(c) Changes (%) in the convective precipitation using the BEST-GCMs under the 1.5°, 2.0°, and 2.5° warming worlds with respect to the current climate (1971–2000). (d)–(f) Same as (a)–(c) but for the ALL-GCMs. (g)–(i) Empirical probability distribution of changes (%) in the convective precipitation for BEST GCMs (in green) and ALL-GCMs (in blue) in South Asia under 1.5 °C, 2.0 °C, and 2.5 °C warming. (j) Area averaged change (%) in convective precipitation for the different levels (0.5 °C–2.5 °C) of warming. Error bars in (j) show inter-model variation (estimated using standard deviation) in the ALL and BEST -GCMs. Stippling in (a)–(f) shows more than 50% GCMs agree on the same sign of change.
Download figure:
Standard image High-resolution image
Changes in convective precipitation under the warming climate are significantly different in ALL-GCMs and BEST-GCMs due to the higher sensitivity of convective precipitation in a few GCMs (table S4 and S5). However, changes in the stratiform precipitation under the warming climate are similar in the BEST-GCMs and ALL-GCMs (figure S9). Due to the high convection sensitivity in a few GCMs, the multi-model ensemble mean of ALL-GCMs projects a higher increase in precipitation as well as a decline in dryness under the 1.5 °C, 2.0 °C, and 2.5 °C warming worlds (figures 3(d)–(f) and 4(d)–(f)). The multi-model ensemble mean of ALL-GCMs is largely affected by the GCMs that show a higher sensitivity of convection precipitation to warming. The five GCMs (HadGEM2-CC, MRI-CGCM3, GISS-E2-R, CMCC-CM, and CSIRO-Mk3-6-0; referred as low-skill GCMs in South Asia) that show a higher increase in convective precipitation under the warming climate also exhibit lower skill in simulating the key monsoon features in Ashfaq et al (2017). The ensemble mean of low-skill GCMs projects a large decline (more than 10%) in the dryness primarily due to substantial rise (more than 20%) in precipitation (total and convective) over South Asia under the 1.5 °C, 2.0 °C, and 2.5 °C warming worlds (figure S10). Therefore, we infer that the higher projected increase in precipitation and a decline in dryness in ALL-GCMs is largely affected by the high sensitivity of convective precipitation in the low-skill GCMs.
4. Discussion and conclusions
Our results are in contrast to the previous studies that reported strengthening of the summer monsoon under the warming climate (Turner and Annamalai 2012, Jayasankar et al 2015) in South Asia, which in turn will lead to an increased water availability (Schewe et al 2014) and reduced aridity (Huang et al 2017, Park et al 2018). The projected increase in the monsoon precipitation reported in the previous studies (Turner and Annamalai 2012, Jayasankar et al 2015) is based on the multi-model ensemble mean, which is largely affected by the higher projected increase in precipitation in the poor performing GCMs. Moreover, our results showing an increased dryness under the warming climate are in disagreement with the recent global studies (Scheff and Frierson 2015, Huang et al 2016, Park et al 2018), which reported no increase in the aridity or dryness in the future over South Asia. Therefore, the projections of dryness based on the multi-model ensemble mean have uncertainty in South Asia due to low skills of CMIP5-GCMs to simulate the monsoon season precipitation (Saha et al 2014, Chen and Zhou 2015, Sabeerali et al 2015). The previous estimates of aridity or dryness (Schewe et al 2014, Scheff and Frierson 2015, Huang et al 2016, 2017, Park et al 2018) based on the multi-model ensemble underestimate the risk of an increase in dryness in South Asia.
Reliability of the monsoon season precipitation projections in the CMIP5-GCMs has been questioned in the previous studies (Saha et al 2014, Chen and Zhou 2015, Sabeerali et al 2015). We find that the projected increase in PET is much higher than the precipitation leading to increased dryness in South Asia under 1.5 °C, 2.0 °C, and 2.5 °C warming worlds in the BEST-GCMs. In 2.5 °C warming world, about 1960 (±1033) million people (under SSP-3) are projected to be affected by increased dryness, which is about 2.5 times higher than the population affected [790(±336) million in SSP-1) under the 1.5 °C temperature target at the end of the 21st century. The projections based on the ALL-GCMs are largely affected by the changes in the low-skill GCMs that show a larger increase (∼20%) in precipitation under the warming climate. The projected increase in precipitation in low-skill is mainly due to poor convection parameterization schemes (Sabeerali et al 2015). We note that the ensemble mean from the BEST and ALL GCMs diverge the most at 2.5 °C indicating that there is a need to consider the proper evaluation of GCMs for climate change projections in South Asia.
As our analysis is based on the dryness index as an indicator of water shortage, it has limitations. For instance, the actual water shortage will vary spatially since much of the agriculture in South Asia is irrigated. Water generated in other areas, especially in the water surplus river basins (Shah and Mishra 2016) can be used for irrigation and water supply in the other basins (e.g. strong linkages in downstream use of upstream generated water). Moreover, the timing of peak PET and precipitation in South Asia can also lead to seasonal differences in water demands. For instance, projections associated with increased monsoon season precipitation will provide soil moisture moisture during and post monsoon depending on the soil moisture persistence. However, peak PET occurs during the pre-monsoon season, which is further likely to increase under the warming climate. Therefore, increased atmospheric water demands in the post-monsoon season due to warming can cause rapid drying, which can affect both water availability and water demands. Overall, in contrast to the previous studies, we show that the dryness is projected to increase in South Asia under the future climate affecting millions of people and their livelihood based on agriculture.
Acknowledgments
The first author appreciates financial assistance from the Indian Ministry of Human Resource Development (MHRD). We acknowledge the funding from the National Water Mission, Ministry of Water Resources, BELMONT Forum, and Ministry of Earth Sciences. We also appreciate the data support from CRU: http://cru.uea.ac.uk/data, and CMIP5: https://esgf-node.llnl.gov/search/cmip5/.
Data availability
The data that support the findings of this study are available from the corresponding author upon reasonable request. The datasets can also be obtained from from CRU: http://cru.uea.ac.uk/data, and CMIP5: https://esgf-node.llnl.gov/search/cmip5/.