


Abstract
Arctic tundra is becoming greener and shrubbier due to recent warming. This is impacting climate feedbacks and wildlife, yet the spatial distribution of plant biomass in tundra ecosystems is uncertain. In this study, we mapped plant and shrub above-ground biomass (AGB; kg m−2) and shrub dominance (%; shrub AGB/plant AGB) across the North Slope of Alaska by linking biomass harvests at 28 field sites with 30 m resolution Landsat satellite imagery. We first developed regression models (p < 0.01) to predict plant AGB (r2 = 0.79) and shrub AGB (r2 = 0.82) based on the normalized difference vegetation index (NDVI) derived from imagery acquired by Landsat 5 and 7. We then predicted regional plant and shrub AGB by combining these regression models with a regional Landsat NDVI mosaic built from 1721 summer scenes acquired between 2007 and 2016. Our approach employed a Monte Carlo uncertainty analysis that propagated sampling and sensor calibration errors. We estimated that plant AGB averaged 0.74 (0.60, 0.88) kg m−2 (95% CI) and totaled 112 (91, 135) Tg across the region, with shrub AGB accounting for ~43% of regional plant AGB. The new maps capture landscape variation in plant AGB visible in high resolution satellite and aerial imagery, notably shrubby riparian corridors. Modeled shrub AGB was strongly correlated with field measurements of shrub canopy height at 25 sites (rs = 0.88) and with a regional map of shrub cover (rs = 0.76). Modeled plant AGB and shrub dominance were higher in shrub tundra than graminoid tundra and increased between areas with the coldest and warmest summer air temperatures, underscoring the fact that future warming has the potential to greatly increase plant AGB and shrub dominance in this region. These new biomass maps provide a unique source of ecological information for a region undergoing rapid environmental change.
Export citation and abstract BibTeX RIS
1. Introduction
Arctic tundra is the coldest terrestrial biome (Holdridge 1947) and is undergoing rapid warming and environmental change (Hinzman et al 2005, Bhatt et al 2010, Fauchald et al 2017). The Arctic tundra biome has warmed nearly twice as fast as the rest of the planet over the past half century (IPCC 2013). Warming was amplified by large reductions in both spring sea ice and snow cover, which increase the amount of solar energy that is absorbed and re-radiated by ocean and land surfaces (Chapin et al 2005, Brown et al 2010, Serreze and Barry 2011). This amplified warming trend has increased plant productivity (Bhatt et al 2010, Belshe et al 2013, Berner et al 2013), plant biomass (Jia et al 2003, Epstein et al 2012), and shrub cover (Tape et al 2006, Myers-Smith et al 2011) in parts of this biome during recent decades. These ecological changes further reduced surface albedo and likely amplified regional warming despite greater carbon sequestration in tundra plant biomass (Chapin et al 2005).
Satellite remote sensing has revealed a widespread increase ('greening') and less prevalent decrease ('browning') in plant productivity and biomass across the Arctic tundra biome (Goetz et al 2005, Bhatt et al 2010, Guay et al 2014). The extent and magnitude of greening and browning has often been assessed using time series analysis of the normalized difference vegetation index (NDVI; Tucker 1979). The NDVI is an indicator of plant photosynthetic capacity (Tucker and Sellers 1986) and productivity (Goetz and Prince 1999, Berner et al 2011). Within tundra ecosystems, NDVI has also been linked to variation in plant above-ground biomass (AGB; Shippert et al 1995, Jia et al 2003, Walker et al 2003a, Raynolds et al 2012), as well as shrub cover (Blok et al 2011b, Boelman et al 2011) and radial growth (Forbes et al 2010, Blok et al 2011a). A recent analysis of summer NDVI derived from the advanced very high resolution radiometer (AVHRR) found that ~40% of the Arctic tundra had greened from 1982–2012, while ~5% had browned during this period (Loranty et al 2016). Widespread greening of the Arctic tundra has been documented using a variety of satellites (for example, AVHRR, MODIS, Landsat, SPOT, Corona, Gambit) that in some cases have measurements from the early 1960s (Myneni et al 1997, Jia et al 2003, Bunn et al 2007, Verbyla 2008, Berner et al 2013, Frost et al 2014, Frost and Epstein 2014, Guay et al 2014, Ju and Masek 2016).
Pronounced warming and shrub expansion occurred during the latter part of the 20th century in northern Alaska (Tape et al 2006, Bhatt et al 2010, Chapin et al 2014, Hobbie et al 2017). Remote sensing analyses suggest that regional warming contributed to plant AGB increasing by up to 1.15%−1.34% yr−1 since the early 1980s, as assessed by linking biomass harvests with NDVI derived from the AVHRR (Jia et al 2003, Epstein et al 2012). The increase in plant AGB is at least partly due to shrub expansion, enlargement, and densification (Sturm et al 2001, Tape et al 2006, Naito and Cairns 2015). Repeat photographs show willow (Salix spp.), Siberian alder (Alnus viridis), and dwarf birch (Betula spp.) becoming more dominant in riparian areas where shrubs can capitalize on a longer growing season, higher nutrient availability, and enhanced propagule dispersal (Tape et al 2006, Naito and Cairns 2011, Tape et al 2012, Tape et al 2016a). These changes in plant AGB and shrub dominance are affecting wildlife populations (for example, moose, caribou) that provide important sustenance for northern communities (Tape et al 2016b, Fauchald et al 2017). Plant AGB and shrub dominance will likely continue to increase in this region if warming trends persist (Epstein et al 2008, Pearson et al 2013), yet few studies (Raynolds et al 2012, Greaves et al 2016) have mapped current plant or shrub AGB in this region or other parts of the Arctic tundra biome.
Spatially detailed information regarding the amount and distribution of plant biomass is needed to assess climate feedbacks, wildlife habitat, and other ecological responses to climate. Our primary objective in this study was to map current spatial patterns of plant AGB (kg of dry matter m−2), shrub AGB, and shrub dominance (%; shrub AGB/plant AGB) across the North Slope of Alaska. Specifically, plant AGB included live and standing dead shrubs, graminoids, forbs, mosses, and lichens, while shrub AGB included both deciduous and evergreen species with woody stems irrespective of plant height. We mapped plant and shrub AGB at 30 m spatial resolution by linking biomass harvests with Landsat NDVI. We then: (1) evaluated the new maps, (2) summarized the distribution of AGB among plant communities, and (3) quantified how AGB changed along regional temperature gradients.
2. Study area
Our study area covered 15.2 Mha of land on the North Slope of Alaska (figure 1, 68.5°N–71.5°N, 140°W–167°W). Specifically, the study area encompassed non-water portions of the Beaufort Coastal Plain and Brooks Foothills ecoregions as defined by the Unified Ecoregions of Alaska 2001 data set (Nowacki et al 2003). These cold and arid regions are underlain by continuous permafrost that prevents drainage and causes waterlogged soils and wetland vegetation (Walker et al 2003a, Walker et al 2005). The Beaufort Coastal Plain supports extensive lowland tundra plant communities often dominated by sedges (for example, Carex aquatilis, Carex bigelowii) and small shrubs (for example, Salix reticulata, Salix arctica). The warmer Brooks Foothills supports tussock tundra (Eriophorum vaginatum), shrub tundra (for example, Betula nana, Salix pulchra) and mixed tundra communities (Jorgenson and Heiner 2003). Larger deciduous shrubs occur along rivers and streams (Beck et al 2011, Tape et al 2012).

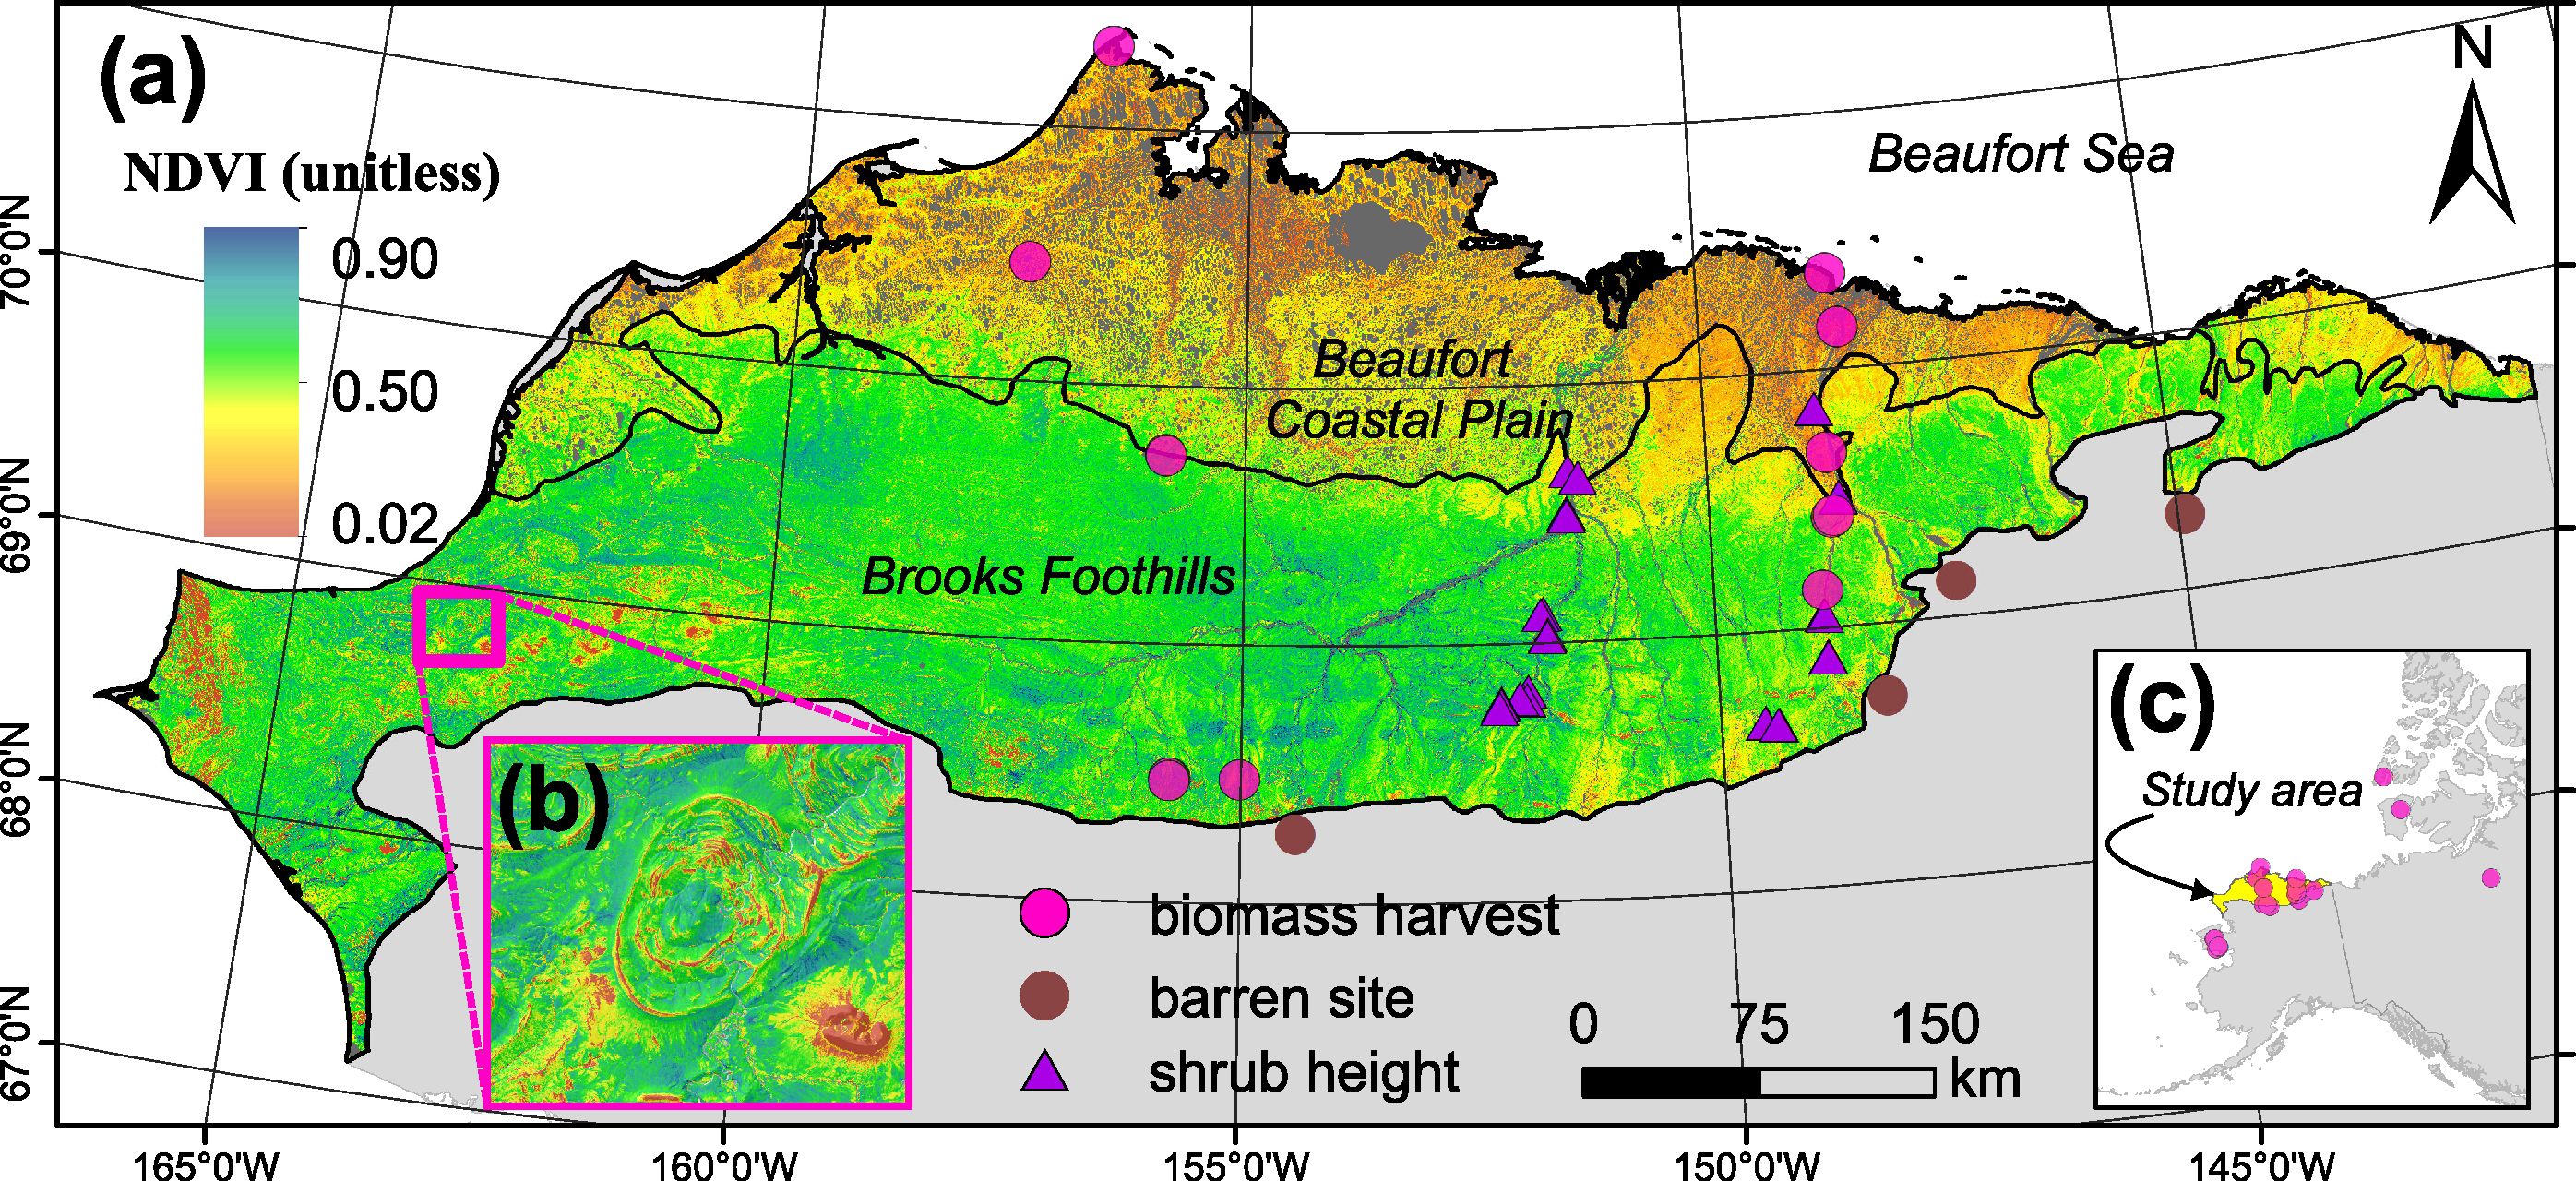
Figure 1. (a) Landsat peak summer normalized difference vegetation index (NDVI; 2007–2016) and field sampling locations on the North Slope of Alaska. Biomass harvests are from published sources (Raynolds et al 2002, Walker et al 2003a, Copass et al 2007a, Copass et al 2007b, Walker et al 2012, Vankoughnett and Grogan 2016), as are measurements of shrub height (Duchesne et al 2016). (b) Example of Landsat peak summer NDVI in the western Brooks Foothills showing barren upland areas with low NDVI contrasted against lowland areas with high NDVI. (c) Locator map depicting study area and location of biomass harvest sites, including those on the Seward Peninsula and in northern Canada.
Download figure:
Standard image High-resolution image3. Methods
3.1. General approach
We developed empirical models for predicting AGB from Landsat NDVI using plant biomass harvests from a large network of field sites, and then predicted regional AGB by applying these empirical models to Landsat NDVI composite mosaics covering the study area. We quantified uncertainty arising from sampling and sensor calibration errors using a Monte Carlo framework. Independent field data were not available to fully validate our predictions of plant and shrub AGB, so we provide additional lines of evidence supporting these predictions. First, we visually compared our predictions against spatial patterns of plant and shrub AGB that were visible in high resolution satellite and aerial imagery. Second, shrub AGB should be highest in areas with the tallest and most extensive shrub canopies, so we compared our predictions of shrub AGB with (a) field measurements of shrub canopy height and (b) a regional shrub canopy cover map. Third, field studies have shown that plant AGB and shrub dominance are often higher in shrub tundra than graminoid tundra (Shaver and Chapin 1991, Riedel et al 2005), so we tested whether modeled plant AGB and shrub dominance similarly differed among regional plant communities. Finally, we examined how AGB varied along regional air temperature gradients.
3.2. Plant biomass data
We relied primarily on published field measurements of plant and shrub AGB to develop empirical relationships between AGB and Landsat NDVI (Raynolds et al 2002, Walker et al 2003a, Copass et al 2007a, Copass et al 2007b, Walker et al 2012, Vankoughnett and Grogan 2016). These field measurements were derived from clip harvests at tundra sites on the North Slope (n = 14), the Seward Peninsula (n = 7), and in northern Canada (n = 3). With the exception of one Canadian site (Vankoughnett and Grogan 2016), the measurements were made as part of the NSF-sponsored Arctic Transitions in the Land-Atmosphere System project (Walker et al 2003a) and subsequent International Polar Year Greening of the Arctic initiative (Walker et al 2012). Biomass was harvested during the period of peak AGB (mid-June to mid-August). Live and standing-dead vascular plants were clipped at the moss surface in 5–12 quadrats that were distributed on transects or a large plot at each site. Quadrats were typically 20 × 50 cm. Lichen and the green portion of mosses were also harvested. Samples were sorted by plant functional type (PFT; for example, shrub, graminoid, forb, moss, lichen), dried, weighed, and then expressed as dry biomass per unit area (kg m−2). We acquired or computed the mean and standard error (SE) of plant and shrub AGB among quadrats at each site ( , SEAGB). Plant AGB included the total live and standing dead AGB of all PFTs. Shrub AGB included deciduous and evergreen species with woody stems. Finally, we supplemented the collection of field sites with four unvegetated sites that were situated in mountainous areas around the region. These sites were identified using high resolution satellite, aerial, and oblique imagery available on Google Earth. Together, this data set provided estimates of plant and shrub AGB at 28 sites (figure 1(c)). These sites did not constitute a random or systematic sample of the study area, but did encompass a broad range of tundra plant communities. Additional details are provided in the supplementary material available at stacks.iop.org/ERL/13/035002/mmedia.
3.3. Landsat satellite data
We used Landsat data to: (1) create a seamless multi-band composite mosaic of the study area, and (2) determine NDVI at each of the 28 locations for which we had estimates of plant and shrub AGB. Specifically, we used Landsat 5 and 7 surface reflectance data sets from the United States Geological Survey that had been atmospherically corrected using the Landsat Ecosystem Disturbance Adaptive Processing System (Masek et al 2006). We accessed and post-processed the Landsat data using Google Earth Engine (Gorelick et al 2017).
Creating a seamless composite mosaic of the study area first involved collecting all available scenes from Landsat 5 (n = 361) and Landsat 7 (n = 1360) that were acquired over the region from late June through late August between 2007 and 2016. Next, we masked pixels that had been flagged as water, snow, clouds, or cloud shadows using the function of mask algorithm (Zhu and Woodcock 2012, Zhu et al 2015) and took additional steps to mask residual water, clouds, and cloud shadows (Ju and Masek 2016, Pekel et al 2016). After extensive masking, we: (1) computed the NDVI for each scene, (2) bias-corrected the NDVI from Landsat 5 to match Landsat 7 (figure S2; Ju and Masek 2016), (3) computed the 80th percentile NDVI values for each pixel from all available scenes, and then (4) identified the scene with the NDVI closest to this percentile. Finally, we created a multi-band Landsat composite mosaic of the study area by extracting spectral reflectance information from these 'peak greenness' scenes on a per pixel basis.
In addition to generating the composite mosaic, we also computed Landsat peak summer NDVI for each field site. We used the same masking and compositing approach, but instead of considering the entire 2007–2016 period, we selected Landsat scenes that spanned a four-year window around when a cluster of sites was sampled. A four-year window balanced data availability against the need to ascertain NDVI concurrent with field sampling. We computed the mean and standard error of Landsat peak summer NDVI for all unmasked pixels within a 50 m radius buffer around each field site ( , SENDVI). We tested multiple buffer sizes (50 m, 100 m, or 200 m) and found that they had minimal effect on mean NDVI at these sites. After generating the Landsat composite mosaic and estimating peak summer NDVI at each field site, we mapped plant and shrub AGB across the study area.
3.4. Plant biomass mapping and uncertainty assessment
We modeled plant AGB (kg m−2), shrub AGB (kg m−2), and shrub dominance (%) over the study area by first developing empirical AGB–NDVI relationships at the field sites and then applying these relationships to regional Landsat NDVI mosaics. We tracked uncertainty in these predictions using a Monte Carlo approach (Harmon et al 2007, Berner et al 2017). Specifically, we focused on: (1) uncertainty in the AGB–NDVI models resulting from sampling errors in both variables within each site, and (2) uncertainty in the regional NDVI given uncertainty in the sensor calibration (Markham and Helder 2012). Our approach involved repeatedly (n = 1000) permuting  and
and  at each site, fitting nonlinear (exponential) models to the permuted field data, and then predicting regional AGB by combining each nonlinear model with a permutation of the regional NDVI mosaic. We fitted these models using the nonlinear least squares function in R (R Core Team 2015) and, after predicting AGB, computed shrub dominance for each permutation. Finally, for each of these plant attributes, we computed the pixel-wise median, 2.5th percentile, and 97.5th percentile among the suite of permutations. This yielded both a best estimate (median) and 95% confidence interval (CI) for each plant attribute at 30 m resolution for the North Slope. These CIs incorporate several important sources of uncertainty, but do not provide a full account of potential errors (for example, atmospheric correction) and thus are a conservative estimate of uncertainty. We implemented this modeling routine on a high-performance computing cluster at Northern Arizona University. Furthermore, we pre-processed, analyzed and visualized these data using a combination of ArcGIS 10.5 (ESRI, Redlands, CA), ArcScene 10.5, and the R packages dplyr (Wickham and Francois 2015) and raster (Hijmans and van Etten 2013). Additional details are provided in the supplementary material available at stacks.iop.org/ERL/13/035002/mmedia.
3.5. Comparison of the AGB maps with other data sources
We visually compared our predictions of plant and shrub AGB with spatial patterns visible in a high resolution GeoEye-1 satellite image (1.8 m) and an oblique aerial image. The GeoEye-1 image was acquired during summer 2010 and obtained from the University of Minnesota Polar Geospatial Center. The oblique aerial image was acquired from a helicopter during the summer of 2001 as part of an earlier study (Tape et al 2006).
We also compared our predictions of shrub AGB against field measurements of shrub canopy height made on large plots (250 × 250 m) at 25 sites that were widely distributed along the Chandler and lower Colville Rivers as well as the Dalton Highway (figure 1(a); Duchesne et al 2016). These field measurements focused on shrubs > 50 cm tall and were made during 2010 and 2011. We computed the mean and SE of shrub AGB among pixels within a 100 m radius buffer around each site and then assessed the strength of the association between mean shrub AGB and mean shrub canopy height using Spearman's correlations (rs).
We additionally compared our predictions of shrub AGB against a new regional map of shrub canopy cover (Macander et al 2017) in which shrub canopy cover (%) was mapped across ~12.5 Mha of the North Slope at a 30 m spatial resolution by linking point-intercept field measurements with Landsat imagery and other geospatial datasets. We performed a pixel-wise comparison between modeled shrub AGB and canopy cover for the area of overlap between the data sets.
3.6. Plant biomass distribution among plant communities
We summarized plant biomass by plant community type using the Ecosystems of Northern Alaska data set (Jorgenson and Heiner 2003), which was derived using Landsat and depicts the spatial extent of 36 ecosystem classes on the North Slope. We selected and consolidated ecosystem classes to those representing shrub, tussock, sedge, and mixed tundra plant communities and then computed the mean and total plant and shrub AGB within each plant community. We tested for differences in mean and total AGB among plant communities using a boot-strapping approach based on the Monte Carlo simulations. Additional details are provided in the supplementary material, as are tabular summaries for each consolidated and non-consolidated ecosystem class (tables S3, S4, S5).
3.7. Plant biomass and regional air temperatures
We examined how plant biomass changed along regional gradients in both monthly mean air temperatures (Tavg) and the summer warmth index (SWI). The WorldClim-2 data set provided estimates of monthly Tavg (1970–2000) at 1 km resolution (Fick and Hijmans 2017), which we resampled to 30 m resolution. We computed the SWI as cumulative monthly Tavg exceeding 0 °C (Jia et al 2003, Walker et al 2003a). We then calculated mean plant AGB, shrub AGB, and shrub dominance at 0.1 °C increments along the regional temperature gradients and assessed the association between each mean plant attribute and regional air temperatures using Spearman's correlations.
4. Results
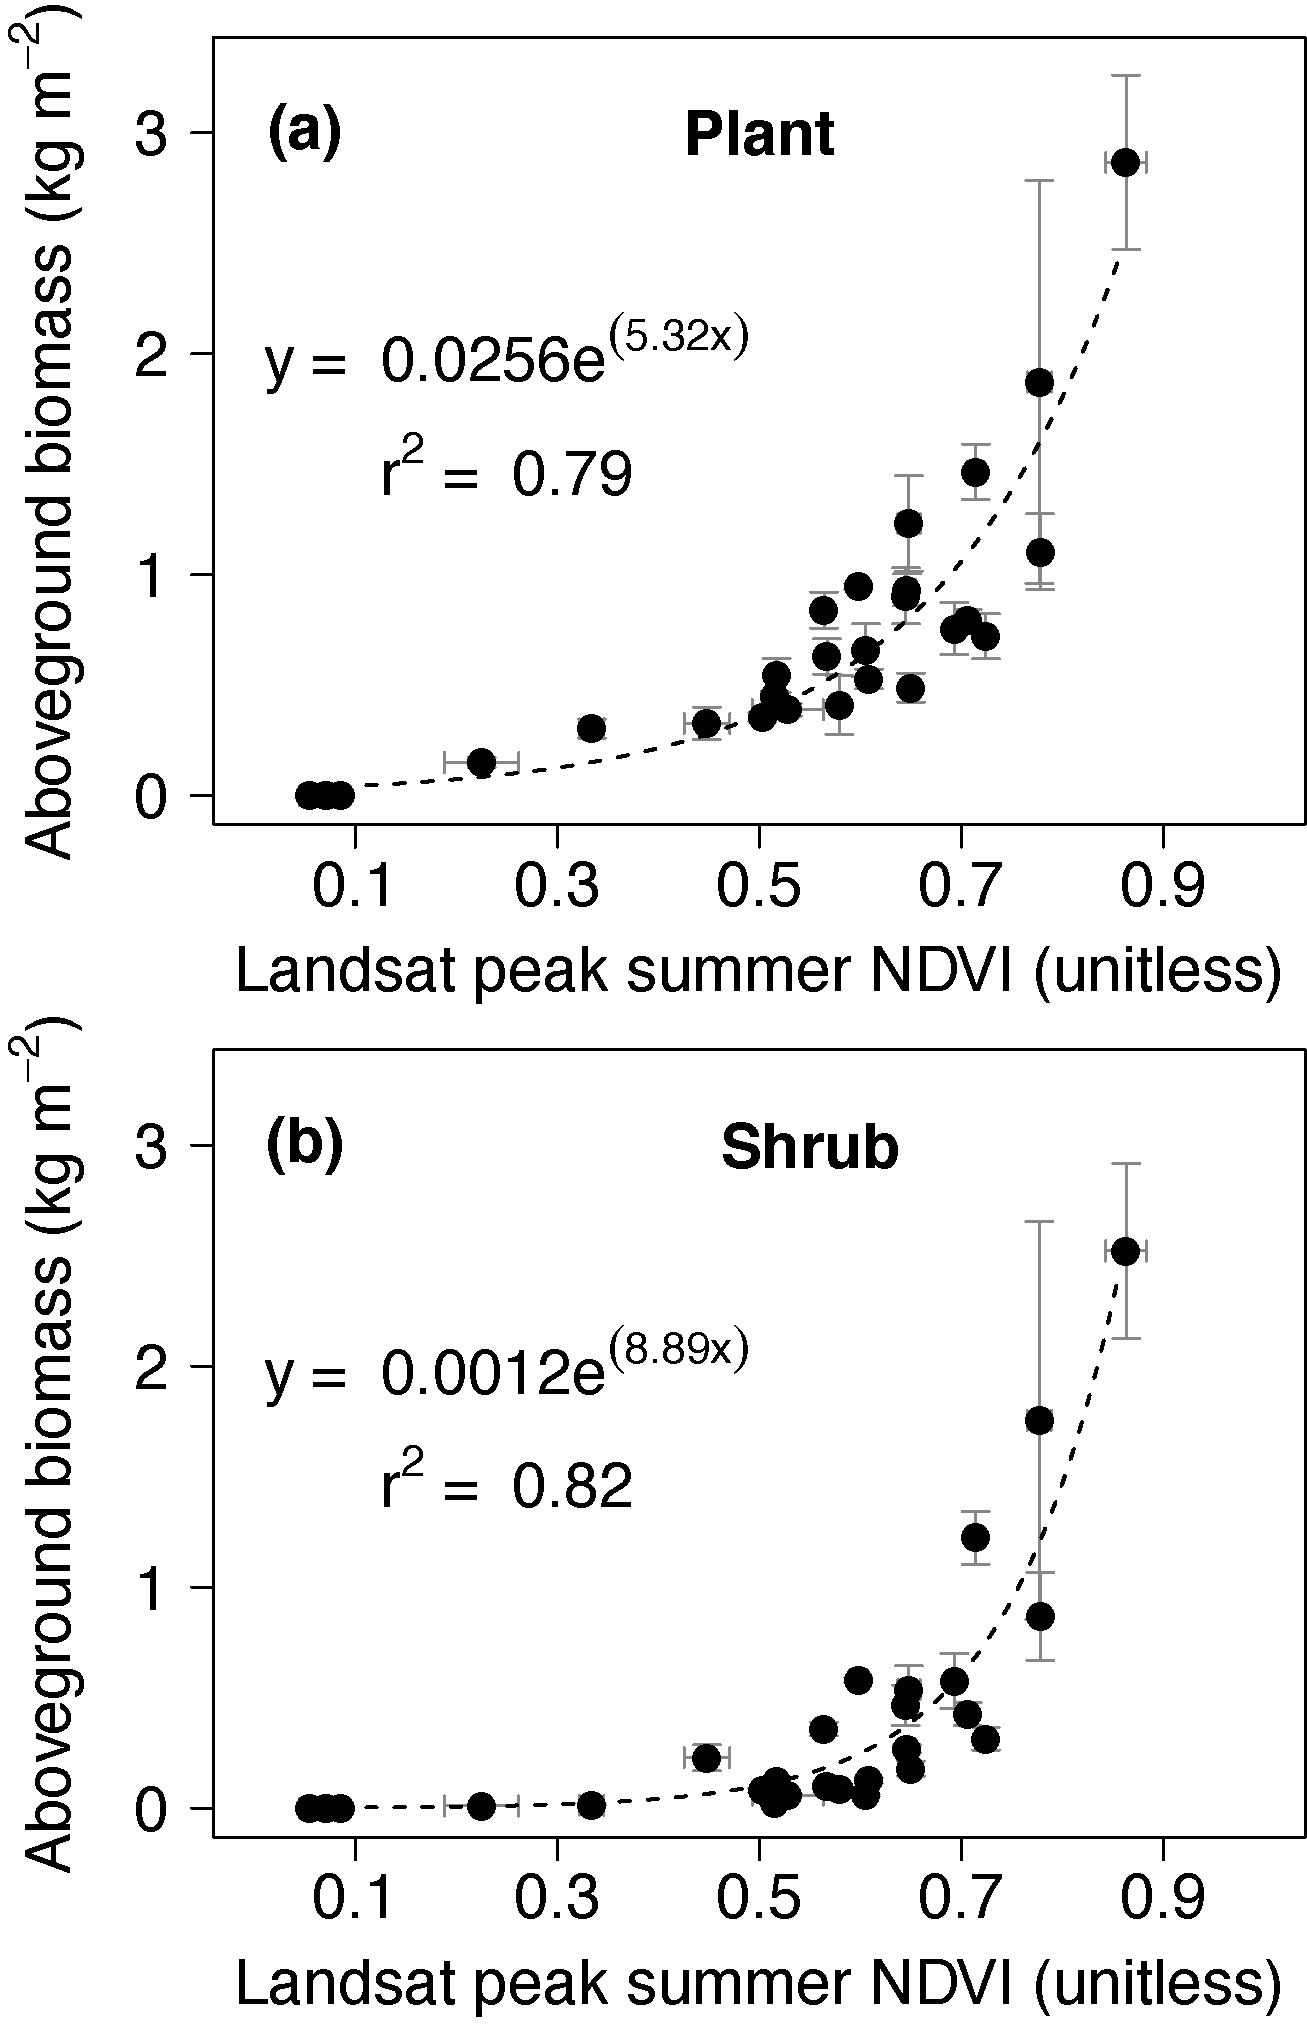
Plant and shrub AGB increased exponentially with increasing Landsat peak summer NDVI across 28 sites that spanned a wide range of tundra plant communities (figure 2). Plant and shrub AGB ranged from 0–2.42 kg m−2 and 0–2.14 kg m−2, respectively, among these sites. Similarly, Landsat peak summer NDVI ranged from 0.06–0.86 among sites. Landsat peak summer NDVI explained 79 (59, 88; 95% CI)% and 82 (59, 91)% of the variability in plant and shrub AGB among these sites, respectively (p < 0.01). The plant AGB–NDVI models had an RMSE of 0.29 (0.20, 0.46) kg m−2 and the shrub AGB–NDVI models had an RMSE of 0.24 (0.17, 0.48) kg m−2 (table S1).
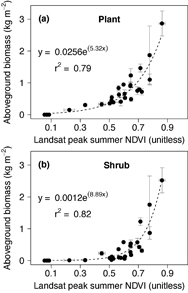
Figure 2. (a) Plant and (b) shrub above-ground biomass (AGB; kg m−2) increased exponentially with increasing Landsat peak summer NDVI (unitless) across 28 tundra sites spread among the North Slope (n = 18), Seward Peninsula (n = 7), and northern Canadian (n = 3). Plant AGB included shrubs, forbs, graminoids, lichens and mosses. Shrub AGB included both deciduous and evergreen shrubs. Each point with error bars represents a sampling site, specifically the mean and one standard error of (1) biomass measured on each quadrat, and (2) NDVI within a 50 m radius around each site.
Download figure:
Standard image High-resolution image
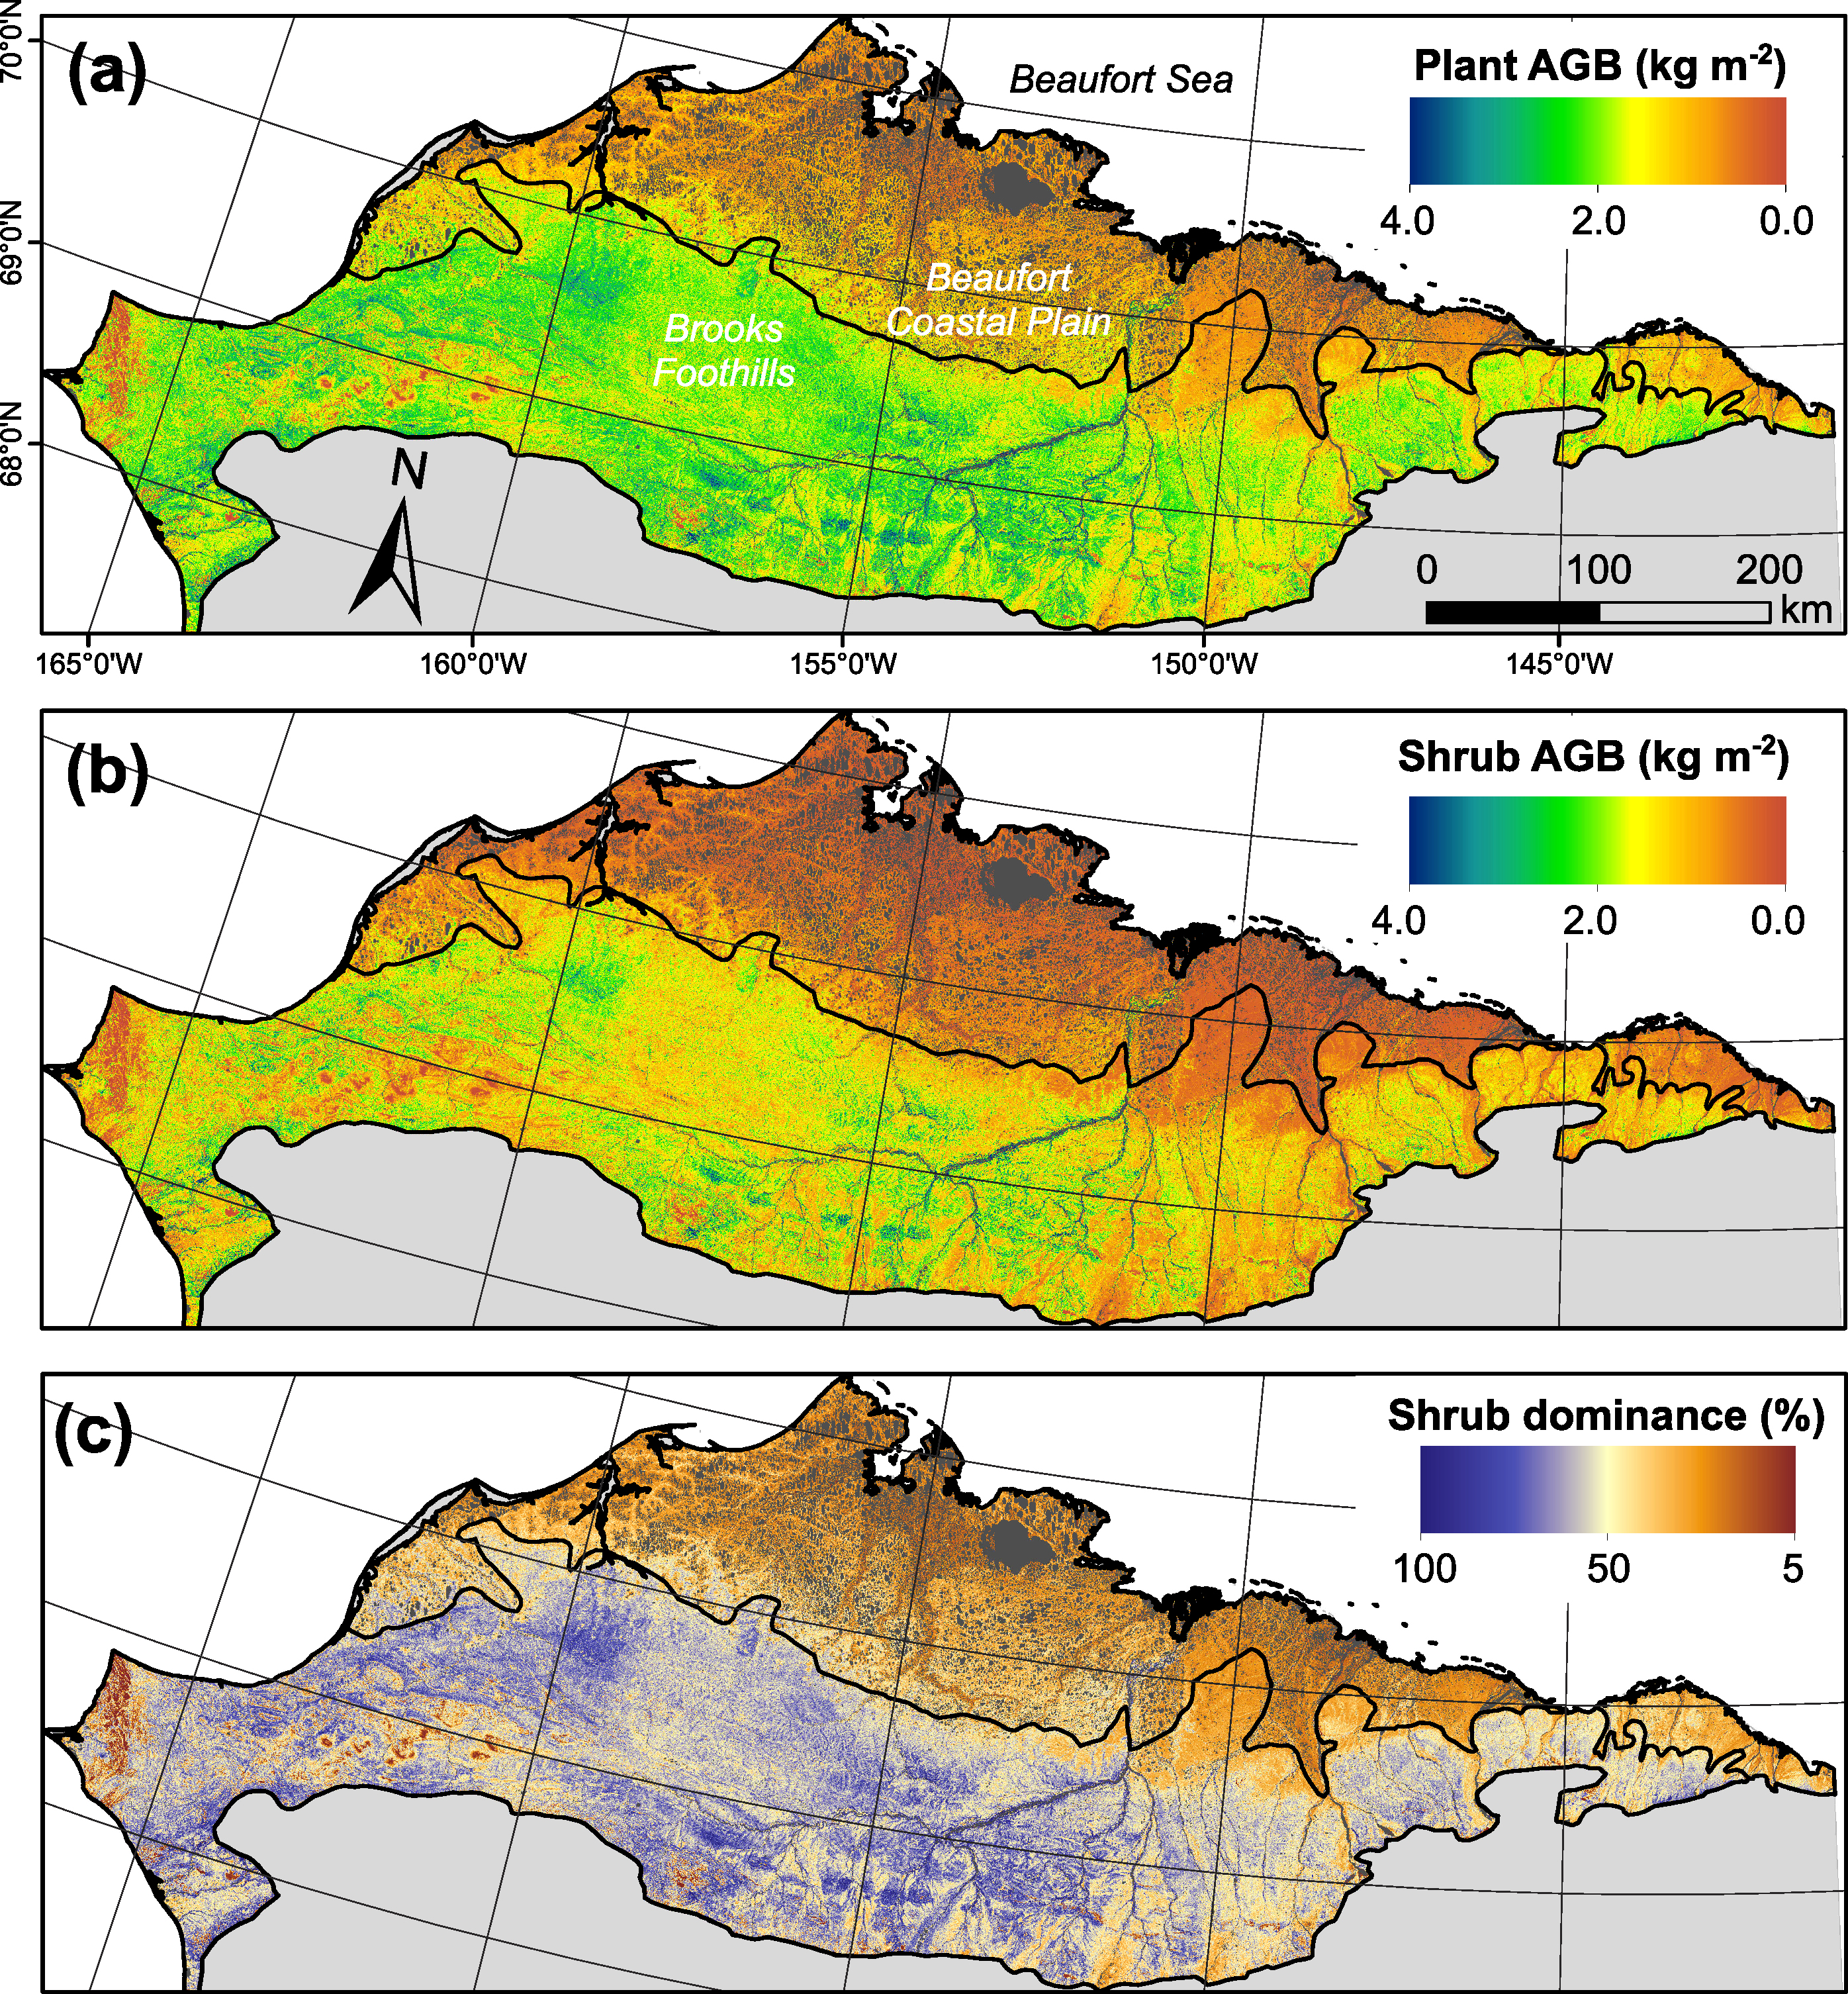
Figure 3. (a) Plant above-ground biomass (AGB; kg m−2), (b) shrub AGB (kg m−2), and (c) shrub dominance (%) on the North Slope of Alaska. Plant and shrub AGB were mapped by using field biomass measurements to calibrate model predictions based on Landsat peak summer NDVI. Note the pronounced regional and local variation in these plant attributes. Inland waters are colored gray.
Download figure:
Standard image High-resolution image
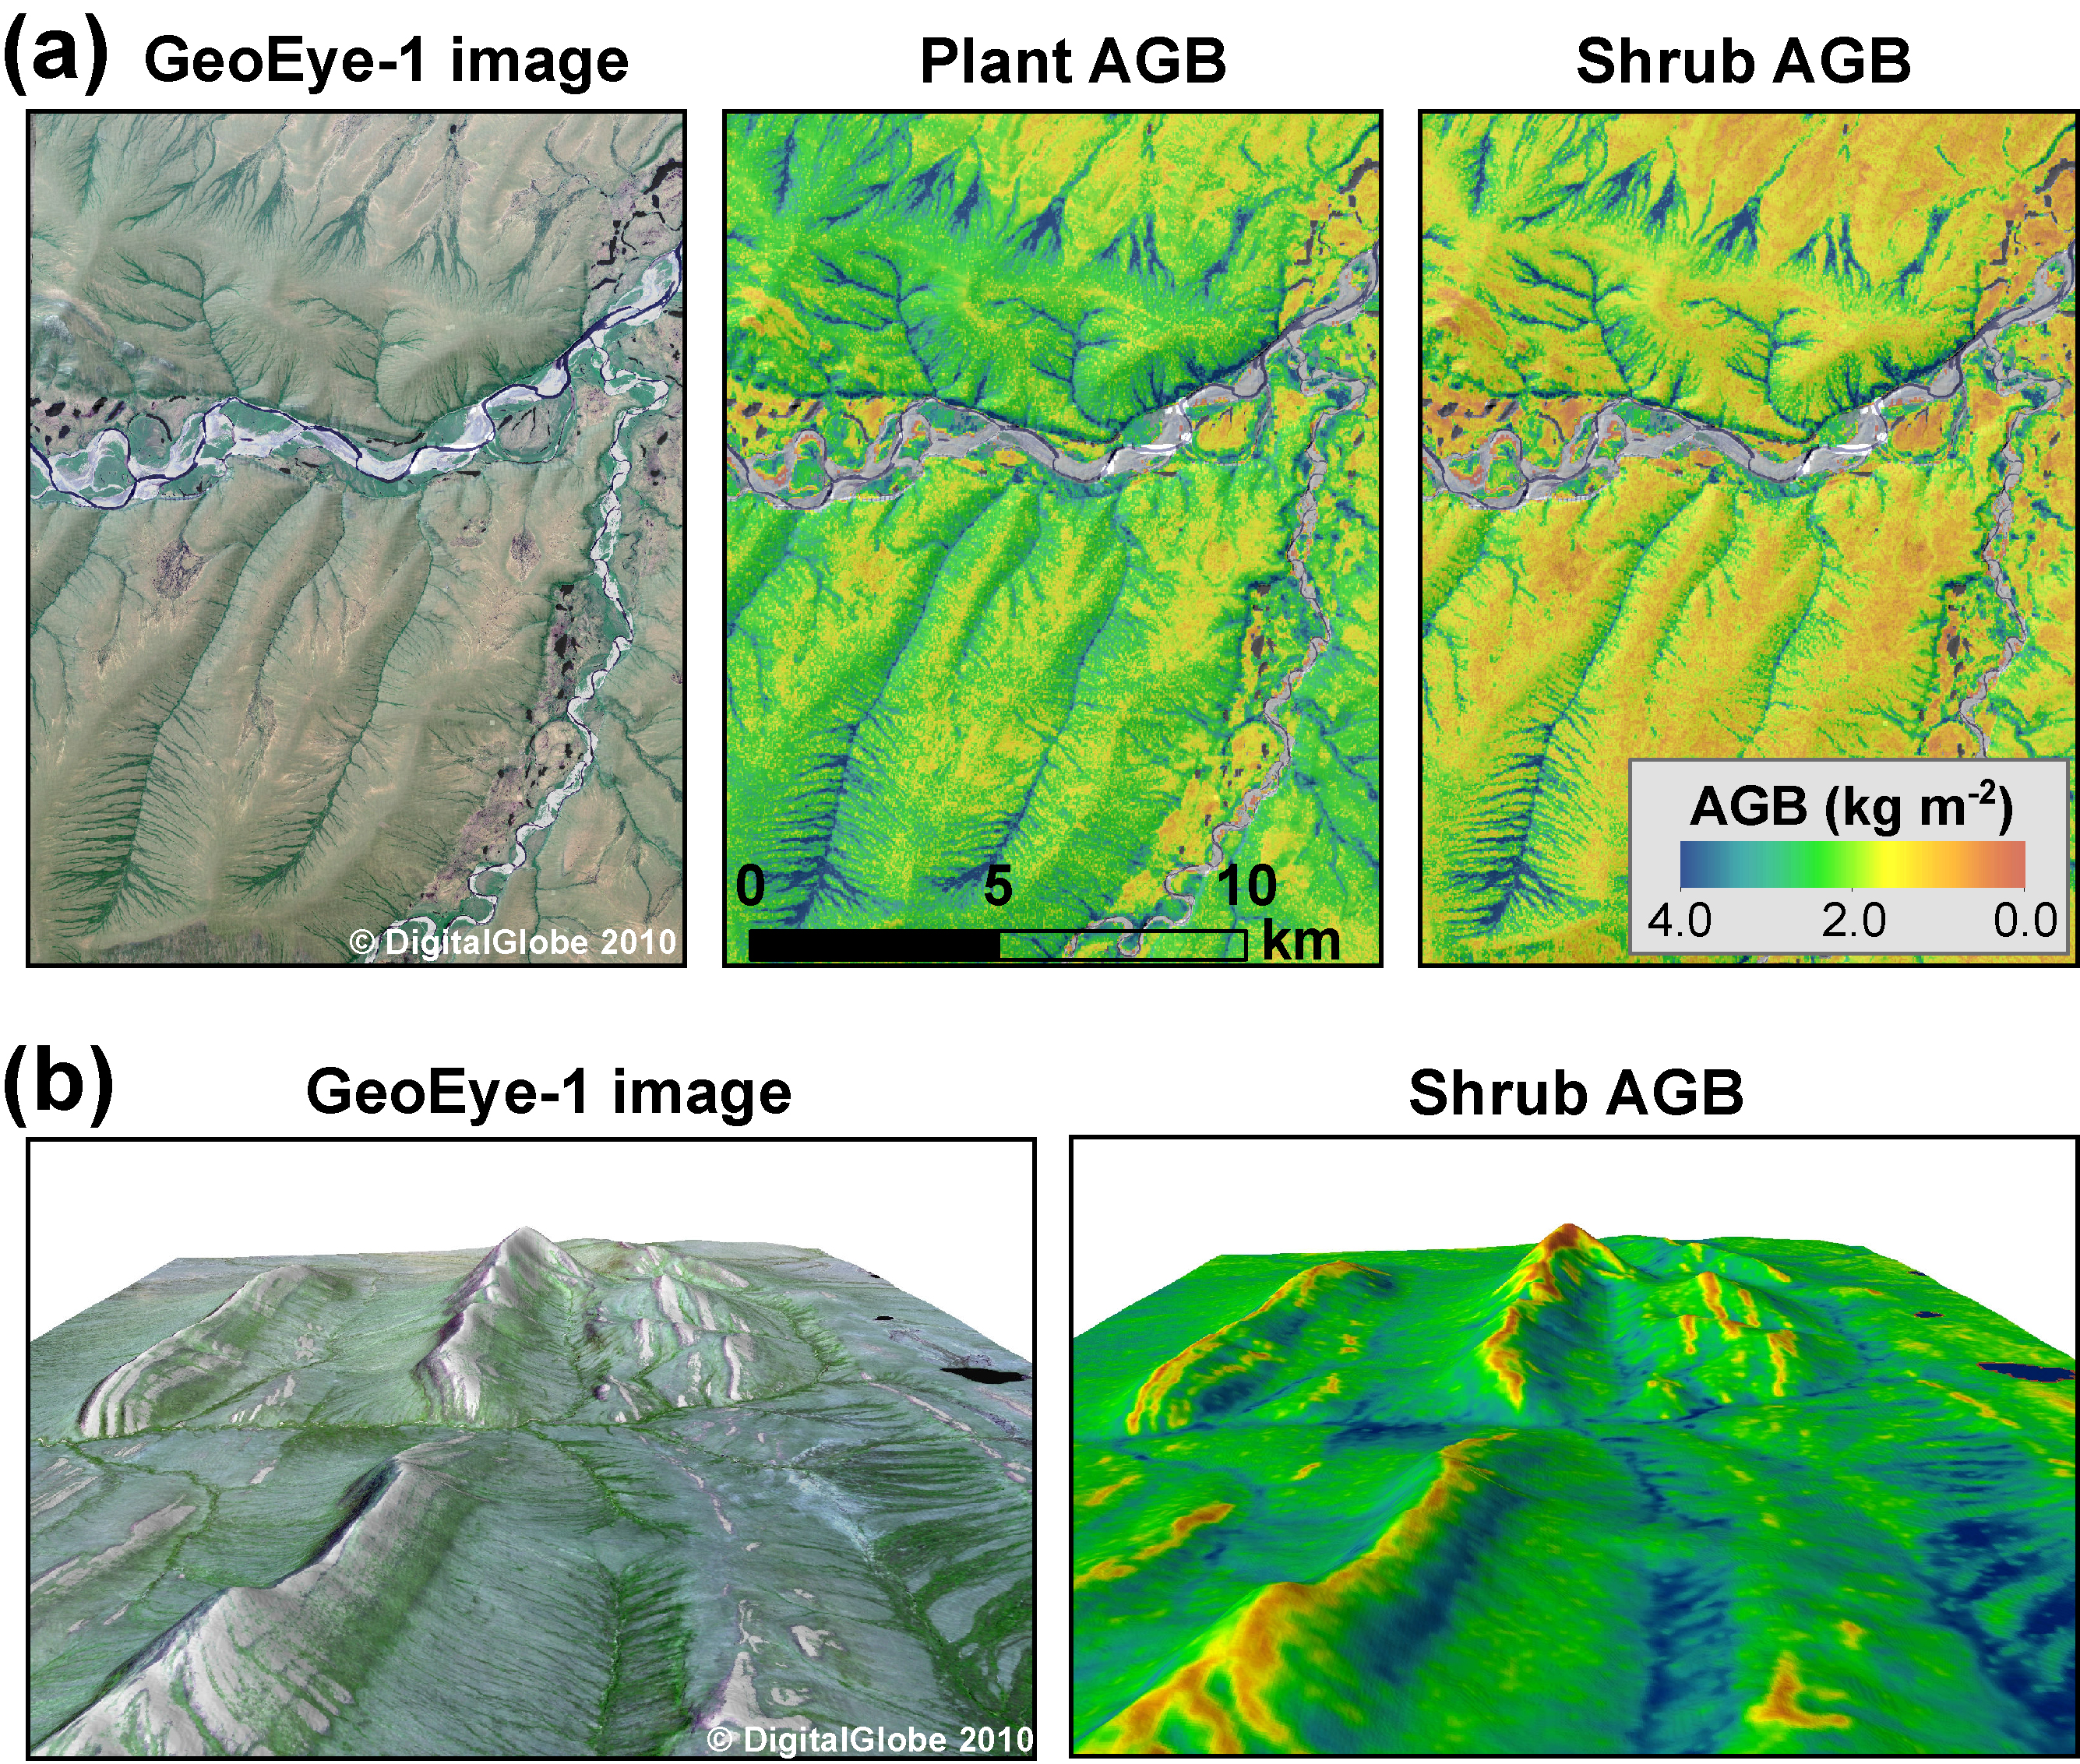
Figure 4. Visual comparison between high-resolution (1.8 m) GeoEye-1 satellite imagery and spatial patterns of plant and shrub above-ground biomass (AGB; kg m−2) mapped using Landsat for two areas in the Brooks Foothills. The biomass maps capture the complex network of verdant riparian corridors visible in panel (a), as well as the juxtaposition between riparian corridors and barren ridges visible in panel (b). The GeoEye-1 image and shrub biomass map in panel (b) were resampled to 5 m resolution and draped over a digital elevation model to highlight the topographic effects on biomass distribution. Reproduced with permission. © 2010 DigitalGlobe, Inc.
Download figure:
Standard image High-resolution image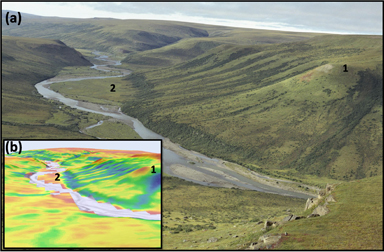
Figure 5. Visual comparison between (a) an oblique aerial photograph from along the Chandler River and (b) corresponding predictions of plant above-ground biomass (kg m−2) derived using Landsat. The biomass map captures both the barren hilltop and shrubby water track visible near location 1, as well as both the marginally vegetated floodplain and shrubby toe slope visible near location 2. The biomass map was resampled to 5 m resolution for this visualization and then draped over a digital elevation model. The color scheme in panel (b) is the same as used in figure 4. Photo credit: Ken Tape.
Download figure:
Standard image High-resolution image4.1. Regional plant biomass
We estimated the total plant AGB of the North Slope as 112 (91, 135) Tg. Shrub AGB accounted for 53 (32, 75) Tg, or 43 (28, 53)% of the regional plant AGB. Plant AGB averaged 0.74 (0.60, 0.89) kg m−2 over the study area and shrub AGB averaged 0.35 (0.21, 0.49) kg m−2 (table S1). Plant and shrub AGB respectively exceeded 1.09 and 0.62 kg m−2 across 10% of the region (figure S3). The biomass maps revealed a general decline in plant AGB, shrub AGB, and shrub dominance from the Brooks Foothills to the Beaufort Coastal Plain, as well as substantial variability in AGB at finer spatial scales (figures 4 and 5). For instance, the biomass maps resolved shrub-dominant areas with high AGB along streams and rivers, as well as nearby upland areas and bogs with lower AGB and less influence from shrubs. These verdant riparian corridors and sparser upland areas are clearly visible in the high resolution satellite and aerial images (figures 4 and 5).
4.2. Shrub biomass, height, and canopy cover
Areas with taller and more extensive shrub canopies tended to have higher predicted shrub AGB than areas with lower, sparser shrub canopies (figure 6). There was a strong positive relationship between modeled shrub AGB and mean shrub canopy height measured at 25 field sites (rs = 0.88, p < 0.001). Modeled shrub AGB appeared to increase more rapidly with mean shrub canopy height at sites with the shortest canopies; however, this likely reflects that canopy height was only measured on shrubs > 50 cm tall, whereas modeled shrub AGB includes shrubs of all sizes (figure 6(a)). In addition to the relationship with shrub height, there was also a strong positive relationship between modeled shrub AGB and the regional shrub canopy cover map (rs = 0.76, p < 0.001, figure 6(b)).

Figure 6. Shrub above-ground biomass (AGB; kg m−2) versus (a) shrub canopy height (m) and (b) shrub canopy cover (%). Shrub AGB tended to be higher in areas with taller and more extensive shrub canopies. Shrub AGB was modeled using biomass harvests and Landsat NDVI. (a) Shrub canopy height was measured for individual shrubs > 50 cm tall on large plots (250 × 250 m) located at 25 sites spread across the region (Duchesne et al 2016). Each point represents the average conditions at a site, while error bars depict plus or minus one standard error in each attribute. (b) The shrub canopy cover was modeled across much of the North Slope using field surveys, Landsat imagery, and various environmental data sets (Macander et al 2017). The relationship between modeled shrub AGB and canopy cover is depicted for 2000 pixels drawn at random from the study area.
Download figure:
Standard image High-resolution image4.3. Plant biomass distribution among plant communities
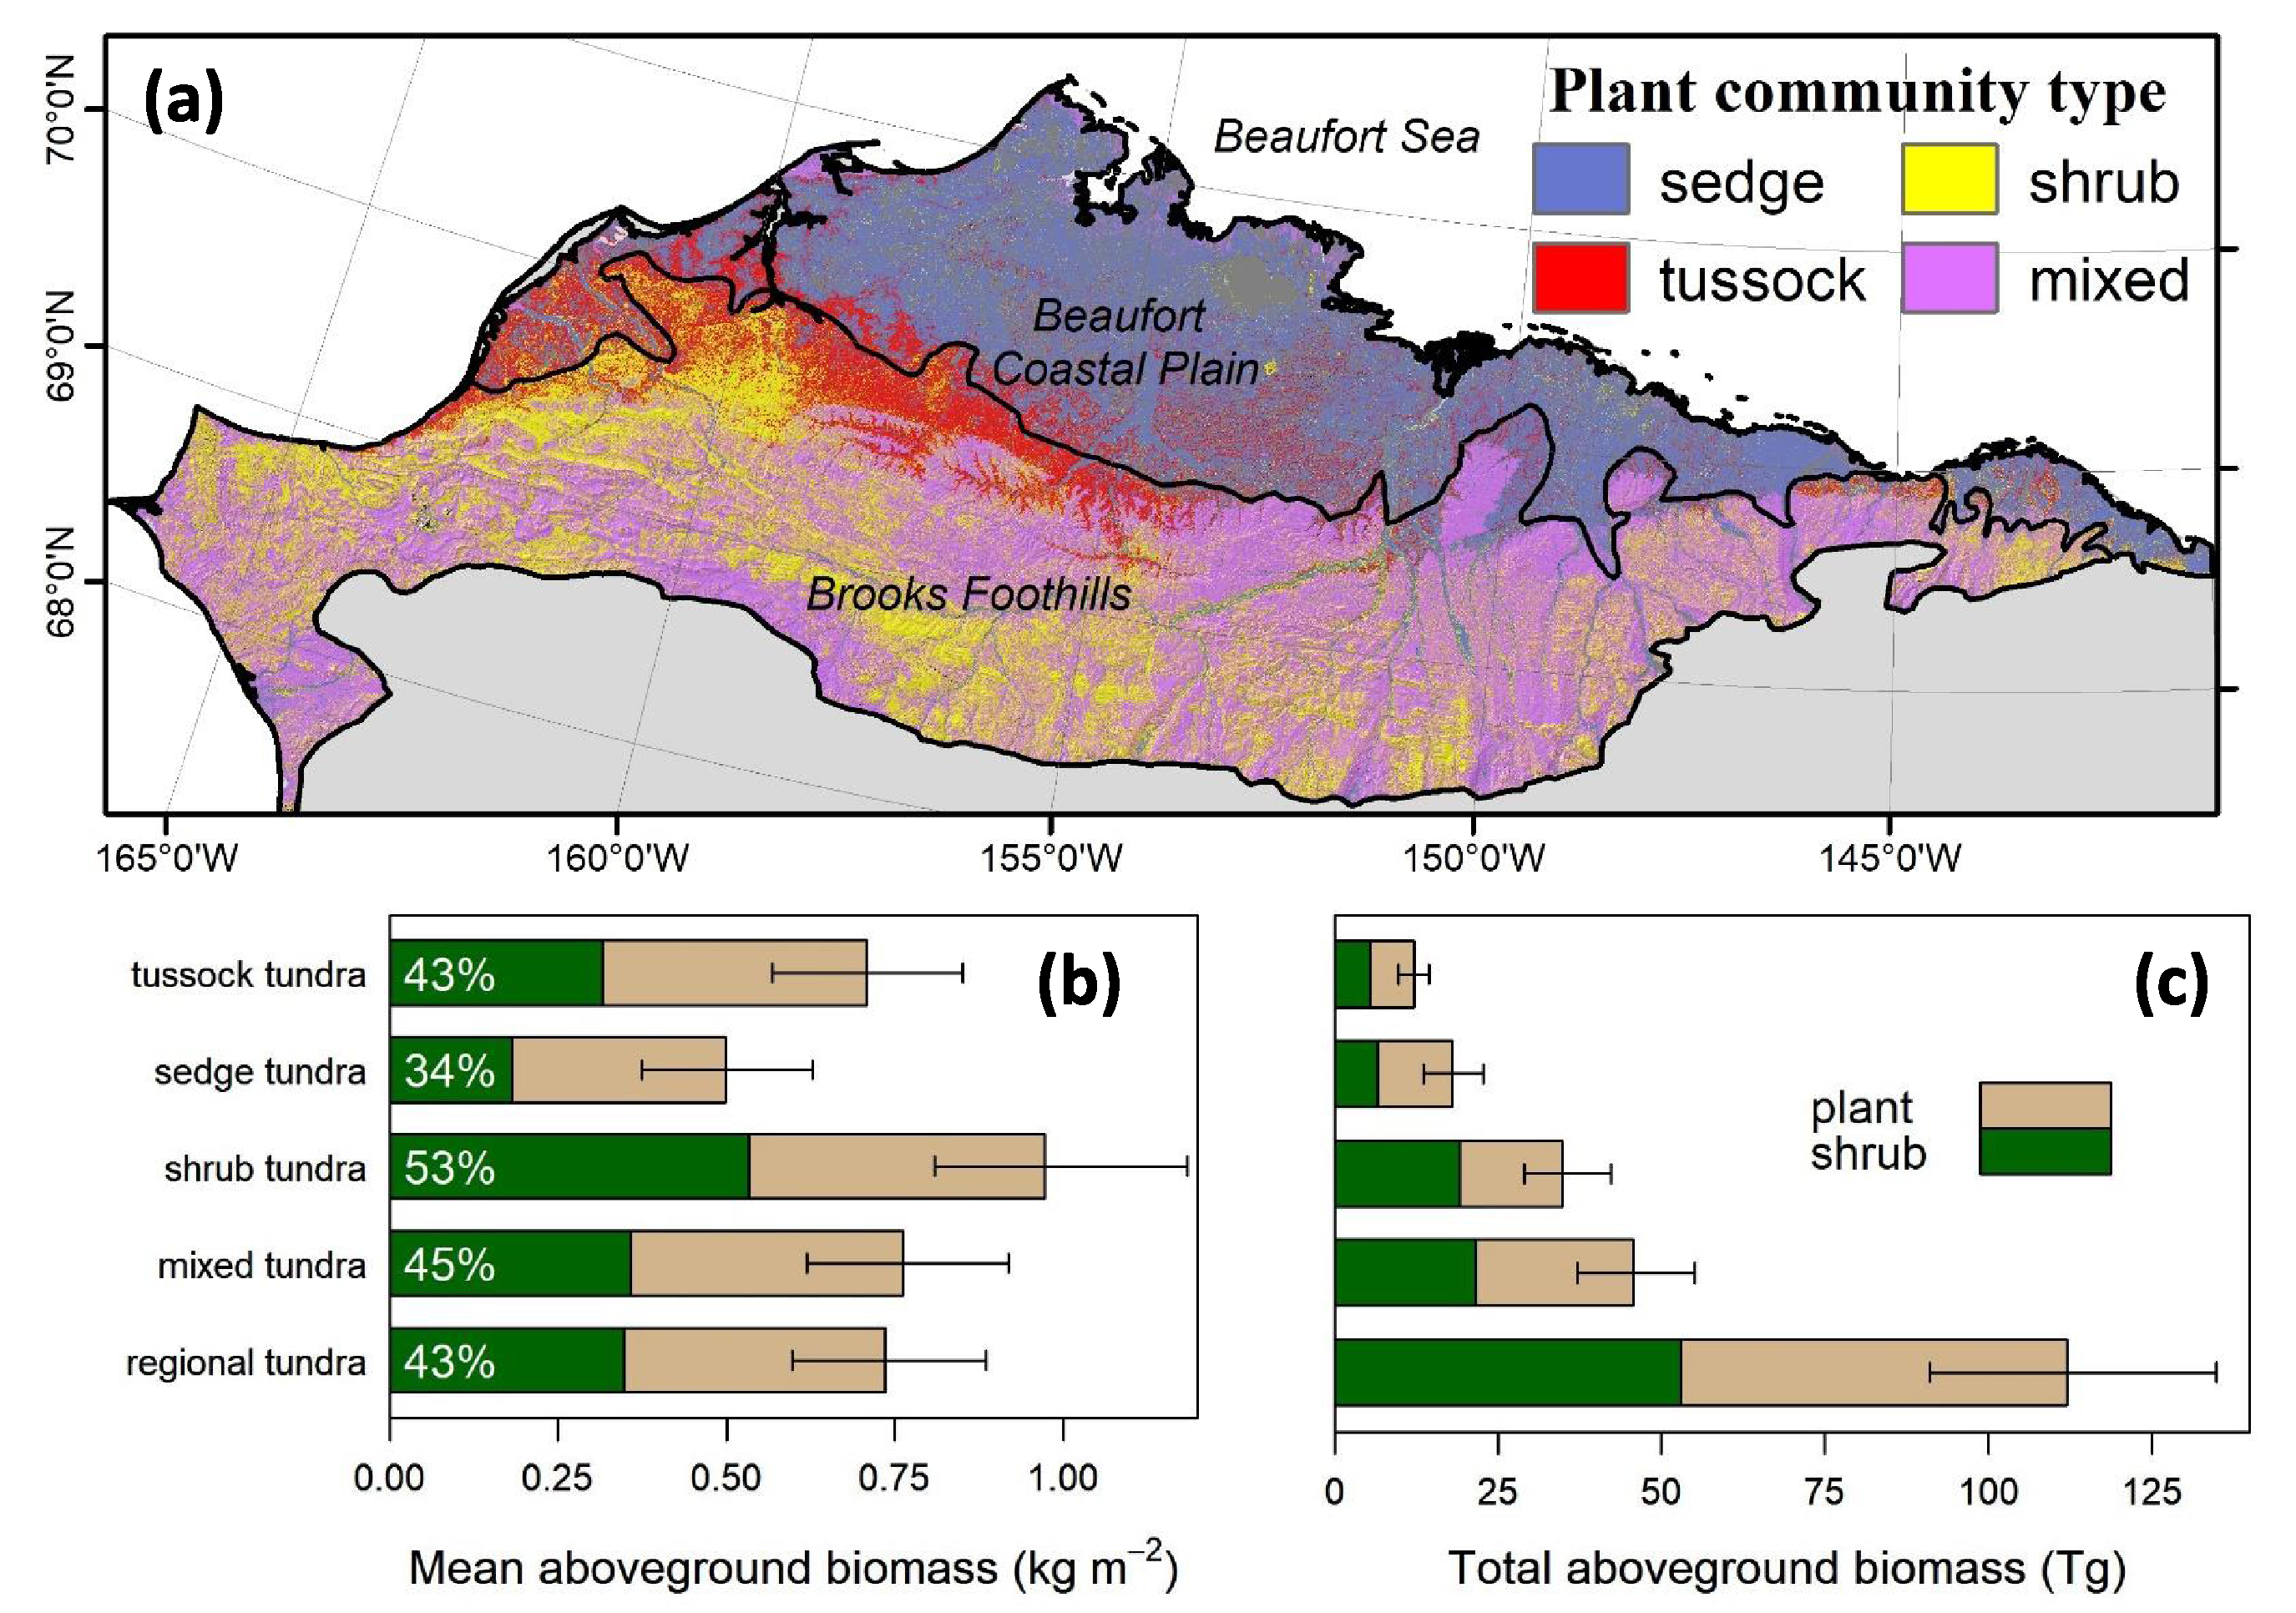
There were notable differences in plant and shrub AGB among plant communities (figure 7 (a)). The mean plant AGB was significantly (p < 0.05) higher in shrub tundra (~0.97 kg m−2) than in tussock tundra (~0.71 kg m−2) or sedge tundra (~0.50 kg m−2), as was the mean shrub AGB (figure 7(b)). Tussock tundra had higher mean plant AGB than sedge tundra, though mean shrub AGB did not differ significantly between these plant communities (p = 0.08). Mean shrub dominance in shrub tundra (~53%) was also higher than in sedge tundra (~34%), but did not differ significantly from tussock tundra (~43%, p = 0.14). In total, mixed tundra accounted for the largest percentage of regional plant AGB (~41%), followed by shrub (~31%), sedge (~16%), and then tussock (~10%) tundra (figure 7(b)). Regional shrub AGB was distributed similarly between mixed tundra (~40%) and shrub (~36%) tundra, with much smaller percentages occurring in sedge (~12%) and tussock (~10%) tundra (p < 0.05).

Figure 7. (a) Spatial distribution of broad plant community types on the North Slope and (b) and (c) summaries of plant and shrub above-ground biomass (AGB; kg m−2) for each plant community type. Error bars in the lower panels depict 95% confidence intervals derived from Monte Carlo analysis. The figure includes plant communities that comprised at least 1% of total plant AGB in the region. Plant community type was derived from the Ecosystems of Northern Alaska data set (Jorgenson and Heiner 2003). Tabular summaries are provided in tables S3, S4, and S5.
Download figure:
Standard image High-resolution image4.4. Plant biomass and regional air temperature
Regional variation in plant and shrub AGB was strongly influenced by summer air temperatures (figure 8). Specifically, mean plant AGB, shrub AGB, and shrub dominance increased persistently with increasing mean monthly air temperatures during June, July, and August (rs =0.96–0.98, p < 0.01). These attributes also increased notably along the regional gradient in SWI (all rs=0.97, p < 0.01), though showed considerably weaker relationships with mean monthly air temperatures during spring, fall, and winter (rs = −0.11–0.82; figure 8(b)). For instance, the mean plant AGB nearly doubles (~0.49 kg m−2 versus ~0.90 kg m−2) between areas with the coldest and warmest mean air temperature during June, while shrub AGB nearly quintuples (~0.10 kg m−2 versus ~0.47 kg m−2) along this thermal gradient (figure 8(c)). Additionally, shrub dominance nearly doubles (~28% versus ~50%) between the coldest and warmest areas (figure 8(c)).

Figure 8. (a) Regional variation in mean June air temperatures (Tavg; °C) on the North Slope. (b) Spearman's correlation coefficients relating mean plant above-ground biomass (AGB; kg m−2), shrub AGB, and shrub dominance (%) to regional gradients in both mean monthly air temperature and the summer warmth index (SWI). Plant attributes were averaged at 0.1 °C increments along each regional temperature gradient and then correlated with the temperature gradient. (c) The mean plant AGB, shrub AGB, and shrub dominance each increase persistently with higher mean June temperatures along the regional gradient. Each solid line in (c) depicts our best (median) estimate, while the dark and light bands encompass 50% (25–75th percentiles) and 95% (2.5–97.5th percentiles) of estimates, respectively. Monthly temperature climatologies (1970–2000) are from the WorldClim-2 data set (Fick and Hijmans 2017).
Download figure:
Standard image High-resolution image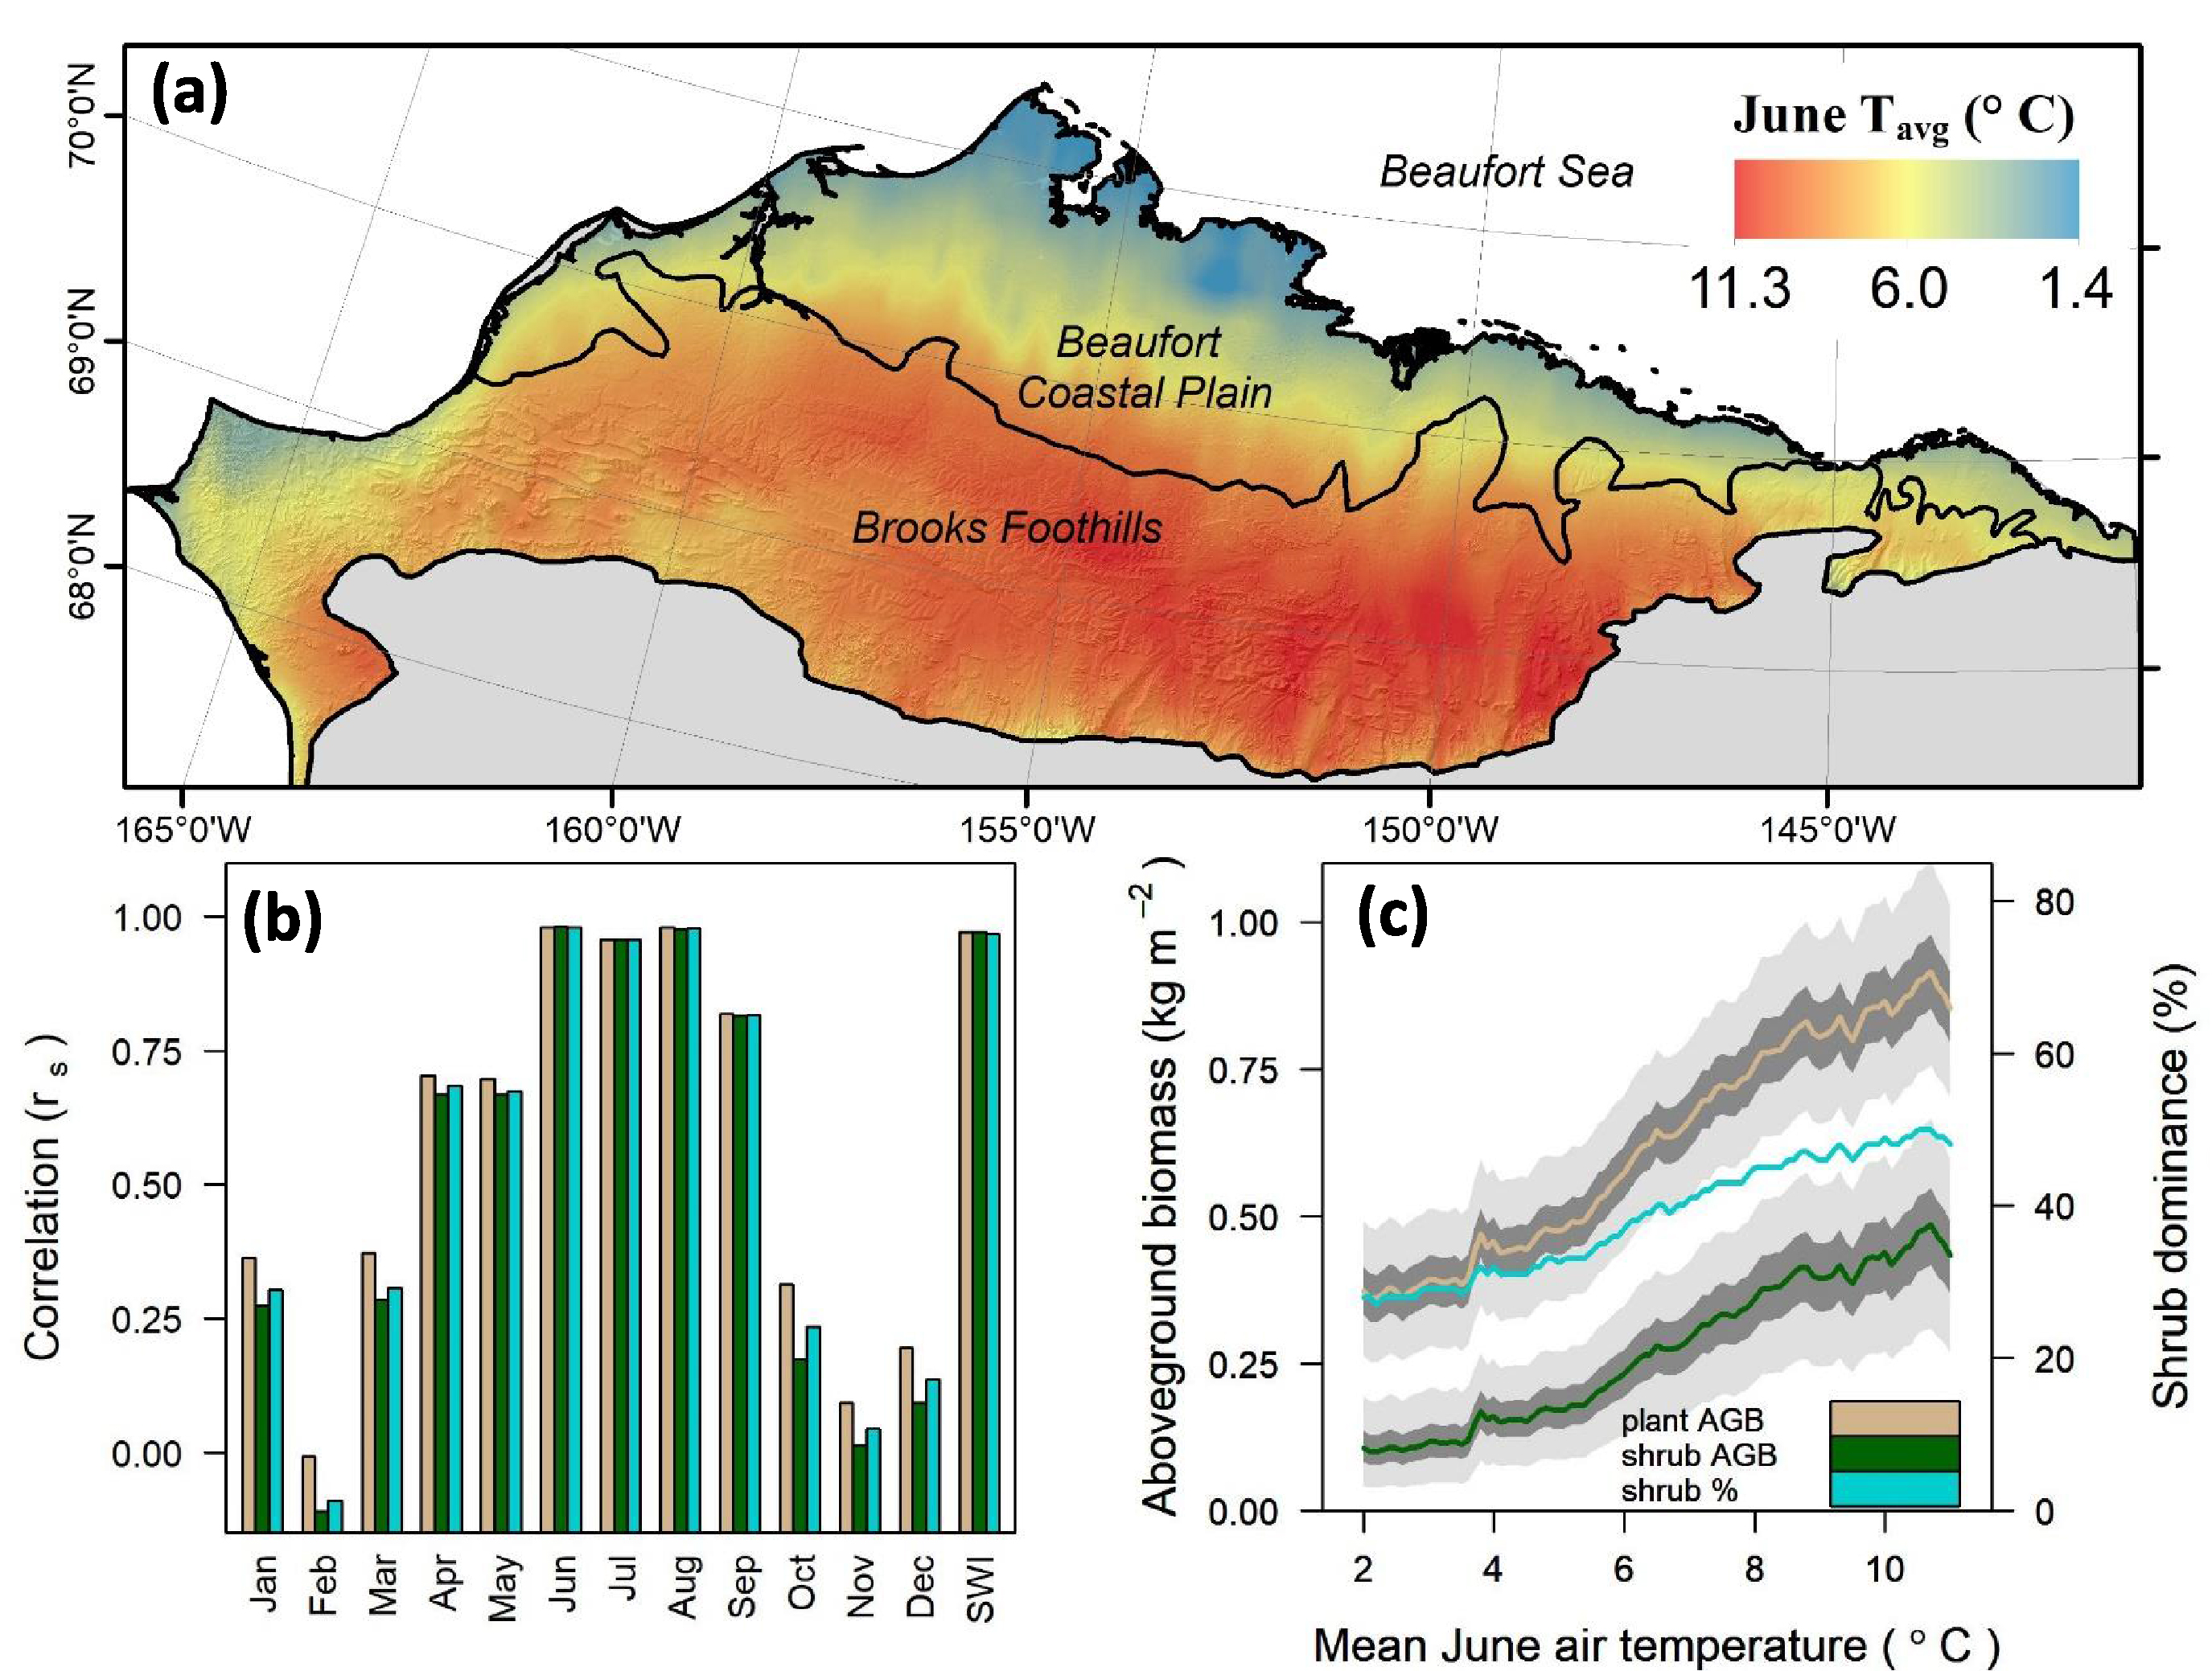
5. Discussion
5.1. Regional plant biomass and carbon stocks
The maps of plant and shrub AGB for the North Slope of Alaska that we present here complement the circumpolar Arctic biomass map that was developed by linking biomass harvests with NDVI derived from AVHRR (Raynolds et al 2012). Several associated studies examined trends in plant AGB using AVHRR time series (Jia et al 2003, Epstein et al 2012), yet ours is the only other satellite-derived map of plant AGB that covers the North Slope. Strikingly, regional estimates of the total plant AGB differed by just 4% between our map (~112 Tg) and the circumpolar map (~116 Tg), and spatial patterns of plant AGB were broadly similar after aggregating our map to the coarser spatial resolution of the circumpolar map (rs = 0.63, p < 0.01, figures S4 and S5). Although our regional maps cover just ~3% of the Arctic tundra biome covered by the circumpolar map, they provide estimates of AGB at ~171 000 times greater detail (30 m versus 12 400 m resolution). As a result, they resolve considerable landscape variation in both plant and shrub AGB, as is evident through comparison with high resolution imagery (figures 4 and 5). Our maps thereby provide a unique, management-relevant resource that can inform ecological monitoring and analysis of tundra plant communities on the North Slope.
Despite our focus on AGB in this study, we recognize that below-ground biomass (BGB) comprises a large but highly variable proportion of total plant biomass in tundra communities. For instance, root-to-shoot ratios range from approximately 1:2 for shrub tundra and 3:1 for tussock tundra to 20:1 for wet sedge-moss tundra (Bliss 2000). Global syntheses report root-to-shoot ratios of ~4.8 (Mokany et al 2006) to ~6.6 (Jackson et al 1996) for the tundra biome. We did not try to map plant BGB in this study given the paucity of the available BGB data and the wide variation in estimates for various vegetation types. However, using this collection of root-to-shoot ratios, we estimate that regional plant BGB on the North Slope roughly totals 536–737 Tg. Combining plant AGB and BGB suggests that plant biomass totals 647–848 Tg, which represents a carbon stock of 323–424 Tg assuming that biomass is 50% carbon. This plant biomass carbon stock is small (< 10%) relative to the amount of carbon stored in permafrost soils to 1 m depth on the North Slope (~6930 Tg C; Hugelius et al 2013). Nevertheless, plant biomass influences near-surface permafrost dynamics by shading and insulating the soil horizon (Walker et al 2003b, Blok et al 2010), as well as by mediating the fire regime (Berner et al 2012, Loranty et al 2016). Future efforts are needed to more accurately quantify and map plant BGB in tundra ecosystems, as well as to evaluate interactions among above-ground and below-ground ecosystem carbon pools (Webb et al 2017).
5.2. Mapping plant biomass using field measurements and Landsat imagery
Our approach to mapping AGB was informed by prior studies demonstrating strong relationships between tundra plant AGB and NDVI measured using hand-held spectrometers (Shippert et al 1995, Boelman et al 2003, Jia et al 2003) and satellite-borne spectrometers, typically AVHRR (Jia et al 2003, Walker et al 2003a, Raynolds et al 2012). The strong nonlinear relationship we observed between plant AGB and Landsat NDVI was consistent with these prior studies, though unique in that we demonstrated the relationship using Landsat and a relatively large network of tundra field sites. We also showed there was a strong relationship between shrub AGB and Landsat NDVI, thus expanding on earlier work using NDVI from hand-held spectrometers (Jia et al 2003). Shrubs are frequently the tallest plants in Low Arctic tundra and their canopy characteristics exert a strong influence over tundra spectral reflectance (Boelman et al 2011, Loranty et al 2011, Bratsch et al 2017). The NDVI is often considered to be an indicator of plant photosynthetic capacity (Tucker 1979) and likely tracks variation in tundra plant AGB given co-variation among plant community photosynthesis, leaf area, and AGB (Boelman et al 2003, Street et al 2007, Walker et al 2012). Our study highlights Landsat NDVI as a useful metric of spatial variation in plant and shrub AGB within the tundra biome. Furthermore, our results indicate that satellite observations of arctic greening likely reflect widespread increases in plant AGB and shrub dominance within this biome (Tape et al 2006, Epstein et al 2012, Frost et al 2014, Frost and Epstein 2014).
Our approach to mapping AGB depended on open access to the Landsat archive and the ability to efficiently process the large volumes of information in this archive. For this study we mined spectral information from over 2000 Landsat scenes using Google Earth Engine (Gorelick et al 2017). As a comparison, Beck et al (2011) mapped shrub cover over roughly the same region using seven Landsat scenes that were carefully mosaiced and inter-calibrated, yet which nevertheless exhibited some spectral irregularities and were missing data where clouds were present. Open access to the Landsat archive (Wulder et al 2012), automated cloud and shadow masking (Zhu and Woodcock 2012, Zhu et al 2015), and high-throughput computing (Gorelick et al 2017) are enabling rigorous new analyses of Earth's valuable land and water resources at spatiotemporal extents not previously achieved (Hansen et al 2013, Ju and Masek 2016, Pekel et al 2016).
5.3. Shrub biomass
We found that areas with taller and more extensive shrub canopies typically had higher predicted shrub AGB. Similarly, shrub canopy height and AGB scale allometrically among individual willow, alder, and birch from northern Alaska and Siberia (figure S6; Berner et al 2015). Regional warming contributed to modeled increases in shrub height and cover over the past half century in our study region, particularly within riparian areas (Tape et al 2006, Naito and Cairns 2011, Tape et al 2016a) where repeat aerial photographs show conspicuous shrub expansion since the late 1940s (Tape et al 2006). Shrub AGB is related to both shrub height and cover, thus the changes noted above were likely accompanied by an increase in regional shrub AGB (Jia et al 2003); however, the magnitude of change remains uncertain and warrants future investigation.
5.4. Plant biomass and shrub dominance among plant communities
We found that plant communities previously mapped as shrub tundra had higher predicted plant AGB and shrub dominance than communities mapped as tussock or sedge tundra. The differences that we observed among plant communities were similar to several prior studies (Walker et al 2003a, Riedel et al 2005). For instance, we estimated that plant AGB in shrub communities averaged 0.97 (0.81, 1.18) kg m−2 across the region and that shrubs typically comprised ~53% of this plant AGB. Plant AGB averaged 1.20 (1.00, 1.39) kg m−2 in a shrub community near Ivotuk, where shrubs similarly comprised 51% of plant AGB (Riedel et al 2005). Plant AGB and shrub dominance near Ivotuk were also highest in the shrub community, followed by tussock and sedge communities where shrubs composed 8%–39% of plant AGB. The differences in shrub dominance that we observed among plant communities was also consistent with differences in shrub cover predicted from Landsat (Beck et al 2011). These observations add credence to our predictions of plant and shrub AGB, while also highlighting the fact that future shrub encroachment into graminoid tundra will likely be accompanied by an increase in plant AGB (Pearson et al 2013).
5.5. Regional air temperatures, plant biomass, and carbon dynamics
We found that mean plant AGB nearly doubles between the coldest and warmest parts of the North Slope, while shrub AGB nearly quintuples. Consequently, shrub dominance was highest in areas with the warmest summers. Prior field studies similarly demonstrated that tundra sites with the warmest summers tend to have the highest plant AGB and shrub dominance (Epstein et al 2008, Walker et al 2012), along with the tallest and fastest growing willows (Walker 1987). Remote sensing studies have further shown that tundra NDVI (Raynolds et al 2008, Berner et al 2013) and shrub cover (Beck et al 2011) tend to increase along spatial gradients of increasing summer air temperatures. Our current study corroborates and advances these prior findings by linking field and remote sensing measurements to simultaneously demonstrate the pronounced temperature response of plant AGB, shrub AGB, and shrub dominance over a large region.
Given these observed patterns and recent ecosystem modeling (Pearson et al 2013, Yu et al 2017), we anticipate that continued warming will further increase plant productivity, AGB, and shrub dominance on the North Slope. Nevertheless, long-term warming could drive a net loss of carbon from these tundra ecosystems if the decomposition of soil organic matter (carbon loss) is stimulated to a greater degree than plant productivity (carbon gain; Mack et al 2004, Belshe et al 2013, Abbott et al 2016, Commane et al 2017). The greening of North Slope tundra ecosystems (Guay et al 2014, Ju and Masek 2016) was accompanied by increasing ecosystem respiration, such that the region was a net source of CO2 to the atmosphere from 2012–2014 (Commane et al 2017). Future efforts are needed to better understand how continued warming might affect climate feedbacks associated with tundra ecosystem carbon dynamics (Mack et al 2004, Abbott et al 2016), as well as with changes in tundra surface albedo and evapotranspiration (Pearson et al 2013).
5.6. Application of biomass maps for wildlife habitat modeling
Our new maps could be a useful tool for regional wildlife habitat modeling. Shrub height and canopy volume are strong predictors of the habitat suitability for moose (Alces alces gigas) and snowshoe hares (Lepus americanus) on the North Slope since these shrub attributes influence potential foraging and cover from predators (Zhou et al 2017). Shrub expansion and enlargement in riparian areas led to more suitable habitat for moose and snowshoe hares over the past century, likely causing these herbivores to expand their ranges into increasingly verdant parts of the North Slope (Tape et al 2016a, Tape et al 2016b). On the other hand, arctic greening has been linked to declining caribou populations across tundra ecosystems in North America (Fauchald et al 2017), potentially due in part to reduced foraging as shrubs outcompete lichen (Joly et al 2009, Fraser et al 2014, Fauchald et al 2017). Changes in shrub dominance can also impact migratory birds (Boelman et al 2014) and arthropod communities (Rich et al 2013, Sweet et al 2015). Our new maps of plant AGB, shrub AGB, and shrub dominance provide insight into the habitat suitability for herbivores, insectivores, and their associated predators (for example, lynx, wolves) in this rapidly changing region.
6. Summary and conclusions
The tundra biome is undergoing rapid climatic and ecological changes, yet much remains unknown about this biome because it is vast and remote. In this study, we found strong relationships between Landsat peak summer NDVI and both plant and shrub AGB across a large network of tundra field sites, highlighting the potential to quantify the amount, distribution, and recent changes in plant biomass using Landsat NDVI. Spatial patterns of plant biomass evident in our new maps showed close correspondence with spatial patterns visible in high resolution satellite and aerial images, and our estimate of total AGB within the region aligns closely with a previous estimate derived from coarser scale imagery. Furthermore, our predictions of shrub AGB closely tracked field measurements of shrub canopy height and co-varied with new independent remote sensing estimates of regional shrub cover. Areas with higher summer air temperatures tended to have higher mean plant and shrub AGB, as well greater shrub dominance. This implies that continued warming during summer months will increase plant AGB and shrub dominance on parts of the North Slope, thus continuing a trend that is already underway in both this and other arctic regions.
Data availability
The new maps of plant AGB (kg m−2), shrub AGB, and shrub dominance (%) are publicly archived with the Oak Ridge National Laboratory on the Distributed Active Archive System (ORNL DAAC; https://daac.ornl.gov/). The archive also includes associated uncertainty maps (Berner et al 2018).
Acknowledgments
This work was supported by the National Science Foundation Arctic Natural Sciences program (grant 1661723) and the National Aeronautics and Space Administration Arctic-Boreal Vulnerability Experiment (ABoVE) (grant NNX17AE44G). High resolution GeoEye satellite imagery was provided by the Polar Geospatial Center under NSF OPP awards 1043681 and 1559691. Computational analyses were run on the Northern Arizona University's Monsoon computing cluster, funded by Arizona's Technology and Research Initiative Fund. We thank Howie Epstein for comments on earlier drafts of the manuscript, and Skip Walker, Martha Raynolds, Catharine Copass, and Howie Epstein for collecting and archiving the biomass harvest data sets used in our analysis. We also thank Patrick Burns for help with figure 5, Richard Massey for assistance with Google Earth Engine, and Chris Coffey for guidance on high-performance computing.