

Abstract
We provide a detailed estimate of the technical potential of rooftop solar photovoltaic (PV) electricity generation throughout the contiguous United States. This national estimate is based on an analysis of select US cities that combines light detection and ranging (lidar) data with a validated analytical method for determining rooftop PV suitability employing geographic information systems. We use statistical models to extend this analysis to estimate the quantity and characteristics of roofs in areas not covered by lidar data. Finally, we model PV generation for all rooftops to yield technical potential estimates. At the national level, 8.13 billion m2 of suitable roof area could host 1118 GW of PV capacity, generating 1432 TWh of electricity per year. This would equate to 38.6% of the electricity that was sold in the contiguous United States in 2013. This estimate is substantially higher than a previous estimate made by the National Renewable Energy Laboratory. The difference can be attributed to increases in PV module power density, improved estimation of building suitability, higher estimates of total number of buildings, and improvements in PV performance simulation tools that previously tended to underestimate productivity. Also notable, the nationwide percentage of buildings suitable for at least some PV deployment is high—82% for buildings smaller than 5000 ft2 and over 99% for buildings larger than that. In most states, rooftop PV could enable small, mostly residential buildings to offset the majority of average household electricity consumption. Even in some states with a relatively poor solar resource, such as those in the Northeast, the residential sector has the potential to offset around 100% of its total electricity consumption with rooftop PV.
Export citation and abstract BibTeX RIS
1. Introduction
How much energy could be generated if all suitable roof area in the United States had solar photovoltaics (PV)? This quantity is the technical potential of rooftop PV—an established reference point for renewable technologies that quantifies the generation available from a particular resource considering its availability and quality, the performance of the technology capturing the resource, and the physical area suitable for development (e.g. see Lopez et al 2012). It does not consider economics, growth potential, or grid-integration factors; thus it is neither an endorsement of particular deployment levels nor a prediction of expected deployment. Rather, it represents an upper limit on a technology's current potential generation.
Various approaches are used for estimating rooftop PV potential, as summarized in Melius et al (2013) and Freitas et al (2015). These methods have been used to estimate the suitability of rooftops and PV technical potential for numerous cities and countries, such as San Diego (Anders and Bialek 2006), Philadelphia (Boz et al 2015), Seoul (Hong et al 2017), Chile (Campos et al 2016), Ontario (Wiginton et al 2010), Lisbon (Brito et al 2012), Brazil (Miranda et al 2015), Minneapolis (Risse et al 2014), Austin (Wiese et al 2010), and Canada (Pelland and Poissant 2006). New methods are being developed continuously, including ones that utilize machine learning (Assouline et al 2017), 3D city models (Lukac et al 2016), and layer on economic considerations (Rodriguez et al 2017).
Yet nationwide analyses of US PV technical potential have been limited. Google's Project Sunroof is primarily a resource for building-level PV suitability information, but it has made several statements about overall suitability trends as well (Fehrenbacher 2017). In addition, the National Renewable Energy Laboratory (NREL) generated a national supply curve for rooftop PV (Denholm and Margolis 2008).
This paper provides an updated analysis of the technical potential of rooftop PV across the entire United States. It extends the analysis described in a previous Environmental Research Letters article (Margolis et al 2017), which estimates the technical potential of rooftop PV systems in select US cities. For a more detailed discussion of the model described below, see Rooftop Solar Photovoltaic Technical Potential in the United States: A Detailed Assessment by Gagnon et al 2016.
2. Methods
Our analysis of US rooftop PV technical potential has three stages. First, we characterize roof area sizes and orientations for a subset of US buildings for which we have detailed light detection and ranging (lidar) data. Second, we build statistical models to estimate the quantity and characteristics of roofs in areas not covered by lidar data. Finally, we model PV generation for all rooftops to yield technical potential estimates.
2.1. Lidar data
Our lidar data, from the US Department of Homeland Security's Homeland Security Infrastructure Program for 2006–2014, cover approximately 23% of US buildings3. Margolis et al (2017) provide a detailed description of the initial geographic information system (GIS) processing of this data set, and discussions of trends observed in the areas covered by the lidar data. In brief, we define a set of shading, tilt, azimuth, and contiguous-roof-area criteria to determine what roof area is suitable for hosting rooftop PV. Roof area is considered unsuitable if facing northwest through northeast, tilting more steeply than 60 degrees, or enabling a PV system on the roof plane to produce less than 80% of the energy that would be produced by an unshaded system at the same location. A roof is considered suitable if it meets those criteria and has at least one contiguous plane with a projected horizontal footprint of 10 m2 or greater.
We apply these criteria to determine the quantity and characteristics of the roof area that could host PV for the 23% of US buildings covered by lidar data. To analyze trends by building size, we split the buildings into three sizes classes: small (less than 5000 ft2), medium (5000–25 000 ft2), and large (greater than 25 000 ft2).
2.2. Rooftop area and suitability modeling
To extend our analysis to all buildings nationwide, we build a model to estimate the quantity and characteristics of rooftops not covered by lidar data. Gagnon et al (2016) provides a full mathematical description of our modeling, including validation calculations and additional analytical techniques. Here we describe the modeling approach briefly.
2.2.1. Suitability modeling
First, we estimate the number of buildings with at least one suitable roof plane. In our lidar data, greater than 99% of medium and large buildings have at least one suitable plane. Therefore, we simplify by assuming that all medium and large buildings in the United States have at least one suitable roof plane, and we use data from the Commercial Building Energy Consumption Survey for estimates of building counts at the census-division scale (CBECS) (EIA 2012).
Because small buildings are more frequently unsuitable for rooftop PV, we build a model to estimate the fraction of suitable small buildings by US ZIP code. Using the observed trends in the lidar data, our predictive regression model leverages variables that are well correlated with PV suitability: locale description, census division, land cover classification percentage, and lidar coverage4. When we check the model's predictions against buildings that have lidar data, about 60% of predictions are within 10% of the observed lidar values, and about 80% of the predictions are within 20% of the observed values.
We also develop a regression model to predict the total number of small buildings in each ZIP code. The model inputs include building counts from the 2011 US Census American Community Survey (ACS), ZIP code population and population density, the northing of the ZIP code, and land cover classifications. About 50% of this model's predictions are within 10% of observed values, and about 70% of predictions are within 20% of observed values. The total numbers of small buildings are multiplied against the fractions that are suitable for PV to estimate the total number of suitable small buildings in each ZIP code.
2.2.2. Roof plane area
The process above estimates the number of suitable buildings but not the suitable roof area on those buildings. To estimate roof area, we use observations from the lidar data to characterize trends in the number and size of planes by building class.
For each building size class, we take uniform random samples of buildings in the ZIP codes where lidar data are available. We generate exponential fits of plane-area trends for each building size class. We then sample from the suitable building count distributions described in section 2.2.1 to estimate the total size and number of suitable roof planes nationwide. Because of the resolution of the input data (see section 2.2.1), small building estimates are at the ZIP code level, whereas medium and large building estimates at the census-division scale are distributed to states by population weight; this method of distribution assumes that the total rooftop area of medium and large buildings correlates linearly with population at a sufficiently large geographic scale5.
2.2.3. Roof plane orientation
Modeling the azimuth and tilt of roof planes is also important for modeling PV generation. We categorize each roof in our lidar-covered data set into one of 21 unique orientation bins, yielding probability trends for the roof characteristics of small, medium, and large buildings. For example, 18% of small building planes are south-facing with a tilt between 22 and 35 degrees. We then sample from these probability trends to estimate the characteristics of roof planes in areas without lidar coverage.
2.3. PV capacity and generation modeling
By combining the models of suitable building counts, roof plane numbers and sizes, and plane characteristics, we arrive at a prediction of the total amount and orientation of suitable roof area for all US buildings. Assuming that tilted roofs could hold PV modules at a 0.98 module-area-to-roof-area ratio and flat roofs at a 0.70 ratio, and multiplying the module area by the assumed power density of the modules, we obtain the PV capacity that could be installed on the suitable roof area6. Finally, we simulate the energy-generation potential of this PV capacity via NREL's System Advisor Model (SAM).
The solar resource and meteorological data used for this analysis are from the Typical Meteorological Year 3 (TMY3) data set of the National Solar Radiation Database (Wilcox and Marion 2008). The TMY3 data set includes hourly representative profiles for 1001 stations throughout the United States. For a given simulation, we use the TMY3 station profile closest to the boundary of the ZIP code under consideration7. Because the TMY3 stations are frequently located in or near major cities, the average distance from a ZIP code boundary to the nearest station is 9 km within our lidar data set.
Table 1. Assumptions for PV performance simulations.
| PV system characteristics | Value for flat roofs | Value for tilted roofs |
|---|---|---|
| Tilt | 15 degrees | Midpoint of tilt class (figure 1) |
| Ratio of module area to roof area | 0.70 | 0.98 |
| Azimuth | 180 degrees (south facing) | Midpoint of azimuth class (figure 2) |
| Module power density | 160 W m−2 | |
| Total system losses | 14.08% | |
| Inverter efficiency | 96% | |
| DC-to-AC ratio | 1.2 | |
Table 2. Total technical potential of rooftop PV in the contiguous United States.
| Building class (building footprint) | Total suitable area (billions of m2) | Installed capacity potential (GW) | Annual generation potential (TWh/year) | Annual generation potential (% of national sales) |
|---|---|---|---|---|
| Small (< 5000 ft2) | 4.92 | 731 | 926 | 25.0% |
| Medium (5000–25 000 ft2) | 1.22 | 154 | 201 | 5.4% |
| Large (> 25 000 ft2) | 1.99 | 232 | 305 | 8.2% |
| All buildings | 8.13 | 1118 | 1432 | 38.6% |
In addition to the geographic variation of solar resource, the equipment used and the design choices of the installer affect the technical performance of PV systems. We use a set of equipment and design assumptions that represent the average performance of PV systems installed in 2015 (table 1). To decrease the computational burden, similar planes are grouped into orientation bins and assigned the bins' midpoint tilt and azimuth values (figures 1 and 2). For example, any roof plane with a tilt between 34.8 and 47.4 degrees and an azimuth between 157.5 and 202.5 degrees is modeled with a tilt of 41.1 degrees and azimuth of 180 degrees. We use the PV performance values in SAM, in conjunction with the TMY3 solar resource and meteorological profiles, to estimate the annual electricity generation of the PV systems8.
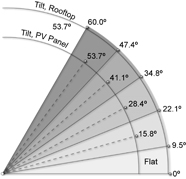
Figure 1. Tilt classes.
Download figure:
Standard image High-resolution image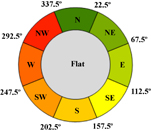
Figure 2. Azimuth classes.
Download figure:
Standard image High-resolution image3. Results and discussion
Table 2 shows the total technical potential of rooftop PV in the contiguous United States. Although 74% of the total rooftop area on small buildings is unsuitable for PV deployment, the sheer number of buildings in this class gives small buildings the greatest technical potential—constituting approximately 65% of the total rooftop PV technical potential. The following subsections break the results down geographically to show regional trends.
3.1. Small buildings
This subsection presents results only for small buildings (with footprints less than 5000 ft2). Because the national building stock contains about 78 million single-family households but only 3.2 million commercial buildings with a footprint of less than 5000 ft2, the results shown here can be interpreted as approximately representing trends in the residential sector.
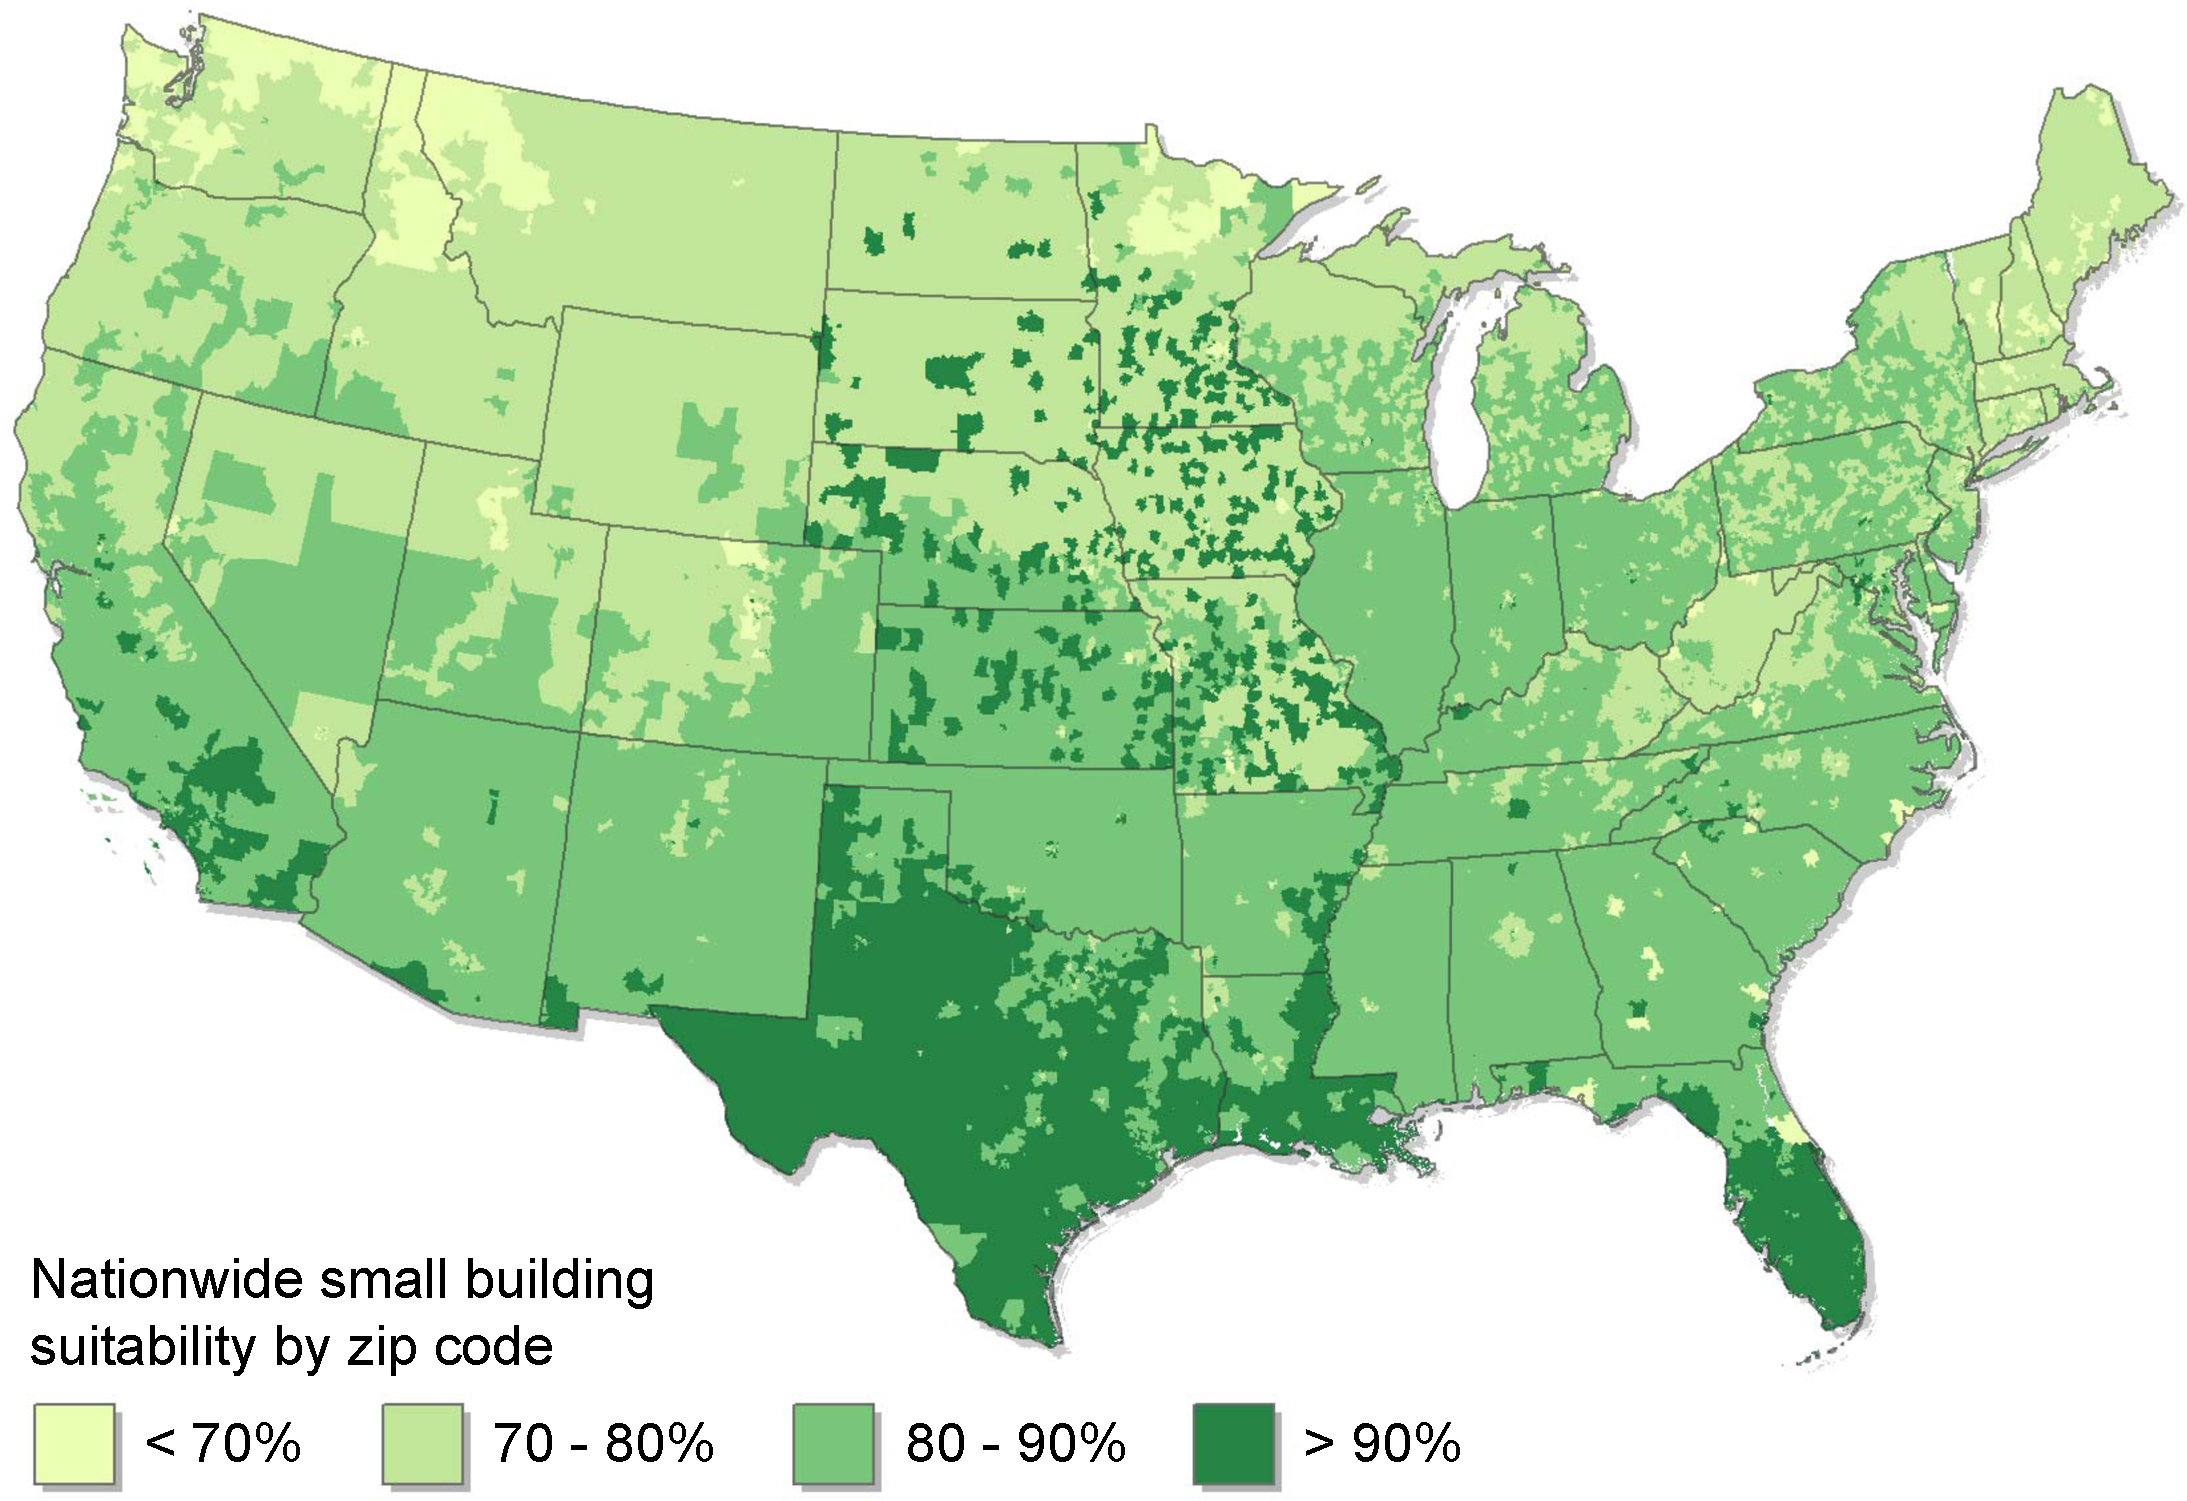
Figure 3 shows the percentage of small buildings that are suitable for PV by ZIP code9. Suitability is broadly high—although suitability dips below 70% in a small proportion of ZIP codes, in no state are less than 72% of the total number of small buildings suitable for PV. The states with the highest percentages of suitable rooftops are Florida (90%) and Texas (89%). Across the contiguous United States, 82% of small buildings are suitable for PV. This value aligns closely with similar suitability numbers from Google's Project Sunroof, which states that 79% of all buildings are suitable for PV (Fehrenbacher 2017).

Figure 3. Percentage of small buildings with at least one roof plane suitable for PV in each ZIP code in the contiguous United States.
Download figure:
Standard image High-resolution image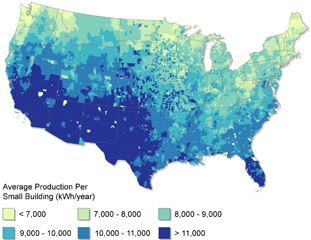
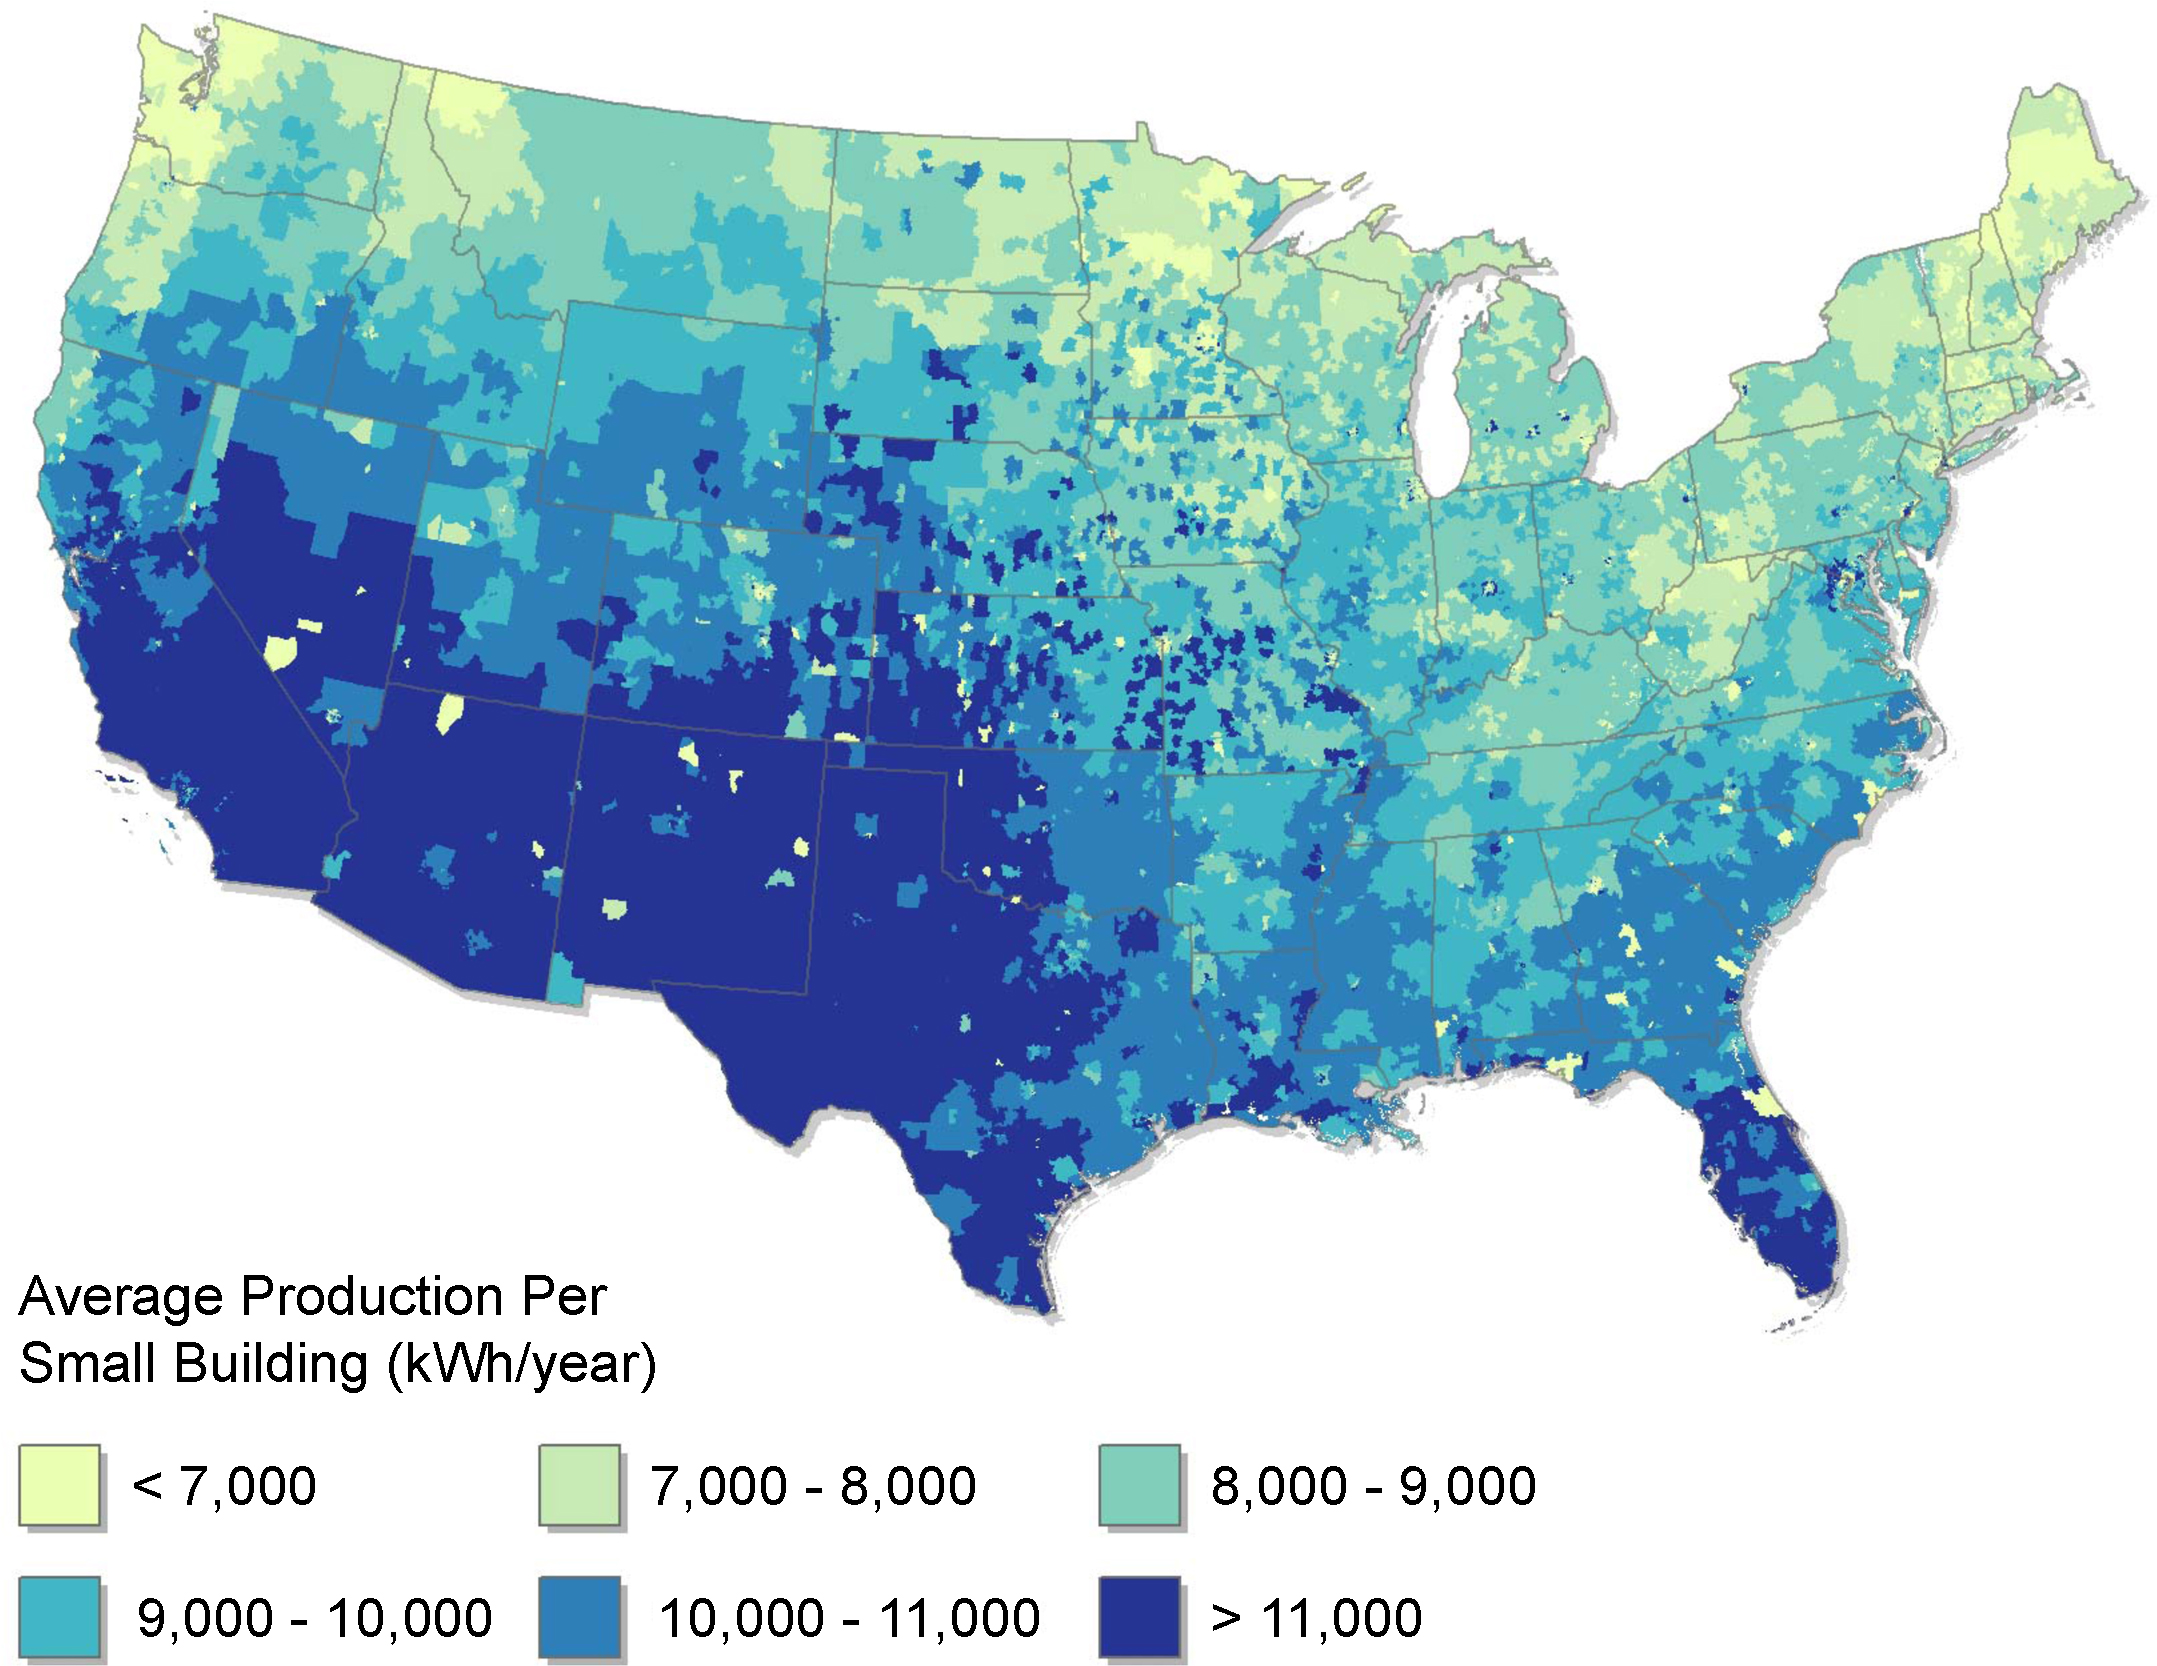
Figure 4. Average rooftop PV production per small building at the ZIP-code level.
Download figure:
Standard image High-resolution imageFigure 3 also shows several regional trends in small building suitability. The highest densities of high-suitability ZIP codes are in southern California, Florida, Louisiana, and Texas. The percentage of suitable small buildings tends to be higher in regions without significant tree canopy coverage; for example, the relatively unforested southeast portion of Washington has a higher percentage of suitability compared with the heavily forested northwestern part of the state.
Figure 3 should be interpreted with care, however. Developable area for rooftop PV is highly correlated geographically with population. Most potential for PV energy generation is condensed in the relatively small fraction of the country's land space that is developed. National maps such as the one shown in figure 3, therefore, can overemphasize the weight of rural regions if used to visually approximate a particular metric. Nonetheless, such maps can be useful for observing broad geographic trends. For example, the low suitability of northern Minnesota has little impact on the state's total technical potential, but it does illustrate the effect of heavy forestation on rooftop suitability.
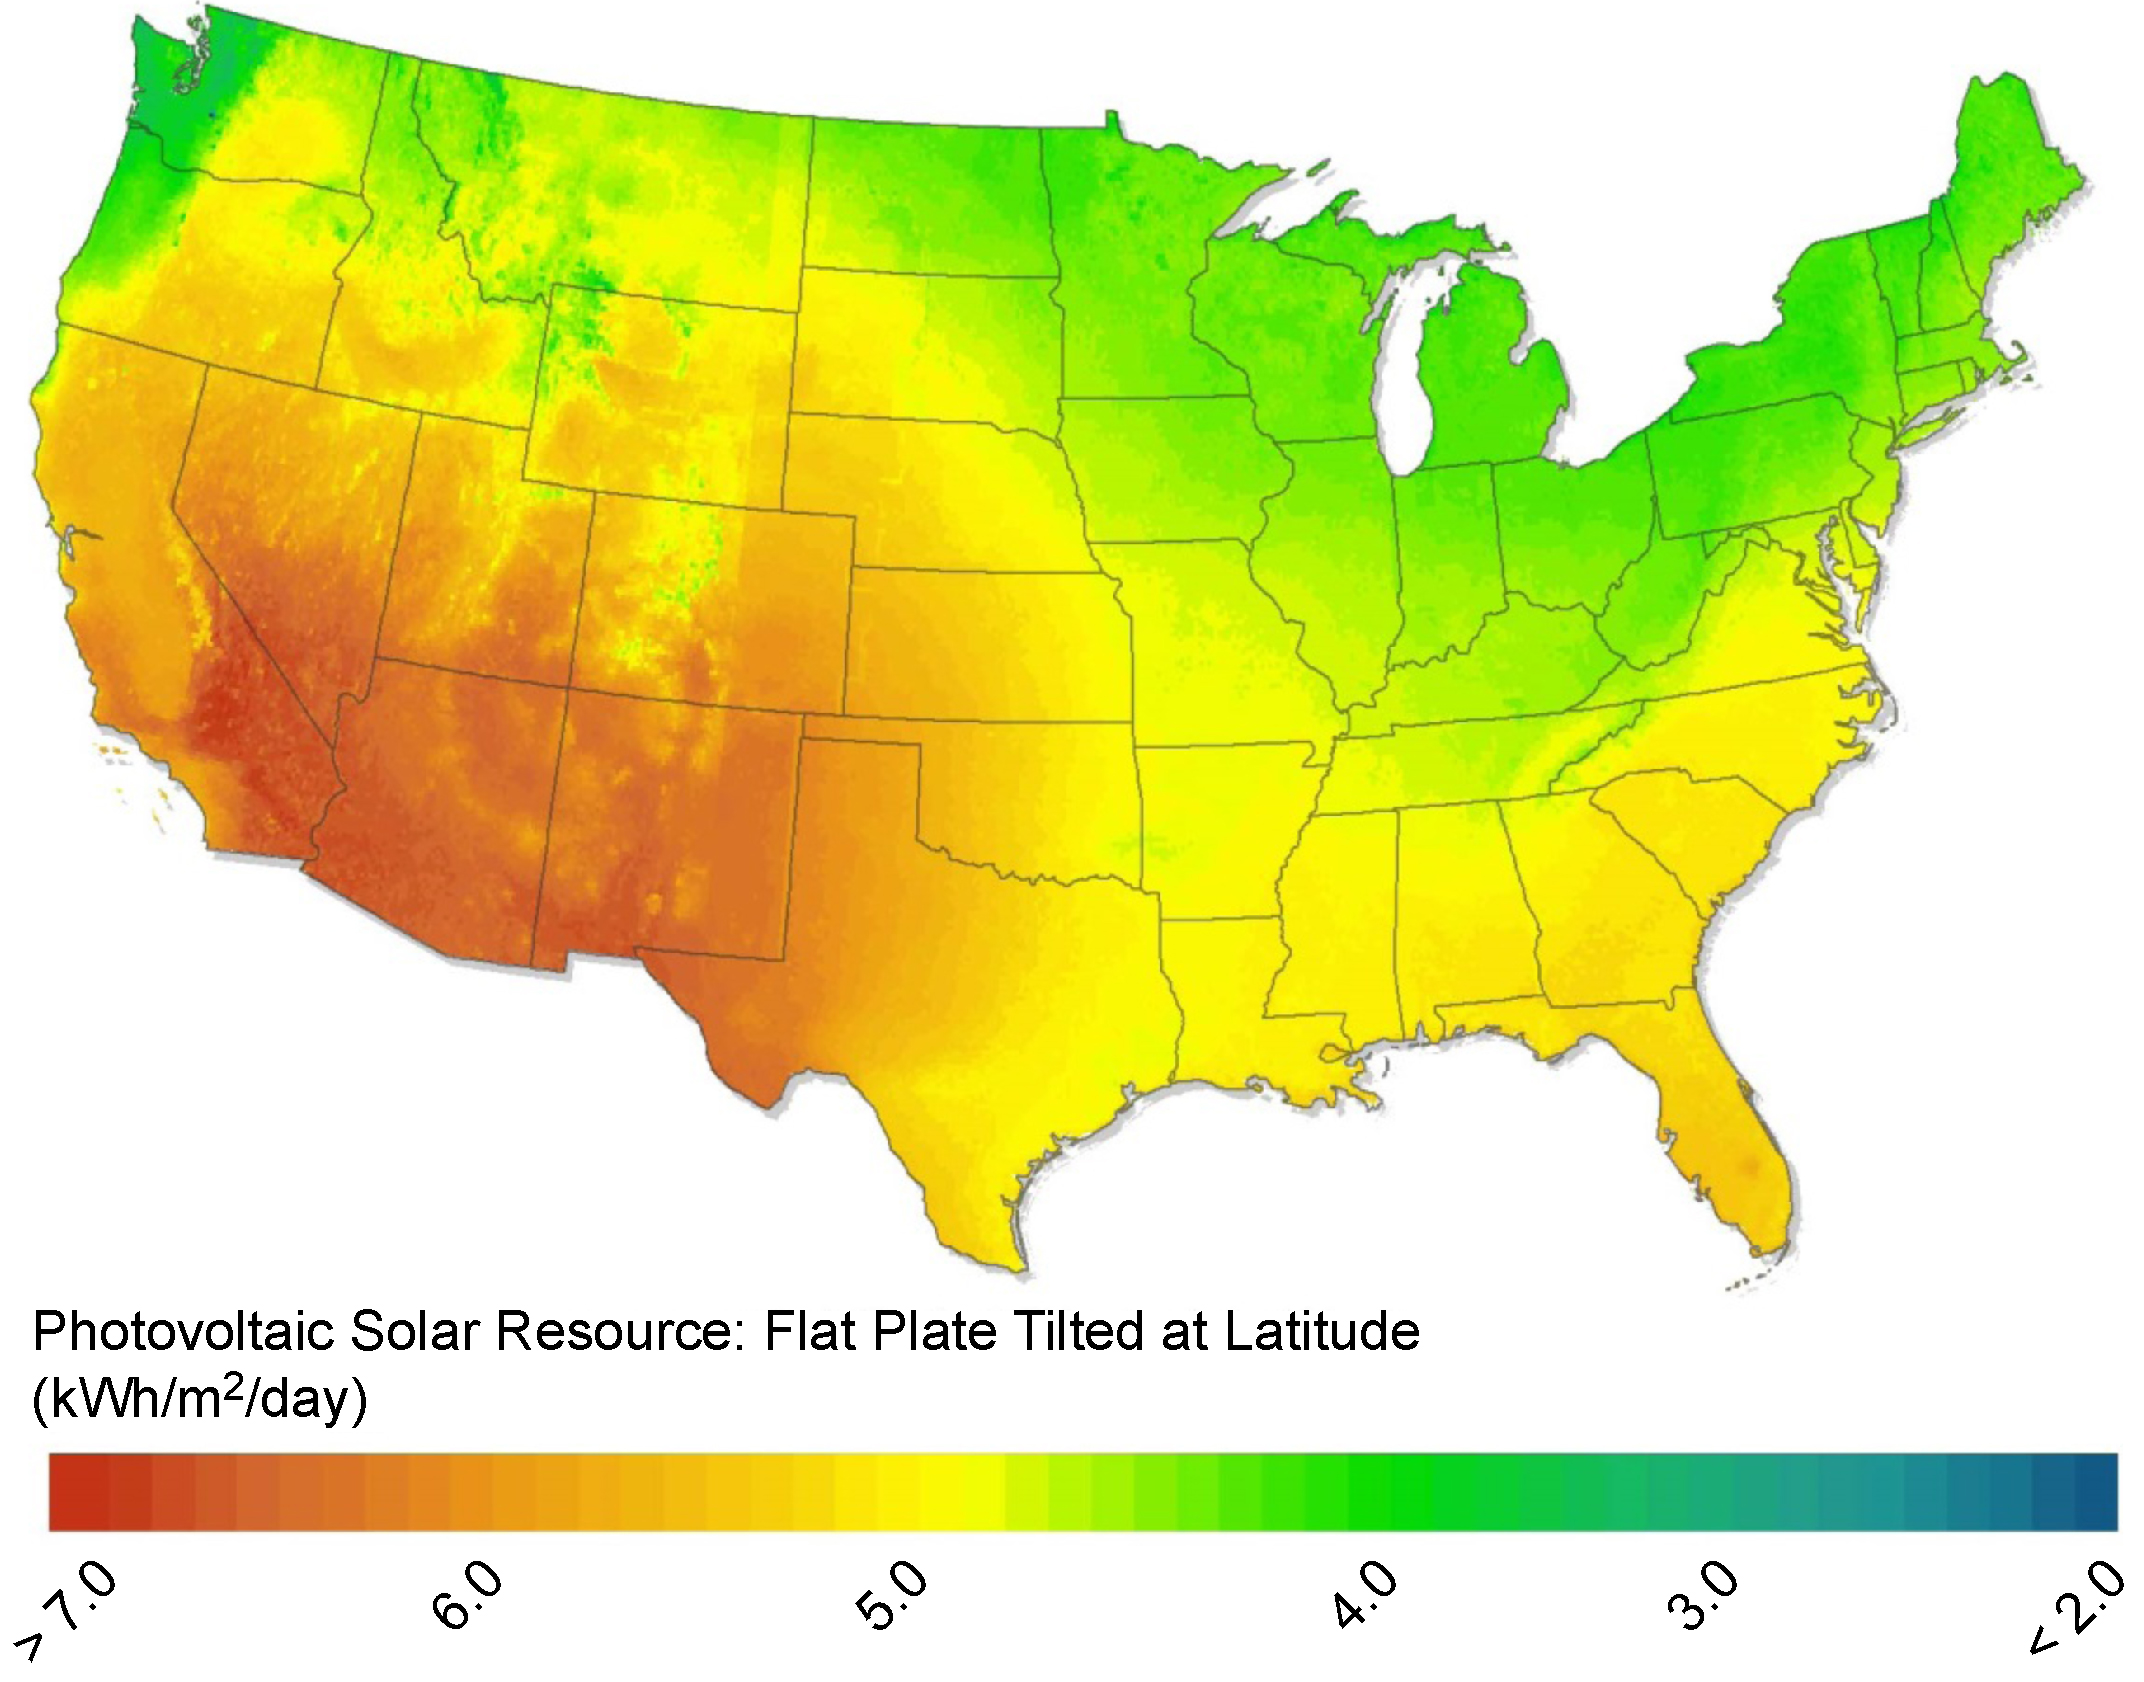
Figure 4 shows simulated annual electricity generation per small building at the ZIP-code level, based on our estimates of how much rooftop PV could be hosted10. For comparison, figure 5 shows the simulated energy generation from generic hypothetical PV panels tilted at latitude, illustrating the varying intensity of the US solar resource. Broadly speaking, average small building production strongly correlates with the solar resource; however, there exists significant local variation driven by average household footprint and suitability. For example, the simulated average production in Florida is 12 100 kWh/year/building (130% of the national average), owing to an above-average solar resource, but it ranges from 5300 kWh/year/building to 30 100 kWh/year/building on a ZIP-code level because of variation in suitability and building footprint. Differences in suitability can also drive differences in total productivity between regions with similar solar resources. For example, lower suitability in the South Atlantic states (see figure 3) leads to lower average small building productivity in those states compared with the Florida peninsula, despite a solar resource of similar quality.
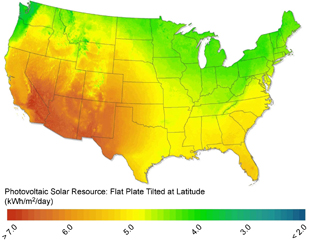
Figure 5. US solar resource.
Download figure:
Standard image High-resolution image
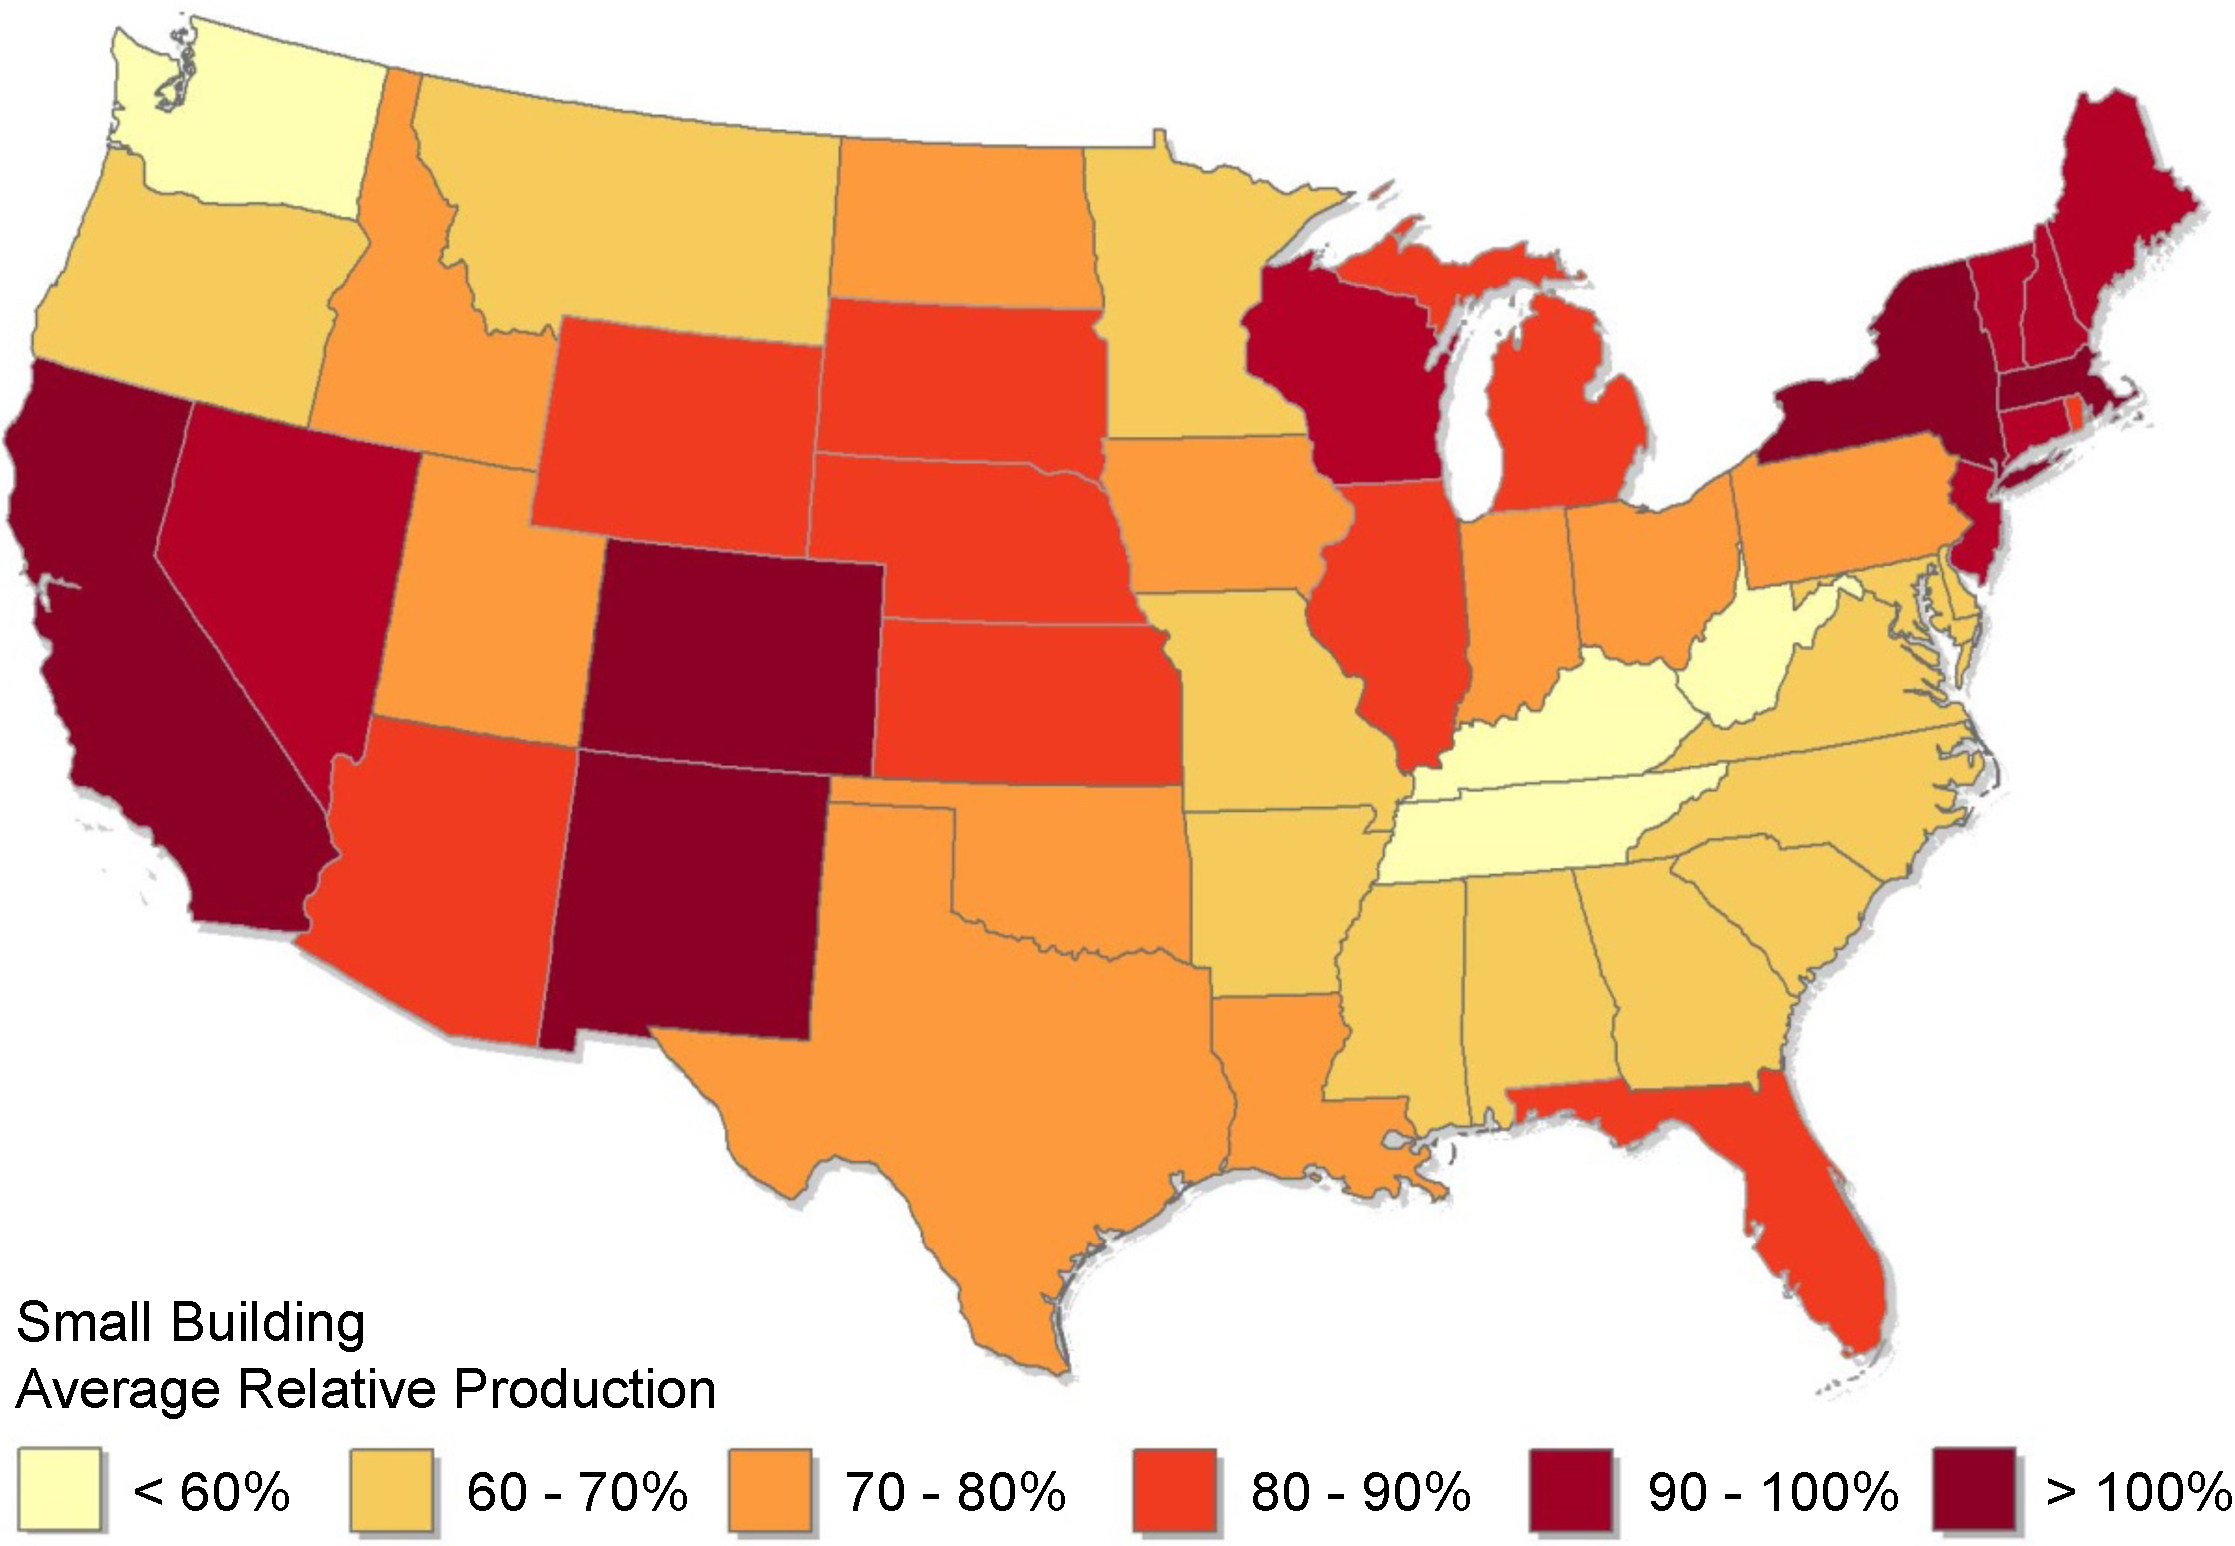
Figure 6. Small building average relative production at the state level.
Download figure:
Standard image High-resolution imageTable 3. Total estimated technical potential (all buildings) for rooftop PV by state.
| State | Annual generation potential (% of 2013 electricity sales) | Installed capacity potential (GW) | Annual generation potential (TWh/year) | Total roof area suitable for PV deployment (millions of m2) |
|---|---|---|---|---|
| California | 74.2% | 128.9 | 194.0 | 961 |
| Maine | 60.0% | 6.3 | 7.1 | 45 |
| Vermont | 60.0% | 3.0 | 3.4 | 21 |
| Rhode Island | 56.6% | 3.8 | 4.4 | 28 |
| New Hampshire | 53.4% | 5.3 | 5.9 | 38 |
| Connecticut | 49.8% | 12.8 | 14.8 | 95 |
| Massachusetts | 47.0% | 22.5 | 26.0 | 165 |
| Florida | 46.5% | 76.2 | 103.2 | 557 |
| Michigan | 45.9% | 42.1 | 47.3 | 303 |
| Oklahoma | 44.1% | 19.3 | 26.4 | 140 |
| Colorado | 44.0% | 16.2 | 23.5 | 119 |
| New Mexico | 43.4% | 6.1 | 10.0 | 45 |
| Missouri | 42.7% | 28.3 | 35.6 | 204 |
| Kansas | 41.7% | 12.5 | 16.6 | 90 |
| New Jersey | 40.4% | 24.9 | 30.1 | 184 |
| Wisconsin | 40.1% | 23.6 | 27.7 | 169 |
| Nevada | 39.6% | 8.7 | 13.9 | 67 |
| Maryland | 38.7% | 19.3 | 23.9 | 142 |
| South Dakota | 38.7% | 3.8 | 4.7 | 26 |
| Minnesota | 38.5% | 23.1 | 26.4 | 168 |
| New York | 37.4% | 46.6 | 55.3 | 340 |
| Illinois | 37.0% | 44.1 | 52.5 | 324 |
| Iowa | 35.5% | 14.0 | 16.6 | 99 |
| Ohio | 35.3% | 46.8 | 53.0 | 338 |
| North Carolina | 34.9% | 35.0 | 45.3 | 252 |
| Texas | 34.6% | 97.8 | 131.2 | 715 |
| Pennsylvania | 34.5% | 43.6 | 50.4 | 316 |
| Arizona | 34.4% | 16.3 | 26.1 | 114 |
| Utah | 34.3% | 7.2 | 10.4 | 52 |
| Oregon | 34.2% | 14.1 | 16.3 | 101 |
| Nebraska | 34.1% | 8.2 | 10.5 | 60 |
| Georgia | 33.8% | 34.6 | 44.1 | 251 |
| Arkansas | 33.3% | 12.2 | 15.5 | 88 |
| Virginia | 32.4% | 28.5 | 35.8 | 205 |
| Tennessee | 31.9% | 24.4 | 30.9 | 175 |
| Mississippi | 31.2% | 11.7 | 15.2 | 84 |
| Delaware | 31.0% | 2.9 | 3.5 | 20 |
| Louisiana | 29.8% | 20.1 | 25.6 | 146 |
| Alabama | 29.8% | 20.4 | 26.2 | 147 |
| Indiana | 29.5% | 26.3 | 31.1 | 188 |
| Montana | 28.0% | 3.2 | 3.9 | 21 |
| Washington | 26.6% | 22.8 | 24.7 | 164 |
| Idaho | 26.4% | 4.7 | 6.4 | 33 |
| South Carolina | 25.5% | 15.2 | 20.0 | 108 |
| Kentucky | 25.2% | 18.0 | 21.4 | 131 |
| North Dakota | 24.6% | 3.3 | 3.9 | 23 |
| West Virginia | 22.9% | 6.3 | 7.2 | 45 |
| Washington DC | 15.1% | 1.3 | 1.7 | 11 |
| Wyoming | 14.2% | 1.7 | 2.4 | 12 |
| Contiguous US Total | 38.6% | 1118 | 1432 | 8130 |

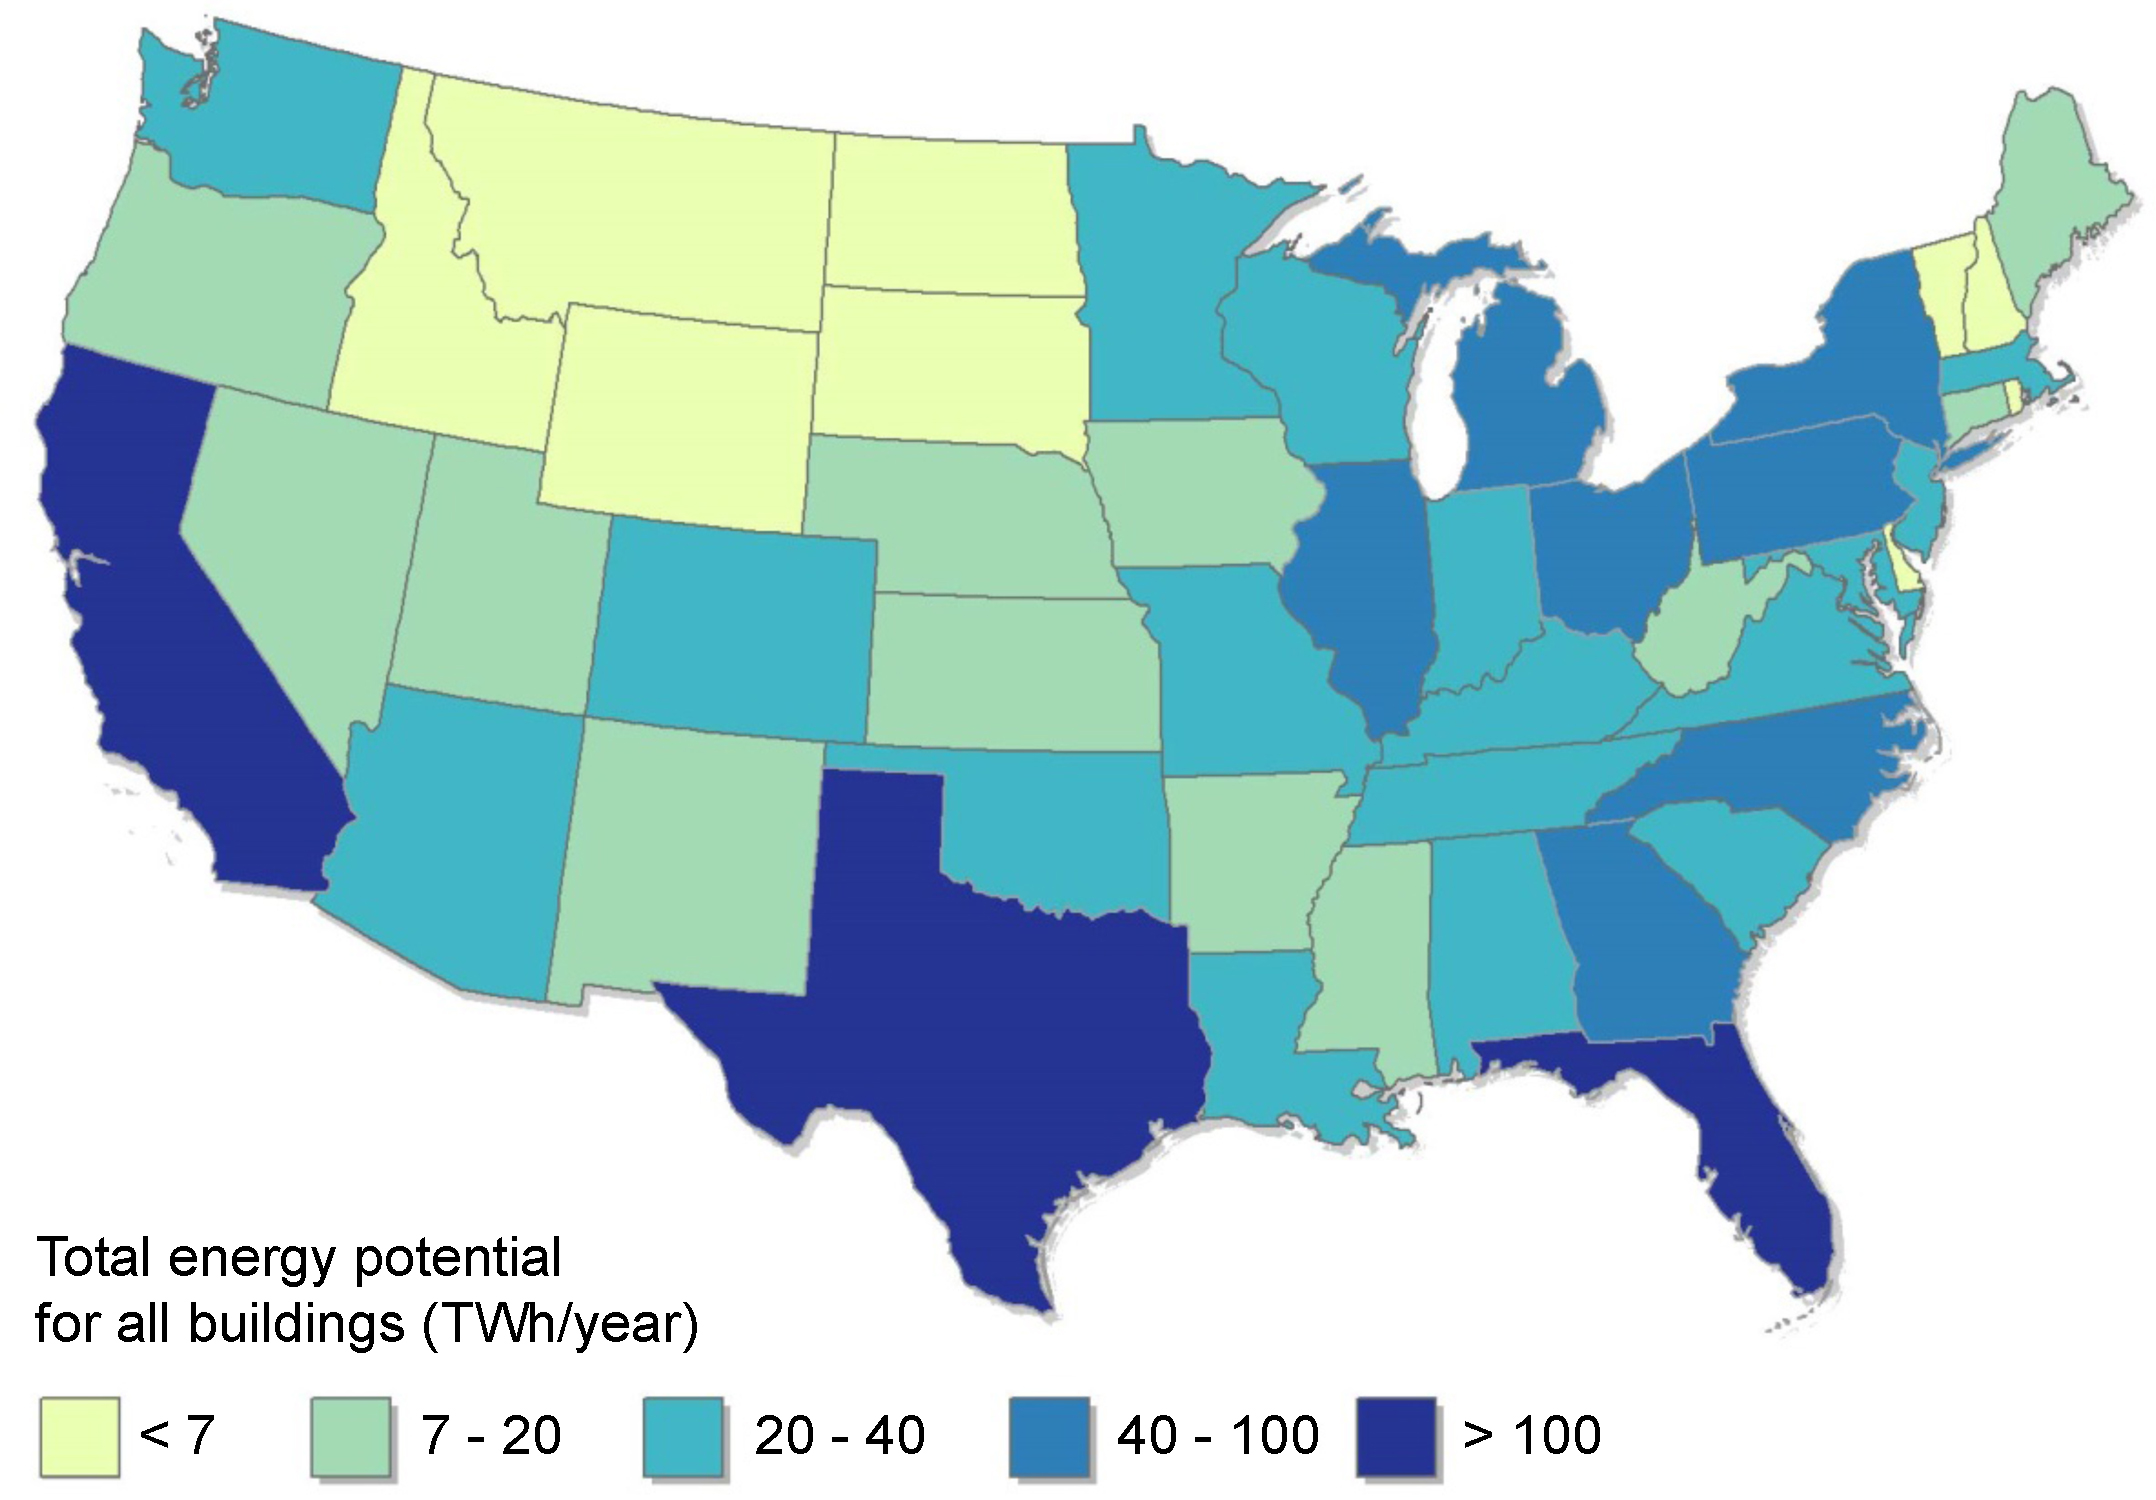
Figure 7. Total annual energy generation potential from rooftop PV for all building sizes.
Download figure:
Standard image High-resolution image
Figure 8. Potential rooftop PV annual generation from all buildings as a percentage of state total 2013 electricity sales.
Download figure:
Standard image High-resolution image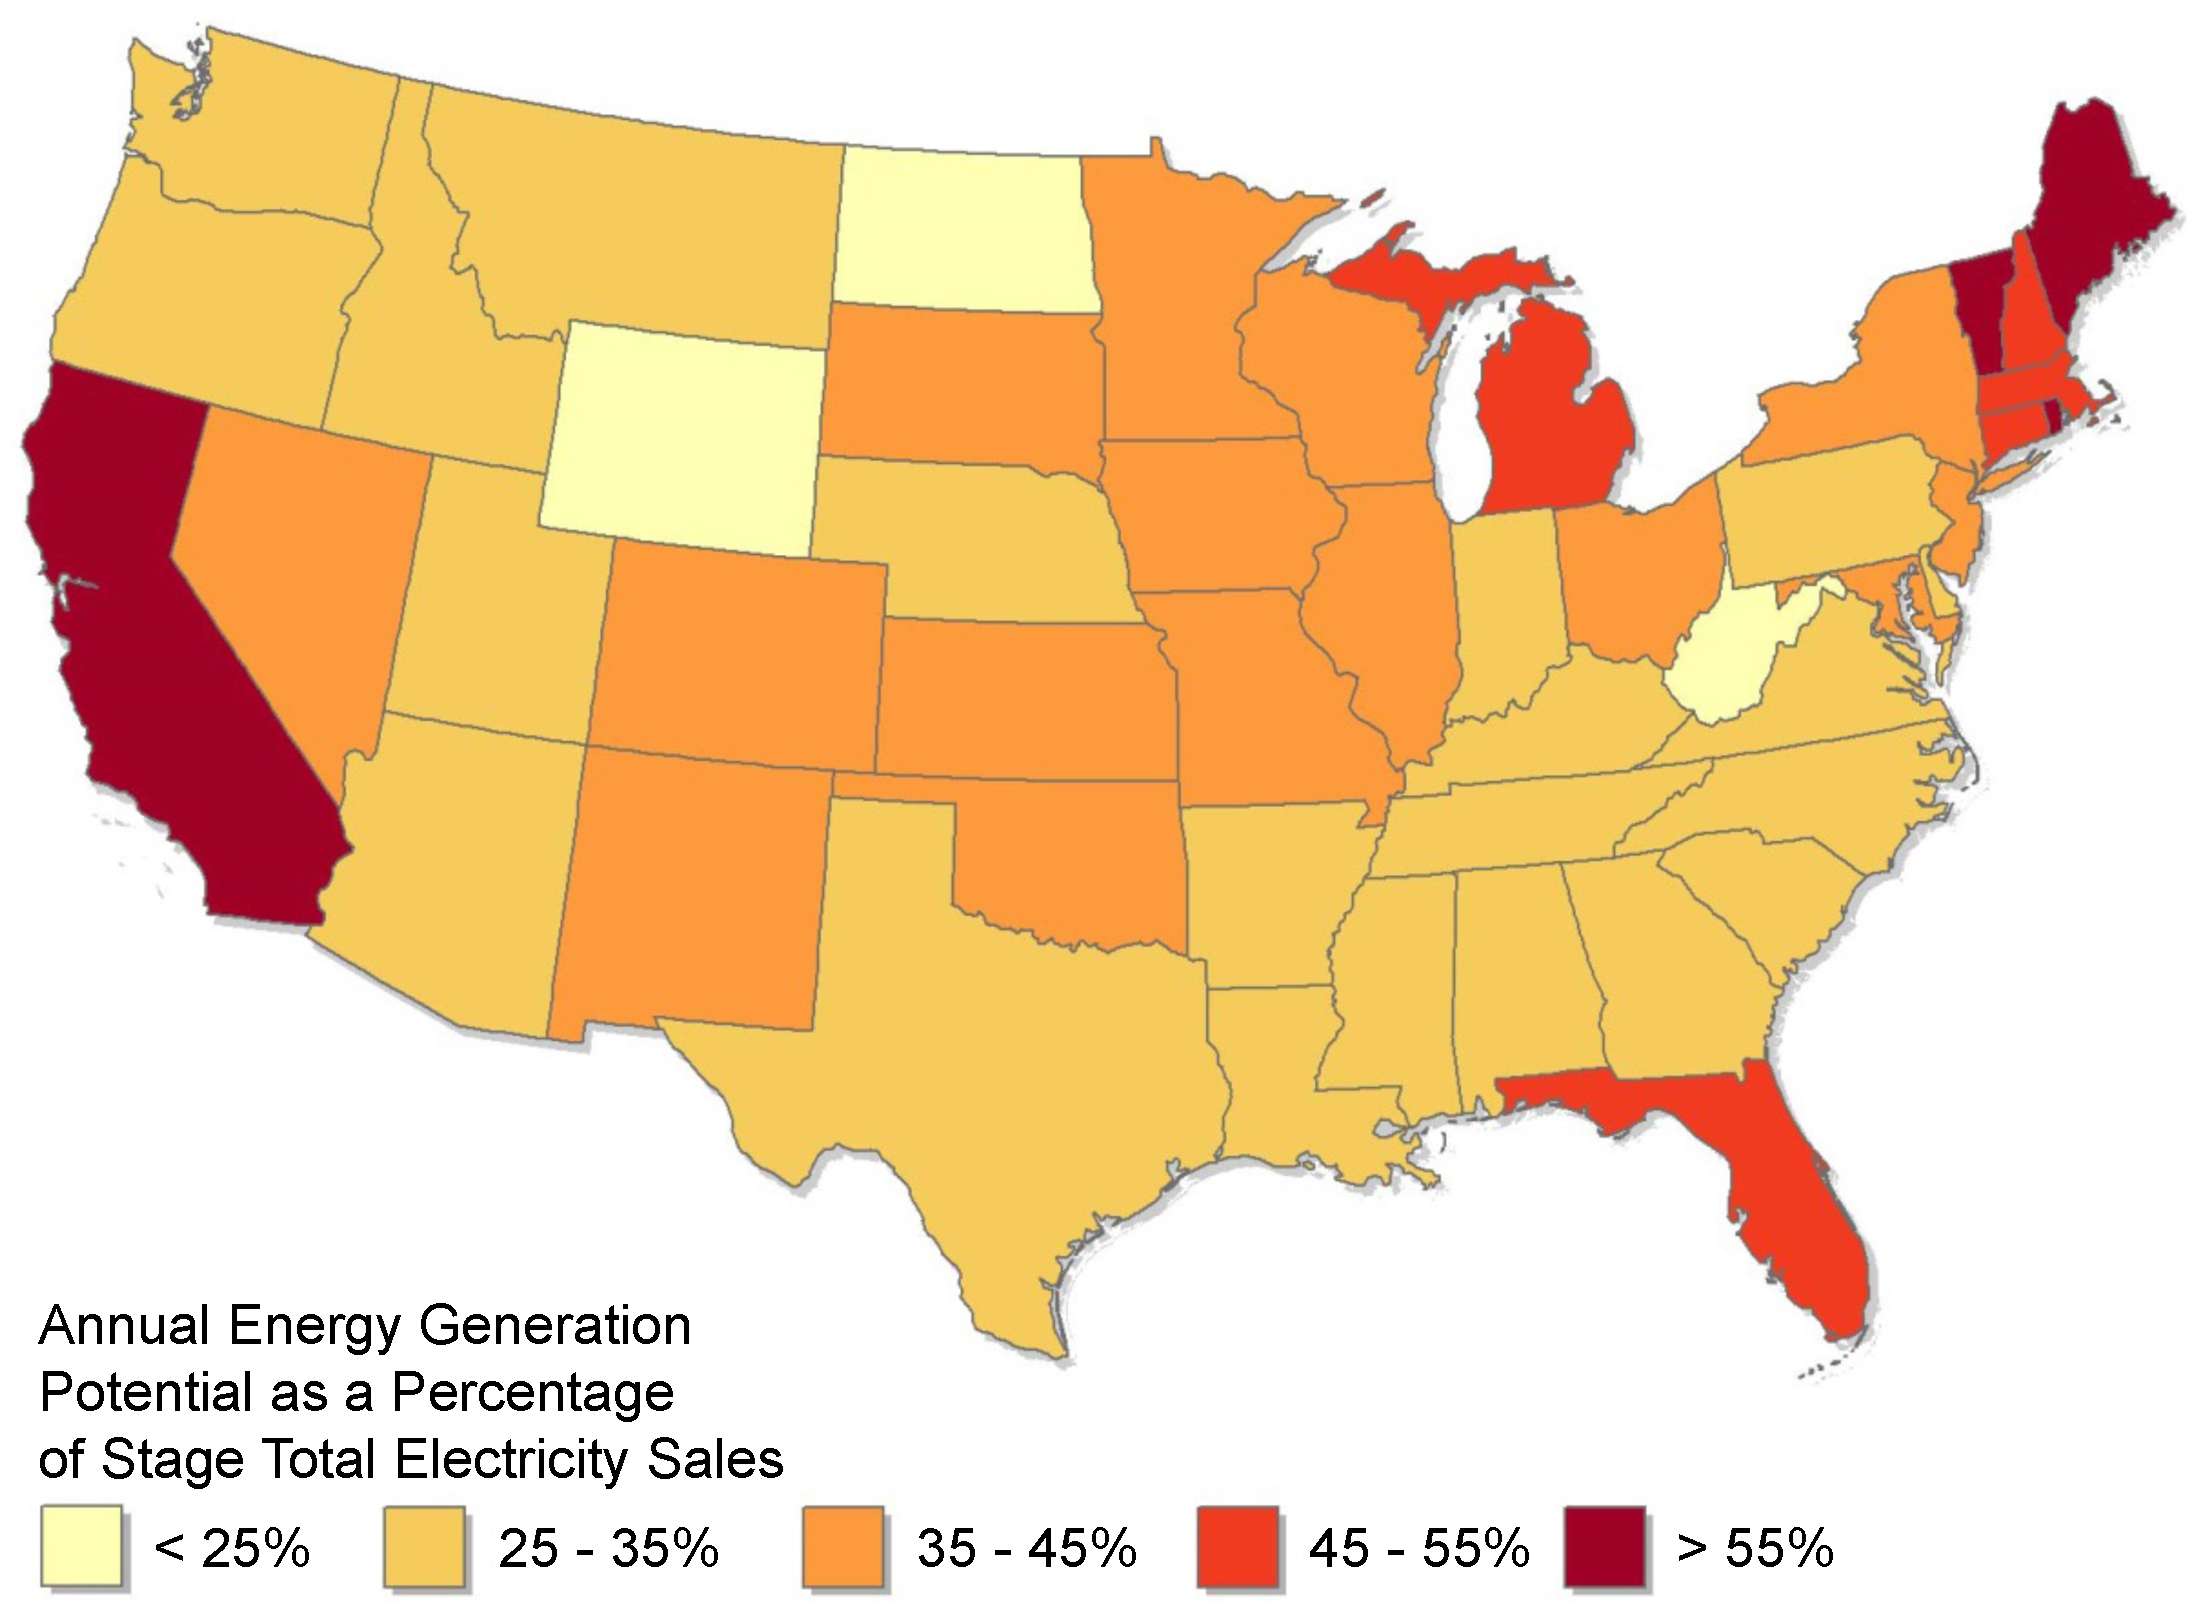
To help put this generation potential into context, figure 6 maps the average relative production of small buildings at the state level—a metric that we define as the annual rooftop PV generation of an average small building as a percentage of each state's average annual household electricity consumption. These results show that a relatively poor solar resource does not preclude the residential sector from offsetting a significant percentage of its electricity consumption via rooftop PV. An average small building across all of New England's states except Rhode Island could generate greater than 90% of the electricity consumed by an average household in the region. This result is driven primarily by the low average household consumption of 8011 kWh yr−1 in the region (70% of the national average), which is due in part to high use of natural gas and oil for heating as well as relatively low summer cooling requirements.
3.2. All buildings
This subsection presents the total national installed capacity and generation potential estimates for rooftop PV on all buildings (small, medium, and large buildings combined). Because our model analyzes medium and large buildings by state, not ZIP code, the combined results are presented at the state level. Table 3 shows the potential installed PV capacity, rooftop area suitable for development, and annual generation (in terawatt-hours and as a percentage of total electricity sales in 2013) by state. Figures 7 and 8 map the potential generation results.
The total technical potential of rooftop PV across all buildings in the contiguous United States is 1118 GW of installed capacity and 1432 TWh of annual energy generation, which equates to 39% of total national electricity sales11. Of individual states, California has the greatest potential to offset use—PV on its rooftops could generate 74% of the electricity sold by its utilities in 2013. A cluster of New England states could generate more than 45%, despite these states' below-average solar resource. Washington, with the lowest population-weighted solar resource in the contiguous United States, could still generate 27%. The best-performing six states—in terms of potential PV generation as a percent of total state sales—all have significantly below-average household consumption, suggesting the role an energy-efficient residential sector could play in achieving a high penetration of energy from rooftop PV.
Wyoming has the lowest potential for offsetting statewide electricity sales with rooftop PV, at 14%, because it has the highest per-capita electricity sales of any state at 30.3 MWh/year/person (250% of the national average), driven by very high electricity use in the industrial sector (60% of retail electricity sales). Washington DC has the second-lowest potential to offset electricity sales, at 15%; lidar data indicate that this unique, almost entirely urban district has only 17.4 m2 of suitable roof area per capita, which is much lower than the average of 24.9 m2 per capita throughout the rest of the lidar-covered regions.
Some states with below-average solar resource (such as Minnesota, Maine, New York, and South Dakota) have similar or even greater potential to offset total sales than states with higher-quality resource (such as Arizona and Texas). This highlights the observation that solar resource is only one of several factors that determine the offset potential.
Florida can offset 47% of its total consumption, despite having an average household consumption that is 130% above the national average. This is largely explained by significantly below-average electricity consumption outside of the residential sector, which makes total per-capita state sales slightly lower than the national average, plus high-quality solar resource and a high percentage of buildings suitable for PV. In contrast, the other South Atlantic states range from a potential 23%–35% of electricity offset, owing primarily to lower average suitability and higher per-capita electricity sales.
4. Conclusions
We present a detailed analysis of the technical potential of rooftop PV across the contiguous United States. The higher values we find supersede the values in a previous NREL estimate of rooftop PV technical potential (Denholm and Margolis 2008). The difference can be attributed to increases in module power density, improved estimation of building suitability, higher estimates of total number of buildings, and improvements in PV performance simulation tools that previously tended to underestimate productivity.
We made several noteworthy observations about the technical potential of rooftop PV. The percentage of buildings suitable for at least some PV deployment is high—82% for buildings smaller than 5000 ft2 and over 99% for buildings larger than that. Additionally, relatively poor solar resource does not preclude a region's residential sector from being able to generate a quantity of electricity on par with its consumption, as demonstrated in most of the Northeastern states.
In addition to these trends, we summarize the technical potential estimates of rooftop PV for the contiguous United States: 8.13 billion m2 of suitable roof area could host 1118 GW of PV capacity, generating 1432 TWh of electricity per year. This would equate to 38.6% of the electricity that was sold in the contiguous United States in 2013. These values help to inform conversations about the potential that rooftop PV might play in future electricity generation portfolios in the United States.
Acknowledgments
This work was funded by the Solar Energy Technologies Office of the US Department of Energy's Office of Energy Efficiency and Renewable Energy under contract number DE-AC36-08GO28308. The authors would like to thank Mike Gleason, Carolyn Davidson, Sean Ong, Rebecca Hott, Steve Wade, Eric Boedecker, Paul Denholm, Donna Heimiller, Michael Bolen, Laura Vimmerstedt, and Paul Donohoo-Vallett for their reviews and input. We would like to thank Adnan Zahoor, Britney Sutcliffe, and Julian Abbott-Whitley for their assistance in processing data. Lastly, we would like to thank Jarett Zuboy for his diligence and attention to detail while editing this article.
Footnotes
- 3
The lidar data covered 128 cities, and included first-return lidar data at 1 m by 1 m resolution as well as a set of polygon shapefiles of building footprints.
- 4
We followed the National Center for Education Statistic's 2006 locale descriptions, and land cover classifications from the National Land Cover Database for 2006.
- 5
These state-level estimates have an unquantified magnitude of uncertainty, because we do not have the data required to evaluate the error introduced with this weighting.
- 6
We assume modules are installed flush with tilted roofs, with minimal spacing required for racking. We assume modules on flat roofs are tilted 15 degrees south, with greater spacing to prevent excessive self-shading.
- 7
For medium and large buildings—which are analyzed at state-level resolution—the PV performance values are population-weighted averages of the PV performance values for each TMY3 station within each state.
- 8
Documentation of the mathematical models used by SAM can be found internally within the program, under the 'Help' section. For more information, see sam.nrel.gov.
- 9
Where lidar data exist, the map shows actual data. For the small fraction of ZIP codes with no predictor information, the model assumes the predictors of each ZIP code's nearest neighbor. This assumption has little impact on the results, because the ZIP codes with missing predictor information cover less than 0.01% of the country's population.
- 10
This average includes non-suitable small buildings. For example, if half of the buildings in a given ZIP code have an annual PV generation of 10 000 kWh yr−1, and the other half are completely unsuitable for PV deployment, the average small building PV generation potential of that ZIP code would be 5000 kWh yr−1.
- 11
As discussed in Gagnon et al (2016), this technical potential is notably greater than a previous NREL estimate (Denholm and Margolis 2008). The difference can be attributed to increases in module power density, improved estimation of building suitability, higher estimates of total number of buildings, and improvements in PV performance simulation tools that previously tended to underestimate productivity.