

Abstract
For the Northern Hemisphere extratropics, changes in the mid-latitude storm tracks are key to understanding the impacts of climate warming, but projections of their future location in current climate models are affected by large uncertainty. Here, we show that in spite of this uncertainty in the atmospheric circulation response to warming, by analysing the behaviour of the storms (or extratropical cyclones) themselves, projections of change in the number of the most intensely precipitating extratropical cyclones are substantial and consistent across models. In particular, we show large increases in the frequency of extreme extratropical cyclones (those above the present day 99th percentile of precipitation intensity) by the end of the century. In both Europe and North America, these intensely precipitating extratropical cyclones are projected to more than triple in number by the end of the century unless greenhouse gas emissions are mitigated. Such changes in extratropical cyclone behaviour may have major impacts on society given intensely precipitating extratropical cyclones are responsible for many large-scale flooding events, and associated severe economic losses, in these regions.
Export citation and abstract BibTeX RIS

Original content from this work may be used under the terms of the Creative Commons Attribution 3.0 licence. Any further distribution of this work must maintain attribution to the author(s) and the title of the work, journal citation and DOI.
Introduction
Increases in precipitation extremes are one of the most robust features of climate change [1–3], but the societal impact of these changes will be felt through changes in the frequency and intensity of high impact meteorological events. In the mid-latitudes, extratropical cyclones that form the oceanic storm tracks are the primary source of precipitation for Europe and North America [4] and generate many of the large-scale precipitation extremes associated with flooding and severe economic losses [5–7]. As such, understanding how extratropical cyclones will behave in the future is essential if society is to adapt to any changes in their location, intensity, or both. However, the mechanisms governing both the present day location of the storm tracks and the circulation changes governing their future location are complex and not well understood, reducing confidence in projections of climate change for the extratropics [8–10]. This first-order uncertainty drives an increasing need to distil societally relevant information on future regional weather extremes that we can have confidence in, despite the uncertainties in the large scale atmospheric circulation response to climate change.
In a warmer climate precipitation extremes are expected to increase in intensity and frequency [1–3], with their intensity increasing at close to the Clausius–Clapeyron relation (CC, ∼7% K−1) [2, 11]. The CC relation is a function of the increased water-holding capacity of the atmosphere as temperature increases, meaning a warmer climate is likely to have a higher frequency of intense events and will also feature events of unprecedented magnitude. The impact of precipitation extremes and their amplification through CC-type scaling makes understanding their spatial distribution and frequency in a warming climate particularly important. However, at the regional level, where impacts are felt, future extreme precipitation changes will also be affected by dynamical variations in the atmospheric circulation, such as the trajectories and frequency of extratropical cyclones. It is expected that whilst thermodynamic increases in precipitation extremes will be relatively homogenous, the dynamical component of change (e.g. the large-scale circulation patterns which govern the location of extratropical cyclones) is far less certain [12], adding complexity to constraining patterns of regional response and associated impacts of these extremes. The CC relationship provides a simple scaling for how the most intense precipitation may increase by a given amount per degree of warming, but it is critical to know where this intense precipitation will occur and the dynamical events those extremes will be embedded within.
The challenge in predicting the future response of regional storm tracks is derived from the multiple, competing processes which control the regional locations of the storm tracks and their varied response to related aspects of climate warming, such as equator-to-pole temperature gradients, sea-ice loss, patterns of sea-surface temperature and land-sea temperature contrasts, including feedbacks from the cyclones themselves [8, 9, 13–16]. This results in both systematic biases in their location in state-of-the-art models, such as the Atlantic storm track being too far south in many such models [17, 18], and the well documented uncertainty in projections of the future location of the storm tracks simulated by climate models [13, 19, 20]. Globally, it is expected that the overall number of extratropical cyclones will decrease [21]. It has been argued this is associated with both reductions in dry baroclinicity and also the increased efficiency of northward energy transport in a warmer, moister climate meaning fewer extratropical cyclones are required to achieve the same energy transport [1, 22]. Based on an analysis of the North Atlantic and Europe, it has also been suggested that the average dynamical intensity of extratropical cyclones may not increase, with less certainty about changes in the most dynamically intense events [19]. There is an overall expectation of a poleward shift of the storm tracks in both hemispheres, but at the regional level, confidence in their response to warming remained low in the most recent IPCC report [20]. The response of the storm tracks to climate change is critical to the future climate of Europe and North America, given these extratropical cyclones bring 60%–80% of precipitation to those regions [4], as well as extremes of both wind and precipitation [6, 23].
Given the expectation that the number of extratropical cyclones may decrease, and that their precipitation intensity will change, understanding the behaviour of the cyclones themselves is key to quantifying their future impacts. If any increases in the precipitation intensity of cyclones are of large magnitude, it may be that, in spite of the large uncertainties in the future spatial distribution of the storm tracks, it is still possible to derive robust information on the nature and frequency of future extreme precipitation changes at the regional level.
To test this hypothesis, we use a cyclone centred approach in order to directly quantify the response of cyclone-associated precipitation extremes to warming in climate model projections. This provides important additional information beyond that available from many existing studies that show increases in precipitation extremes through applying statistical analyses to climate model output, though without associating changes in precipitation to physical, meteorological phenomena (e.g. [1–3]). Such studies are less able to provide insights into the nature of the events causing these changes and the persistence or spatial aggregation of precipitation (see [3, 24]). Further, where short period accumulations are analysed with such statistical, grid-point approaches, there is a risk that conclusions might be tainted by model biases, for example, due to inadequacies of simulating convection by parameterisation [3]. Given the key role of large-scale, organised precipitation from extratropical cyclones to both water security and flooding in the extratropics [4–7], understanding potential changes in the meteorological phenomena which produce this precipitation is a critical issue for both scientists and policymakers. Here, we show that even with the well documented uncertainties in the future location of extratropical cyclones, we can still distil useful and clear information on the regional response in the frequency of the most intensely precipitating extratropical cyclones.
Methods
In this study, we apply an objective feature tracking algorithm to identify extratropical, synoptic scale, low-pressure storm systems in an ensemble of climate model simulations. This allows us to investigate their properties in a 'cyclone centred' framework throughout the entire cyclone lifecycle, in addition to analysing statistics of extratropical cyclone location, as is the approach in many studies [13, 14, 16–19, 25–28].
CMIP5 model data
Climate model output from simulations of the Coupled Model Intercomparison Project Phase 5 [29] (CMIP5) are analysed, using 16 models for which the required data was available (see supplementary table 1 which is available online at stacks.iop.org/ERL/13/124006/mmedia). It has previously been shown that climate models of this spatial resolution (100–300 km) have the capacity to reproduce the key structural features of extratropical cyclones (e.g. [30, 31]). The CMIP5 dataset also provides sufficient temporal and spatial coverage to allow comprehensive global scale analysis using consistent experiments from multiple models. Data at 6-hourly intervals for Northern Hemisphere summer (JJA) and winter (DJF) are analysed for the period 1990–1999 from the historical period and 2090–2099 from the RCP8.5 scenario. The ERA-Interim (ERAI) reanalysis [32] is also employed for the period 1990–1999 to provide a benchmark for model performance. It has previously been shown that ERAI compares well to other reanalyses and remote sensing data for the climate variables analysed here [30, 33, 34]. The Global Precipitation Climatology Project [GPCP, 35] data used in supplementary figure 2 is a 1° × 1° dataset produced by combining satellite and rain gauge data. The data used here spans the period 1998–2007, as in previous work by the authors [33]. When averaging data across the model ensemble, statistics are calculated on each model prior to averaging, such that ensemble mean changes are the mean of the climate change responses which have been calculated for each model. Where uncertainty ranges are shown in the text, they denote a 95% confidence interval on the ensemble mean.
Cyclone tracking and compositing
Extratropical cyclones are tracked using an objective feature tracking algorithm [35–38], used in many similar studies [4, 18, 19, 25, 26, 30, 33, 34, 39]. A full description of the tracking and compositing methodology is available elsewhere [25, 40]. In summary, cyclones are identified as features exceeding 1 × 10⁻⁵ s−1 in the 850 hPa relative vorticity field, truncated to T42, in 6-hourly data and are then combined into individual cyclone tracks. The truncation emphasises the synoptic scale, such that mesoscale or smaller (e.g. convective) storm systems are not included in this analysis. Only tracks with both their vorticity and precipitation maxima north of 30°N, with a lifetime of at least 2 days and which travel at least 1000 km are retained in this analysis. Justification of these latter thresholds and the insensitivity of conclusions to their values has been shown in other studies [18, 19, 26, 30, 33].
Compositing of the cyclones involves averaging the spatial fields around cyclone centre at a consistent phase in the cyclones' life cycle. The phases in the cyclones' life cycle are identified relative to either the time of maximum along-track vorticity or to that of maximum precipitation intensity (defined by the mean precipitation within 5° of the cyclone centre), which are individually evaluated for each cyclone. When spatial maps of composite precipitation are presented (see supplementary material) these are first rotated in the direction of cyclone propagation. When analysing cyclones using feature tracking algorithms, there is some sensitivity to the particular algorithm selected, though differences generally only occur in the statistics of weak cyclones, rather than the behaviour of stronger cyclones or changes in total number, as is the focus here [41].
Cyclone associated precipitation
The approach used to identify cyclone associated precipitation has previously been applied by the authors, with the methods explained in detail elsewhere [4, 26, 33]. Using this approach, each cyclone has a fixed radius of influence from the cyclone centre, with all precipitation falling within that radius assumed to be associated with the cyclone. This procedure is applied at each 6-hourly timestep in the model data, such that the total cyclone associated precipitation at each gridpoint for each season is the sum of these 6-hourly precipitation accumulations. The selected radius (R) is seasonally and regionally dependent, based on the typical radius of influence across the ensemble throughout the cyclone lifecycles (not shown, though see [4, 26]).
Applying this approach, total seasonal precipitation at a grid point (P) can be expressed as:

where Pc is the total cyclone associated precipitation (the precipitation falling within distance R of a cyclone centre), with r as a residual term which includes convective events, orographic precipitation or any precipitation on long trailing fronts which may not be identified by this method. Previous work has shown that varying R may influence the total cyclone associated precipitation, but is less likely to have a material influence on the qualitative nature of future changes [26].
Results and discussion
We first assess whether the CMIP5 models are able to reproduce the observed lifecycle of cyclones, since this is crucial to have confidence in projections derived from the models. Composite cyclone lifecycles of precipitation and vorticity (a metric for dynamical intensity, see Methods) are shown in figure 1, together with those derived from the ERA-Interim reanalysis [32] (ERAI) for comparison. This gives a summary of the mean lifecycle of all cyclones and the mean model bias relative to ERAI. Figure 1 shows that the models are able to represent both the dynamical lifecycle of the cyclones in the present day and the associated precipitation, which peaks prior to maximum dynamical intensity, as expected given the role of latent heating in intensifying these systems [30, 33]. There is some apparent underestimate in both the vorticity and precipitation intensity in the summer (June–August, JJA) compared to ERAI, though there is large observational uncertainty and model estimates fall within those obtained from ERAI and GPCP (see supplementary figure 2). In contrast, the winter (December–February, DJF) intensities compare closely. The ability to represent the lifecycle of the average cyclone provides some confidence that the models, in spite of their relatively coarse resolution, are able to represent the key physical processes governing cyclone behaviour at the synoptic scale, particularly in winter when they typically have their greatest impact. This is further supported by the fact that the spatial distribution of precipitation around cyclones is comparable to ERAI (supplementary figure 1).

Figure 1. Precipitation (a), (b) and vorticity (c), (d) composite cyclone lifecycles for DJF (a), (c) and JJA (b), (d). Ensemble mean precipitation (a), (b) and vorticity (c), (d) is shown as a solid/dashed black line with 95% uncertainty intervals of the ensemble mean as yellow/pale blue for 20th/21st century. Precipitation (a), (b) and vorticity (c), (d) in ERAI is shown as a solid red line. In (c) and (d) the lines and uncertainty intervals mostly overlap. Time is shown in hours relative to maximum vorticity. Precipitation is the 6-hourly precipitation accumulation up to each timestep, averaged within 5° of the cyclone centre.
Download figure:
Standard image High-resolution imageIn future projections, the total number of cyclones reduces and the mean precipitation intensity increases. This shift in intensity is seen in figures 2(a) and (b) where the number of cyclones with extreme precipitation increases in both winter and summer. The average precipitation intensity increases throughout the whole composite cyclone lifecycle in both seasons, and by almost 20% at maximum intensity (figure 1 and table 1), with decreases in the number of cyclones occurring in both seasons (table 1). By ranking the cyclones by precipitation intensity and comparing the frequency with which present day thresholds (e.g. the absolute precipitation associated with the 1990–1999 99th percentile of cyclone associated precipitation) are exceeded in the future, we show significant changes in the frequency of the most extreme, and often most damaging, cyclones (figure 2(c)). In particular, those above the present day 99th percentile triple in number (increases of 180% ± 30% for DJF and 230% ± 70% for JJA) by the end of the century—approximately 3.6–10.3 events per DJF and 2.7–8.6 per JJA on average (see table 1). Those above the 95th percentile increase by 80% ± 10% in DJF and 100% ± 30% in JJA across the Northern Hemisphere.
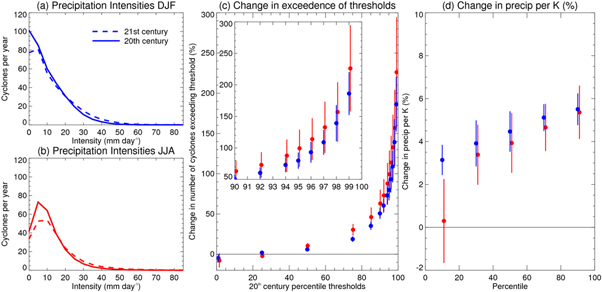
Figure 2. Frequency of occurrence (cyclones per year) against maximum precipitation intensity (mm day−1) in (a) DJF (blue) and (b) JJA (red) in 20th (solid) and 21st (dotted) centuries. (c) Change in number of cyclones exceeding 20th century precipitation thresholds (e.g. absolute precipitation intensity associated with the 20th century 99th percentile event) in DJF (blue) and JJA (red), with the extreme values replicated in the inset. (d) Change in precipitation intensity per Kelvin increase in near surface air temperature for cyclones between quintile thresholds (e.g. 0%–20%) from 20th and 21st centuries for DJF (blue) and JJA (red). For (c) and (d) 95% confidence intervals for the model ensemble mean are shown. Precipitation is for the 6-hourly accumulation at maximum intensity, surface temperature is the mean during the 24-hour period leading up to maximum intensity.
Download figure:
Standard image High-resolution imageTable 1. Ensemble mean maximum precipitation (mm day−1) and total number of cyclones (per season). DJF in bold, JJA in regular text. Uncertainty ranges show 95% confidence intervals for the ensemble mean.
| Season: DJF JJA | ERA-Interim | 20th century | 21st century | Difference (%) |
|---|---|---|---|---|
| Maximum precipitation | 8.81 | 9.2 ± 0.6 | 10.8 ± 0.8 | 17.9 ± 2.8 |
| 10.0 | 9.0 ± 0.8 | 10.6 ± 1.2 | 18.9 ± 4.5 | |
| Number of storms | 373 | 364 ± 22 | 346 ± 22 | −0.48 ± 0.13 |
| 283 | 268 ± 19 | 246 ± 17 | −8.0 ± 2.9 |
These projected changes are thermodynamically driven, as there are no significant changes in the dynamical intensity of the extreme cyclones, as measured by either vorticity or maximum windspeed (supplementary figure 3). Any changes in dynamical intensity would likely have a direct impact on precipitation via increases in forced ascent at the warm front. Instead, the increases in precipitation intensity are related to changes in near surface air temperature around the cyclones (figure 2(d)), which is itself similar to the warming found in the seasonal mean (supplementary figure 4). It is notable that the changes in precipitation with temperature (figure 2(d)) for more intensely precipitating cyclones (>80th percentile) scale at closer to the CC relation (∼7% K−1), though remain below it, whilst the weakly precipitating cyclones in winter scale at rates expected from the radiative constraints (∼2%–3% K−1) on mean evaporation changes [2, 11]. These changes in precipitation intensity are comparable to other studies of extratropical extremes [1–3], suggesting the most intense cyclones are more efficient at saturating the atmosphere, leading to precipitation increases comparable to CC. Given dynamical intensity is not affected, the super-CC type scaling that has been found in the tropics does not occur [1–3]. Near surface specific humidity scales at near CC for all cyclones (supplementary figure 5). From a dynamical perspective, large-scale surface convergence and vertical ascent in the cyclones is likely to be key to the differential responses observed in figure 2(d). This is implied by the scaling of precipitation, temperature and surface specific humidity around cyclones with warming [1, 2] (figure 2(d), supplementary figures 4 and 5). In extratropical cyclones, forced ascent of low level moist air drives precipitation and the more intensely precipitating systems interact more vigorously with the boundary layer [42].
Turning to regional patterns of change, we repeat this analysis after subsetting the cyclones by the location of their maximum precipitation intensity. Doing so allows us to evaluate whether the hemispheric wide changes are regionally consistent (figure 3). We show that, to first order, the findings of a large increase in the number of intensely precipitating cyclones are robust across both winter and summer in our focus regions of the Atlantic, Pacific, North America and Europe (supplementary figure 7). In North America, the most extreme (above the 1990–1999 99th percentile) cyclones more than triple in number in DJF and JJA (increases of 230% ± 130% and 200% ± 130%, respectively), with even greater increases in Europe (320% ± 110% and 390% ± 150%). The large magnitude of these changes is remarkable and consistent across the model ensemble in all regions, though with greater uncertainty in the absolute values than for the whole Northern Hemisphere.
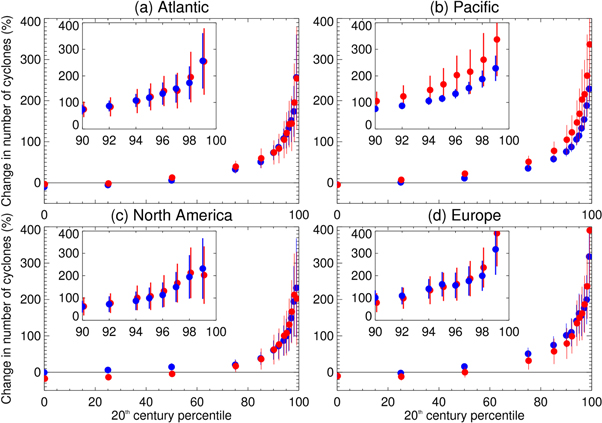
Figure 3. As for figure 2(c), but showing change in the number of cyclones exceeding 20th century thresholds for storms which achieve their maximum precipitation in the (a) Atlantic, (b) Pacific, (c) North America and (d) Europe regions as defined in supplementary figure 5.
Download figure:
Standard image High-resolution imageWithin the well documented uncertainty in the future location of extratropical cyclones, there are some broad regional expectations of change, for example, an extension of the Atlantic storm track into Western Europe is expected in winter with a decrease in cyclone frequency in the Mediterranean in both summer and winter [14, 16, 19, 21, 26]. To assess the local impact of these changes (and uncertainties) in cyclone frequency, we extend our analysis to identify changes in cyclone associated extreme precipitation at each grid point. Given the uncertainties in the future location of the storm tracks, any such analysis of 'on the ground' precipitation changes might be expected to exhibit less consensus across the model ensemble, even with the robust and large increases in intensely precipitating cyclones in each region that we have shown.
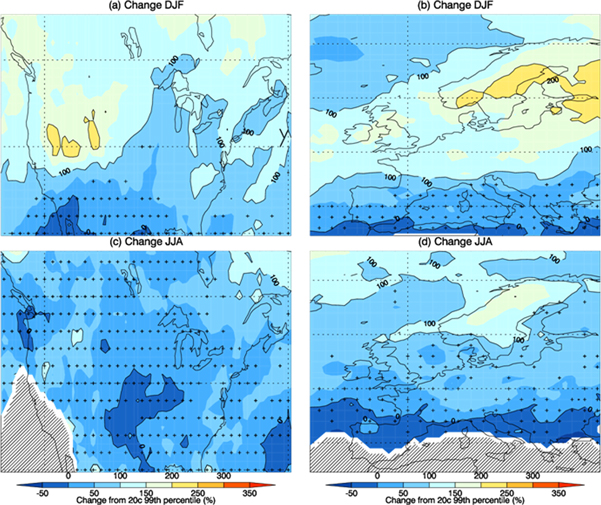
The projected change in the accumulation of precipitation associated with extreme cyclones (precipitation intensity above the present-day 99th percentile) is evaluated for each model (see Methods and 4, 26, 33) and the multi-model mean response is shown in figure 4 for North America and Europe. In DJF, there is a clear pattern of change in both regions. In Northern and Western Europe, the total precipitation associated with extreme cyclones triples in some regions (increases of 200%) with equivalent increases on the west coast of North America. In both North America and Europe, the uncertainty in the southern sectors is greater, associated with inter-model uncertainty in the frequency of cyclone occurrence in those areas, though the models still indicate increases in the total extreme cyclone precipitation in most of the two regions. There is less consensus in JJA in both regions, consistent with the uncertainty in the future location of the summertime storm tracks [19]. These extremes map onto changes in total cyclone associated precipitation (from all extratropical cyclones) which are a balance of decreases in number and increases in intensity (supplementary figure 8).
Figure 4. Percentage changes in the accumulated extreme cyclone associated precipitation (> 20th century 99th percentile) for North America (a), (c) and Europe (b), (d) for DJF (a), (b) and JJA (c), (d). The 0% contour is where there is no change from 20th to 21st century. Data is masked where either the 20th or 21st century total precipitation is less than 0.5 mm day−1. Stippling indicates where fewer than 75% of the models agree on the direction of change.
Download figure:
Standard image High-resolution image
In individual models, for both seasons and regions, extreme precipitation totals represent as much as a four-fold increase (300% more extreme precipitation) compared to the present day, though with large spread across the ensemble (not shown). From a flood management perspective, the impact of any such changes may be highly consequential and even a 50% increase in extreme cyclone associated precipitation accumulations may have material flooding implications. Associated with the increase in total extreme cyclone precipitation, the frequency of extreme cyclone precipitation events is far greater than in the present day, which again stresses the importance of changes to these events for water management and agriculture (supplementary figure 10). In DJF in particular, the large increases in extreme cyclone associated precipitation mean that a far greater fraction of the total precipitation will be contributed by organised, large-scale intense precipitation events (supplementary figure 9). These results show that in spite of the well documented uncertainties in the future location of the storm tracks, it is still possible to distil useful and clear information which shows dramatic shifts in the nature and intensity of large-scale, organised precipitation in response to a warming climate.
Conclusions
Seasonal mean precipitation is projected to change by less than ±20% in most of Europe and North America in both summer and winter [20]. These mean changes must be interpreted and managed in the context of the changing behaviour of the extratropical cyclones that bring the majority of the precipitation in both regions. In this study we have shown that in spite of the expected reduction in the total number of extratropical cyclones in the Northern Hemisphere, there is a substantial increase in the number of intensely precipitating extratropical cyclones, with a tripling in the frequency of those above the present day 99th percentile. This is part of a more general shift towards more intensely precipitating cyclones at the expense of weakly precipitating cyclones. These changes are thermodynamically driven and scale at near to the CC (∼7% K−1) relation for the more intensely precipitating cyclones. We have further shown that in spite of the well documented uncertainty in the large-scale circulation response to warming, there are clear 'on the ground' increases (up to 200%) in precipitation totals from extreme extratropical cyclones that are of large magnitude and, in some regions, consistent across models. Though policymakers must take heed of the uncertainty in the future location of the storm tracks, they should not overlook the relative certainty in the response of the more intense, and often most damaging, precipitation events shown in this study.
Acknowledgments
MH was supported by the Natural Environment Research Council (NERC)/Department for International Development via the Future Climates for Africa (FCFA) funded project 'Improving Model Processes for African Climate' (IMPALA, NE/M017265/1) and the NERC funded project 'Dynamical constraints on the future of extratropical precipitation: atmospheric rivers and extratropical storms' (DyARES, NE/R005222/1). EW was supported by the Engineering and Physical Sciences Research Council Vacation Bursary Scheme. GZ was supported by the ACRCC project (ERC advanced grant 339390). We acknowledge the World Climate Research Programme's Working Group on Coupled Modelling, which is responsible for CMIP, and we thank the climate modelling groups for producing and making available their model output. For CMIP the US Department of Energy's Program for Climate Model Diagnosis and Intercomparison provides coordinating support and led development of software infrastructure in partnership with the Global Organization for Earth System Science Portals. We thank ECMWF for giving access to the ERA-Interim data.
Data and code availability
The CMIP5 data used in this study can be obtained from the CMIP5 data portal (https://cmip.llnl.gov/cmip5/data_portal.html). ERAI data is available from ECMWF (http://apps.ecmwf.int/datasets/). GPCP precipitation data is available from NOAA (https://esrl.noaa.gov/psd/data/gridded/data.gpcp.html). The TRACK algorithm is currently available from Kevin Hodges on request (k.i.hodges@reading.ac.uk).