

Abstract
'Super' Storm Desmond broke meteorological and hydrological records during a record warm year in the British–Irish Isles (BI). The severity of the storm may be a harbinger of expected changes to regional hydroclimate as global temperatures continue to rise. Here, we adopt a process-based approach to investigate the potency of Desmond, and explore the extent to which climate change may have been a contributory factor. Through an Eulerian assessment of water vapour flux we determine that Desmond was accompanied by an atmospheric river (AR) of severity unprecedented since at least 1979, on account of both high atmospheric humidity and high wind speeds. Lagrangian air-parcel tracking and moisture attribution techniques show that long-term warming of North Atlantic sea surface temperatures has significantly increased the chance of such high humidity in ARs in the vicinity of the BI. We conclude that, given exactly the same dynamical conditions associated with Desmond, the likelihood of such an intense AR has already increased by 25% due to long-term climate change. However, our analysis represents a first-order assessment, and further research is needed into the controls influencing AR dynamics.
Export citation and abstract BibTeX RIS

Original content from this work may be used under the terms of the Creative Commons Attribution 3.0 licence.
Any further distribution of this work must maintain attribution to the author(s) and the title of the work, journal citation and DOI.
1. Introduction
'Desmond' impacted the British–Irish Isles (BI) during 4–6 December 2015. This extratropical cyclone was the fourth storm named jointly by the United Kingdom (UK) Met Office and Met Éireann during winter 2015/16. The storm brought strong winds (maximum gusts of 33 and 40 m s−1 in Ireland and the UK respectively), and delivered enough rainfall to break the 24 and 48 hour UK rainfall records (341 and 405 mm, respectively, recorded in Cumbria, Northwest England; McCarthy et al 2016). Its hydrological impacts were also extreme, with a number of UK and Irish rivers recording highest ever peak discharges (figure 1(a)). Indeed, Desmond caused record-breaking outflow from Great Britain, surpassing the previous high by more than 30% (Barker et al 2016). Overall UK damages from the storm were estimated to be £0.4–£0.5 billion (PWC 2015). Severe storm impacts also occurred beyond the UK, including landslides in Norway (Dijkstra et al 2016).
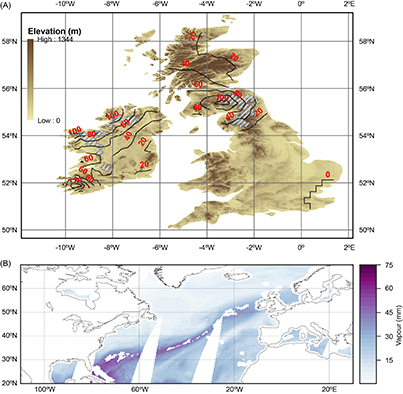
Figure 1. BI context in relation to Storm Desmond. (A) 7.5 arc-second digital elevation model from global multi-resolution terrain elevation data (Danielson and Gesch 2011). Polygons mark the river catchments that experienced record discharge from Storm Desmond: UK catchments are identified from Barker et al (2016), Republic of Ireland catchments are identified using records from the Office of Public Works (see supplementary information available at stacks.iop.org/ERL/13/014024/mmedia). The contour field gives daily precipitation totals (mm) for 5 December 2015, according to the E-Obs dataset (Haylock et al 2008). (B) Special Sensor Microwave Image/Sounder F16 retrievals of column integrated water vapour (Wentz and Spencer 1998) on the ascending orbit on 5 December 2015. Note that white areas indicate no data.
Download figure:
Standard image High-resolution imageSuch high winter BI precipitation totals and flood events are usually associated with enhanced horizontal water vapour transport from the Atlantic Ocean (Allan et al 2016, Lavers et al 2011). This advection occurs in narrow corridors termed 'atmospheric rivers' (hereafter 'ARs') embedded in the warm sector of extratropical cyclones. ARs source some of their moisture from tropical latitudes (Gimeno et al 2014). Storm Desmond was no exception in this regard, with satellite-derived column-integrated water vapour estimates during the passage of the weather system revealing a plume of moist air connecting the BI to the sub-tropical western Atlantic (figure 1(b)). Extreme precipitation can result when such air streams are lifted orographically, as has been well documented in both North America (Neiman et al 2008, Ralph et al 2005) and Europe (Lavers and Villarini 2013, Stohl et al 2008). The conditions for orographic lifting of ARs are met along the mountainous western fringes of the BI (figure 1(a)), where (Lavers and Villarini 2013) noted a strong correspondence between the occurrence of ARs and the timing of annual maximum precipitation events.
The amount of water vapour transported by ARs (i.e. their intensity) depends on wind speed and atmospheric moisture water content. Given that the saturation specific humidity increases by ~7% °C−1 according to the Clasius–Clapeyron relation, there are concerns that AR-related flooding could worsen in a warming climate. This view is supported by global climate model projections which suggest that AR frequency and intensity, driven by enhanced atmospheric moisture content, could increase for BI and coastal northwest Europe as the climate warms (Lavers et al 2013, Ramos et al 2016). How this translates to changing precipitation extremes is, however, somewhat more complex. For example, Shi and Durran (2016) highlight that reductions in vertical velocity, from increasing upper-level dry static stability, may act to reduce the sensitivity of extreme orographic rainfall to a warming climate.
Storm Desmond occurred during the warmest year globally since observations began, in a December that was the warmest on record for the UK (Kennedy et al 2016). In light of these conditions, and physical reasoning—both from first-order physics and modelling—that higher air temperatures drive more intense ARs, it is tempting to invoke climate change as contributing to Desmond's severity (Oldenborgh et al 2015). Although rainfall totals and river levels were extreme, less is known about the rarity of Desmond from a synoptic perspective. Exploring this dimension requires a process-based assessment, which has some considerable benefits. First, enhanced process understanding of the conditions driving Desmond's severity may ultimately lead to improvements in forecasting extreme hydroclimatic events. For example, Lavers et al (2016) demonstrated the potential for information about such large-scale circulation for enhancing medium range prediction of precipitation extremes. Second, it can yield insight into the possible contribution from climate change to the exceptional hydroclimatic conditions (Trenberth et al 2015), which in turn can enable more effective public communication of climate change impacts, and contribute to disaster risk reduction efforts (Shepherd 2016).
Accordingly, the aim of our study is to investigate the AR associated with Storm Desmond, and to explore the role played by climate change in contributing to its severity. In what follows, the data and methods are provided in section 2, results are in section 3 and the discussion and conclusions are presented in section 4.
2. Data and methods
2.1. Data
In the subsequent sections, while all notation is introduced within the text, we include table 2 in the supplementary information (hereafter SI) for convenience when referring to terms featuring within equations.
We used winter half-year (October–March, 1979–2016) six-hourly data at 1° × 1° spatial resolution from the ERA-Interim (ERA-I) reanalysis dataset (Dee et al 2011) to contextualise the atmospheric circulation during Storm Desmond. ERA-I data have been used previously to identify and characterise ARs (Ramos et al 2016), and found to agree well with other reanalysis products when used for this purpose (Lavers et al 2012). To diagnose moisture transport, specific humidity (q), zonal (u), and meridional (v) wind components were extracted for the domain 100 °W–30 °E, 20 °N-80 °N at pressure levels 1000 to 300 hPa. Data from higher than 300 hPa in the atmosphere are neglected because little moisture is transported above this level (Ramos et al 2016).
We also obtained six-hourly q, u, v, air temperature (T) and vertical velocity on all model levels for a global domain for winter half year, 1979–2016. These data were extracted to trace the history of air masses arriving in the BI during AR events (see section 2.3). To this end, we additionally employed global boundary-layer height (blh) from the ERA-I surface fields, and surface pressure (ps) from the ERA-I model levels' archive. Sea-surface temperatures (SSTs) were similarly extracted for a global domain (at 1° × 1° spatial resolution) from the HadISST dataset (Rayner et al 2003) for the longer period 1870–2016. These data were used to interpret the role of SSTs in modulating the humidity of traced air parcels (sections 2.3 and 4).
2.2. Detection and characterisation of atmospheric rivers
To characterise and contextualise the AR associated with Desmond, all ARs affecting the BI during the winter half year were identified using the vertically-integrated vapour transport (IVT):
where g is the acceleration due to the Earth's gravity, p denotes air pressure, and the remaining terms retain their meaning from section 2.1.
Equation (1) was applied six-hourly to the ERA-I data. The criteria used to classify ARs were adapted from Lavers et al (2012), who similarly classified ARs in the vicinity of the BI; the specifics are briefly recounted here. First, grid cells with IVT greater than the 528.2 kg m−1 s−1 threshold employed by Lavers et al (2012) were identified as possible components of ARs. If this condition was satisfied along 10.5 °W between 50 and 60 °N (the approximate western fringe of the BI; figure 1(a)), a connected-neighbours algorithm was implemented to join all adjacent cells exceeding the IVT threshold (evaluated using eight cell connectedness). If these touching cells extended to at least 30.5 °W, then the BI was defined as experiencing an AR during the respective time step. However, we only retained persistent ARs with the highest potential impact. These were defined as events lasting at least 24 hours, and whose latitude of maximum IVT along 10.5 °W remained within 4.5° of the initial IVT maximum at this line of longitude. The 4.5° latitude tolerance means that the mid-point of ARs can deviate at most ~500 km from their starting position, implying sustained influence over a given region, which likely translates to greater hydrological impact. The minimum duration extent applied here (24 hours) is greater than employed by (Lavers et al 2012), but was preferred for identifying ARs that were potentially most hydrologically severe. Moreover, preliminary screening of winter 2015/2016 ERA-I data indicated that Desmond's AR satisfied this time criteria.
AR intensity for each event was defined via two metrics: (i) the sum of the maximum IVT along 10.5 °W (50 °N-60 °N) (hereafter 'TOTAL'); and (ii) the peak rolling 24 hour mean of the maximum IVT along the same arc of longitude (hereafter 'MAX24'). The former metric places weight on the total amount of moisture delivered over the lifetime of an AR, whereas the latter focuses on intensity over a 24 hour window. We also estimated the rarity of MAX24 for Desmond by calculating its return period using a Gumbel distribution, whose parameters were determined from our sample using maximum likelihood estimation. We selected the Gumbel distribution because initial screening indicated it had the minimum Akaike information criterion amongst a pool of candidate right-skewed distributions (see the SI for details of this provisional screening). The suitability of the fitted Gumbel distribution was evaluated using a Kolmogorov–Smirnov (KS) test, with p-values estimated using a Monte Carlo simulation (see Clauset et al (2009) for a description of this procedure). It is necessary to determine p-values via simulation because we estimate the Gumbel distribution's parameters using sample data, which has the effect of increasing the probability of a type II error, as critical values of the KS test statistic are biased high (Steinskog et al 2007).
The return period (Rp) for Desmond's IVT was estimated by evaluating:
in which ζ is the mean number of ARs per year, and CDF is the Gumbel cumulative distribution function, given by:
where the location and scale are denoted by µ and σ, respectively. Physically, the mean of the Gumbel distribution is a linearly increasing function of both µ and σ, whereas the variance is proportional to the square of σ. We fitted the Gumbel distribution over the 1981–2010 climate period, and calculated the uncertainty on Rp using the profile likelihood method to estimate the 95% confidence interval (Coles 2001).
To provide process insight into Desmond's AR, we separately computed the column-mean wind speed (WS), evaluated at the latitude of the maximum IVT, for the four time steps constituting MAX24:
We also computed the total column water (TCW) for the same period and latitude:
which yields kg of water vapour per square meter and is equivalent to mm. The average of the four WS and TCW values were then used to characterise each AR.
2.3. Lagrangian air mass tracking
Backwards air mass tracking enables identification of sources and sinks of moisture that influence atmospheric humidity and hence the intensity of ARs (Gimeno et al 2012, Nieto et al 2007, Ramos et al 2016, Winschall et al 2014). To this end, we used the Lagrangian analysis tool 'LAGRANTO' (Sprenger and Wernli 2015) to calculate 10 day back trajectories of air in BI ARs. We then applied the moisture accounting routine of (Sodemann et al 2008) to identify source locations of moisture entrained in the traced air parcels. Finally, the role of SST variability in modulating AR's TCW was explored by calculating uptake-weighted SSTs from the HadISST dataset at sites of moisture uptake. Further details of how these analyses were implemented, including the calculation of weighted SSTs, are provided in SI.
Note that wherever we report the significance of temporal trends, their magnitudes were computed using the Seil–Then slope estimation method (which is robust to outliers; Sen 1960, Theil 1950), and p-values were evaluated using a 1000-trial block bootstrap simulation to account for possible autocorrelation. For each trial, the Seil–Then slope was calculated for the series of randomly reordered blocks and p was defined as the fraction of times the absolute magnitude of these slopes exceeded the magnitude of the trend in the original series. Block lengths were determined for this procedure using the implicit equation given in Wilks (2011).
3. Results
3.1. Characterisation of Desmond AR
We detected 81 ARs during the 37 winter half years (figure 2). Desmond's AR is shown in figure 3 for each 6 hourly slice of passage (04/12/2015 12:00 to 06/12/2015 00:00). Maximum IVT along 10.5 °W was attained on 5 December at 12:00, and the 24 hour period of peak IVT intensity (corresponding to MAX24) occurred from midnight on 04/12/2015 to midnight on 05/12/2015.
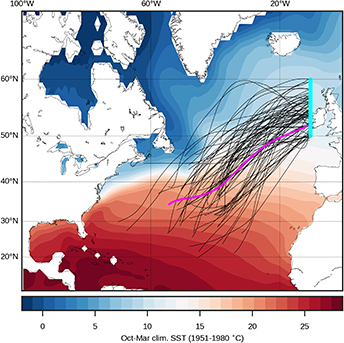
Figure 2. Axes of the 81 ARs identified by tracing local maxima of IVT northwest, west, southwest, and south from the ARs peak value along 10.5 °W (50 °N–60 °N). Note that Desmond's AR is highlighted in magenta. All tracks were smoothed using a third order Savitzky–Golay filter (Savitsky and Golay 1964) for final plotting. The filter replaces each y quantity (AR latitude) with a value determined by a local (third order) polynomial fit of y as a function of x (AR longitude). In this instance, we use a 31 term window to fit the local polynomials.
Download figure:
Standard image High-resolution image
Figure 3. IVT during the lifetime of Desmond's AR. The mean sea-level pressure is also plotted (black contours) with local high- and low- centres marked along with their central pressure (hPa). Note that the low associated with storm Desmond is in the vicinity of Iceland.
Download figure:
Standard image High-resolution imageThe other 80 ARs provide context to Desmond. According to TOTAL, Desmond's AR was ranked third since 1979, surpassed only by events in 2011 and 1991. However, by MAX24, Desmond's AR was the most severe on record (table 1). The 1991 event is the only AR other than Desmond to feature in the top three of both metrics. This AR caused heavy orographic rainfall in the southern Pennines (Northern England), leading to river discharges with return periods estimated in excess of 100 years (Institute of Hydrology 1992). The algorithm also detected the well-known AR in November 2009 (ranked ninth according to both metrics), an event that was also associated with flooding in both Ireland and the UK (Adger et al 2013, Lavers et al 2011).
Table 1. Rankings of ARs according to IVT summed over their full duration (TOTAL), and the peak 24 hour mean IVT attained during the ARs' lifetime (MAX24). Note that the date corresponds to the earliest time step of the AR.
| TOTAL | MAX24 | ||||
|---|---|---|---|---|---|
| Date | ΣIVT (kg m−1 s1) | Rank | Date | IVT (kg m−1 s1) | Rank |
| 08/10/2011 | 9942 | 1 | 04/12/2015 | 1128 | 1 |
| 20/12/1991 | 7414 | 2 | 20/12/1991 | 1098 | 2 |
| 04/12/2015 | 7370 | 3 | 09/11/2015 | 1073 | 3 |
| 03/02/2011 | 7290 | 4 | 14/12/1982 | 1034 | 4 |
| 31/12/1991 | 7004 | 5 | 26/12/1983 | 1032 | 5 |
| 26/12/1994 | 6559 | 6 | 25/10/2008 | 1029 | 6 |
| 11/02/1998 | 6522 | 7 | 08/10/2011 | 1026 | 7 |
| 13/02/1990 | 6222 | 8 | 06/03/2015 | 1018 | 8 |
| 18/11/2009 | 6158 | 9 | 18/11/2009 | 1014 | 9 |
| 25/12/2011 | 5724 | 10 | 10/12/1994 | 1009 | 10 |
The unusualness of the 24 hour IVT associated with Desmond was explored further by estimating the return period of MAX24 according to a Gumbel distribution. Figure (4) demonstrates the appropriateness of the Gumbel distribution, with points clustered around the 1:1 line. Confidence in the appropriateness of this distribution is increased by the KS test results, which gave little support (p = 0.67) for rejecting the Gumbel as our sample's parent population. Application of equation (2) suggested a return period of 12–66 years (95% confidence interval), with a most likely estimate of 26 years.
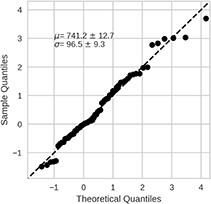
Figure 4. Quantile–quantile (QQ) plot illustrating the goodness of fit between 1981–2010 MAX24 and the fitted Gumbel distribution, whose parameters (± standard error) are annotated on the plot.
Download figure:
Standard image High-resolution imageThe representativeness of this return period rests on the MAX24 random variables being independent and identically distributed (iid). Independence seems likely, given that the minimum separation between ARs was 78 hours. It is more challenging to verify the identically distributed assumption. Global mean air temperatures have risen over the period of our AR sample (Hartmann et al 2013), and models indicate increasing AR intensity with climate warming (Lavers et al 2013, Ramos et al 2016), implying that the identically distributed assumption may be inappropriate. However, we found no significant temporal trends in means (p = 0.36) or standard deviations (p = 0.13) computed on five-year running samples of MAX24 (1979–2016). Thus, the iid assumption seems to be a reasonable approximation, and we interpret the return period as representative for the climate of the recent past.
Table 2. ARs ranked by column-mean wind speed (WS) and total column water (TCW) at the latitude of maximum integrated vapour transport (IVT) along 10.5 °W (50–60 °N) averaged over the 24 hour period corresponding to maximum IVT intensity.
| Rank | WS date | WS m s−1 | TCW date | TCW (mm) |
|---|---|---|---|---|
| 1 | 31/12/1983 | 43.1 | 09/10/2008 | 36.0 |
| 2 | 04/02/1990 | 40.5 | 09/10/2011 | 34.1 |
| 3 | 06/02/1984 | 40.1 | 05/10/1990 | 33.3 |
| 4 | 21/12/1991 | 39.8 | 21/10/1986 | 32.0 |
| 5 | 14/12/1982 | 39.8 | 18/11/2009 | 31.4 |
| 6 | 27/10/1998 | 39.4 | 29/11/2001 | 31.4 |
| 7 | 05/12/2015 | 39.3 | 22/12/2012 | 30.4 |
| 8 | 01/01/1992 | 39.3 | 13/11/1994 | 30.4 |
| 9 | 29/12/2004 | 39 | 07/10/1984 | 30.1 |
| 10 | 27/12/1983 | 39.0 | 05/12/2015 | 30.0 |
Further insight into the unusualness of Desmond's MAX24 relative to the rest of the ARs was explored by assessing WS and TCW separately over the 24 hours of maximum intensity (table 2). Neither of these quantities was unprecedented, but both approached the upper end of their distributions, with empirical non-exceedance probabilities of 88.9% and 92.6% for TCW and WS respectively (figure 5). TCW for Desmond is perhaps more unusual when the timing is considered, as only two of the top ten events by TCW occured outside of October and November, which is physically consistent with the higher SSTs that prevail during these autumn months. By contrast, Desmond was less seasonally unusual in terms of WS, as all but one of the top ten events by this metric occurred in the core winter months (December to February), with six falling in December. The result of concurrent extremes in these quantities means that Desmond's AR is ranked top if the products of the 24 hour average WS and TCW are assessed (not shown). Whilst this result is consistent with the analysis of MAX24, it should not be regarded self-evident, as the latter depends on covariations between q and u/v (equation (1)), which are not captured by equations (4) and (5).
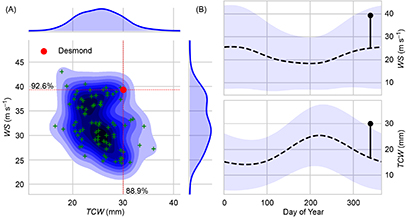
Figure 5. Column-mean wind speed (WS; equation (4)) and total column water (TCW; equation (5)) in ARs. (A) Bivariate scatter of each AR's TCW versus its mean wind speed. The green crosses represent conditions during each AR, whilst the blue shading summarises the two-dimensional density. Note that the red, dotted lines highlight the empirical non-exceedance probabilities for Desmond. The blue curves (top and centre) show the kernel-density estimates of the marginal distributions of TCW and WS, respectively. (B) Seasonal mean profile of WS and TCW along 10.5 °W (50 °N–60 °N) over the period 1981–2010 (dotted line), with Desmond's TCW and WS (averaged over the period of MAX24) marked with vertical bar. Note that the shaded region spans ± one standard deviation of the seasonal mean profile.
Download figure:
Standard image High-resolution image3.1. Lagrangian air mass tracking and moisture attribution
Back trajectories from the region of maximum IVT are shown in figure 6. Across all ARs, incident air parcels evidently spend much of their time to the west of the BI. The majority of the air parcels' time is, however, spent over the North Atlantic and Desmond was no exception in this regard (figure 6(b)). For all tracks, we could attribute an average of 50% of moisture to source regions (see the SI for context regarding 'unattributed' moisture), somewhat lower than that reported by (Sodemann et al 2008). We explore reasons for this in section 4. Most moisture uptake occurs over the North Atlantic (figure 6(c)), with the location of the maxima following the path of the Gulf Stream extension near 40 °N.

Figure 6. (A) Residence time of air parcels traced backwards (over a ten-day period) for all ARs. Residence time is a function of the number of air parcels passing over a point, and how long they are located over this region. (B) Same as (A) but only for air parcels traced backwards during the 24 hour period of max IVT for Desmond. (C) Attributed moisture amounts evaporated into back-traced air parcels. (D) Same as (A) but only for air parcels traced backwards during the 24 hour period of max IVT for Desmond. Note that the stereographic projections are bounded at 10 °N, with dashed lines marking 20 ° increments from 20 °N–80 °N.
Download figure:
Standard image High-resolution imageTo explore SST influence on TCW we computed the mean SST at uptake locations for each AR during the period of MAX24. Figure 7 indicates a highly significant correlation (r = 0.62; p < 0.001) between mean SST and corresponding mean TCW, with a sensitivity (β) of 1.16± 0.17 mm °C−1. We calculate the lowest mean SST experienced by air entrained in all ARs to be 13.1 °C, and the highest to be 22.6 °C, translating to a difference in TCW of around 11 mm (43% of the mean TCW across all ARs) using this regression equation. Air parcels entrained in Desmond's AR encountered a mean SST of 19.7 °C, higher than 75% of all other ARs assessed. Evaluating the regression function at this x-coordinate (assuming normally distributed residuals whose standard deviation is 3.15 mm; see figure 7 annotation), yields a conditional exceedance probability of TCW as high as experienced during Desmond (30 mm; hereafter DTCW) of 18%, which is 55% greater than the marginal probability (of 11.1%; given by 100%−88.9%; see figure 5).
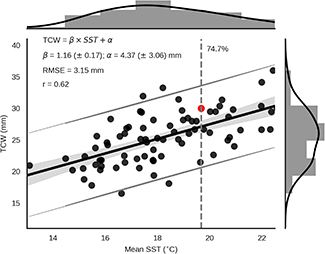
Figure 7. Relationship between the uptake-weighted SST at air parcel uptake locations, and the TCW upon AR landfall. The red marker indicates storm Desmond, whilst the dotted, vertical line highlights its mean SST, with the associated percentile annotated. Note that the equation of the best linear fit is indicated in the annotation, along with parameter estimates and their associated standard errors (brackets). 'RMSE' denotes the root mean square error between observed and regression-modelled TCW, and 'r' is the corresponding. The grey shading spans the 95% confidence interval for the regression function, and the (sub-horizontal) grey lines bracket the 95th confidence interval for the regression prediction; histograms show the marginal distributions of SST and TCW.
Download figure:
Standard image High-resolution imageWe have, therefore, demonstrated empirically that SSTs experienced by incident air parcels exert control on the TCW. This raises an interesting question about the possible role of climate change in increasing the likelihood of attaining DTCW. Variability in SSTs experienced by air entrained in ARs may result from (1) the positions of the boundary-layer tracks themselves (for example, tracks spending more time over the lower latitude North Atlantic are more likely to experience warmer SSTs); and (2) temporal variability in SSTs, resulting from internal variability at a range of time scales, and also from externally-forced climate warming. Under constant (1), long-term increases in SSTs would be expected to increase the likelihood of DTCW (see figure 7).
To explore the role of climate warming in contributing to Desmond's high TCW, we implemented an experiment that isolated (2). We took the observed air parcel trajectories (and uptake locations/amounts) from Storm Desmond and iteratively replaced the observed 2015 SST field with SSTs from all years in the HadISST dataset (1870–2015). The mean SST experienced by the air parcels for each of these alternative scenarios was then calculated from SI equation (3), with the resulting SSTs used to compute conditional exceedance probabilities (pr2) for DTCW, using the regression equation (figure 7). These probabilities were compared to the reference value (pr1) obtained for the 2015 SST field (18%—see above). An upward trend in the ratio pr2/pr1 (hereafter 'PR'—the probability ratio; Fischer and Knutti 2015) would result from increasing SSTs along Desmond's boundary layer air parcel trajectories. This experiment is warranted because the result is far from a forgone conclusion: global mean December SSTs have risen by almost 0.4 °C century−1, increasing to more than 0.5 °C century−1 if the trend is computed from the early 20th century (figure 8(a)). However, warming has been much suppressed over a large area of the North Atlantic, with cooling even apparent in the region of the sub-polar gyre (figures 8(a) and (b)). Accordingly, around 32% of Desmond's moisture uptake occurred from regions with SSTs below their 1951–1980 mean during December 2015 (figures 8 (c) and (d)). Our experiment therefore permits insight into how much warmer the track-averaged SSTs could have been in other years with less pronounced cool SST anomalies. We adopt the 1951–1980 climate normal period because it has been used widely as a reference, and the Atlantic Multidecadal Oscillation (AMO) (Kushnir 1994) was approximately neutral during this time.
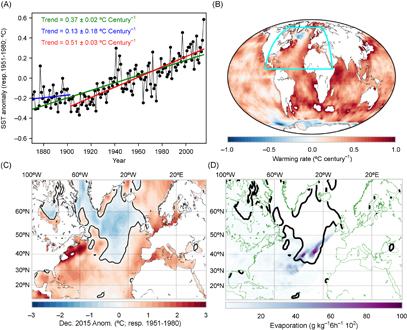
Figure 8. SSTs trends and moisture uptake locations. (A) Time series of the global mean December SST, with linear trend lines fitted. The value of the slope (± one standard error) are annotated. The break point (1902) used to separate earlier and later parts of the record for trend estimation was identified as the year yielding the lowest overall RMSE for regression models fitted separately to data either side of this point. (B) Trends in HadISST mean December SST over the period 1870–2015. (C) December 2015 SST anomalies calculated with respect to the 1951–1980 climatology. The solid black lines highlight the zero contour. (D) As in figure 6(D), but zoomed into the North Atlantic and including the zero contour from panel (C). Note that the domains plotted in (C) and (D) are marked in by the cyan rectangle.
Download figure:
Standard image High-resolution image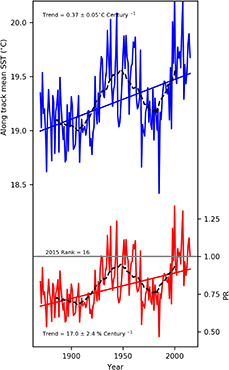
Figure 9. Time series of uptake-weighted mean SST (top) and the PR (see text), obtained by sampling SSTs at the uptake locations of air parcels entrained in Desmond's AR. Black, dashed line indicates a 30 year running mean. The slopes (annotated) were computed using the Theil–Sen method, and are highly-significant (p < 0.01) according to a block-resampling bootstrap, with block lengths decided using the implicit equation given by Wilks (2011). Uncertainty in the slopes is reported as ± one standard error of the ensemble of slopes returned by the Theil–Sen algorithm.
Download figure:
Standard image High-resolution image
This experiment indicates that uptake-weighted mean SSTs along Desmond's track have risen since 1870, with a significant upward trend of 0.37 °C ± 0.12 °C century−1 (figure 9). This rate is approximately equal to the global mean (figure 8 (a)) and slightly less than the trend in mean North Atlantic SSTs (0.40 °C ± 0.04 °C century−1: calculated over the region −80 °E–5 °E, 0 °N–70 °N using weights based on grid cell surface area, accounting for unequal cell sizes). The increasing SSTs along Desmond's track translate into a significant rise of 17% century−1 in PR (~25% since 1870). However, despite the increasing trend, pronounced high- and low-frequency variability in along-track SSTs means that, for identical air parcel trajectories, higher SSTs (and inferred TCW) should have been expected for Desmond's AR in 15 other years since 1870, and the rolling 30 year mean SST was actually at a peak during the middle of the 20th century (centred on 1947).
4. Discussion and conclusions
Our results suggest that the record precipitation and river discharge observed during the passage of Storm Desmond was associated with an AR of unprecedented intensity since at least 1979. This finding is consistent with previous work that has highlighted the importance of ARs in driving hydrological extremes along the western margins of the North Atlantic (Allan et al 2016, Lavers et al 2011, Liberato et al 2012, Stohl et al 2008, Trigo et al 2014). To date, the extreme rainfall associated with Storm Desmond's passage has been attributed to a slow-moving trailing front and the advection of a very mild and moist air mass (McCarthy et al 2016). Our results highlight the latter as being particularly important; Desmond's AR was most remarkable for its 24 hour intensity (MAX24), rather than the total moisture flux over its lifetime (TOTAL). We have deepened process understanding of the extraordinary nature of this intense episode of vapour transport by indicating that it was due to a combination of both a humid air mass, and its rapid advection. The former was particularly marked for an AR making BI landfall during December.
The unusually high TCW during Desmond's AR is particularly interesting given that it is the long-term increase in atmospheric humidity, driven by rising SSTs, that is credited with increasing the AR hazard as the climate warms (Lavers et al 2013). In this context, the severity of Desmond's AR could be interpreted as consistent with the observed long-term warming. However, such a simple interpretation is confounded by the fact that air entrained in ARs can encounter very different trajectories and SSTs at moisture uptake locations whilst on-route to the BI. Moreover, whilst global SSTs have increased, the North Atlantic region has exhibited more complex evolution of the SST field.
To isolate the possible role that climate warming may have played in raising the probability of such an intense AR, we removed dynamical variability by fixing air parcel trajectories and uptake locations to those observed during Desmond. This provided an assessment of how the SSTs along Desmond's unique track have evolved, and thus how, given exactly the same dynamical setup, the probability of such an intense AR may have changed over time. We find that SSTs within the region of the NA sampled by air parcels entrained within Desmond have experienced significant warming since 1870. Accordingly, we infer that the probability of DTCW (conditional on the dynamical setup) has increased significantly over the observational period. Note that we cannot strictly attribute this rising probability to anthropogenic forcing because our observational methodology does not distinguish amongst candidate drivers of long-term SST increase. However, research to date has found that, across the North Atlantic, only climate models (in the Coupled Model Inter-comparison Project Stage 5) which include all anthropogenic forcing mechanisms can reproduce the observed basin-wide positive trend in ocean heat content (Bindoff et al 2013). This lends support to the prospect that the rising SSTs and probability of DTCW are indeed anthropogenically forced. Future research repeating our Lagrangian moisture attribution analysis using factual vs counterfactual modelled SSTs could add greater confidence to this conclusion (Shepherd 2016).
We acknowledge, however, that our finding of increasing DTCW probability rests on some caveats. First, the Lagrangian attribution technique identified only around 50% of moisture sources. This is less than the 66% attained by Sodemann et al (2008), but is consistent with the more restrictive conditions under which we have applied their algorithm. The authors of this moisture-tracking routine cite neglect of turbulence, convection, and evaporation from precipitating hydrometeors among its limitations. Within ARs these conditions are likely to be encountered more frequently, as entrained air travels in close proximity to atmospheric fronts characterised by static instability and precipitation.
A second caveat is that our treatment to control for dynamical variability is simplistic. In applying the regression function (figure 7) to infer the impact of changing SSTs on DTCW, we imply that SST variability has no impact on the atmospheric circulation of Storm Desmond. That is, the locations and amount of moisture uptake (evaporation) and loss (precipitation) are assumed to remain constant. In reality, changing SSTs could also be expected to influence these aspects of Storm Desmond. More complete insight into the influence of SST warming on Desmond's AR in this regard could be gained through appropriately-designed experiments within numerical weather models, which account for the complex interaction between atmospheric circulation and SSTs (Lackmann 2014, Meredith et al 2015). We emphasise that out analysis simply confirms that uptake-weighted mean SST experienced by air entrained in ARs does indeed correlate with TCW at landfall, and we observed that despite the complex SST evolution over the North Atlantic, SSTs have risen significantly at the uptake locations associated with Desmond's AR.
In addition to the long-term upward trend in SSTs at Desmond's moisture uptake locations, our analysis also highlighted pronounced SST variability, with 15 other years yielding increased probability of DTCW, and the rolling 30 year maximum occurring in the middle of the 20th century. The latter mainly reflects the basin-wide, low-frequency variability in SSTs described by the AMO, which was in a positive (warm) phase during the period 1930–1960 before turning negative until around 2000 (Trenary and DelSole 2016). Our most recent 30 year running-mean SSTs were, therefore, calculated for a period encompassing both negative and positive AMO states.
We further note that, whilst SSTs along Desmond's track have increased significantly, (translating to a rise in PR), the magnitude of this change is modest compared to variability in SSTs observed between ARs (~10 °C SST difference between ARs, versus ~0.5 °C SST warming along Desmond's AR track 1870–2015; figures 7 and 9). This highlights the importance of dynamical variability in explaining AR intensity, and is therefore consistent with the earlier observation (when examining the iid assumption) of no recent trend in MAX24 despite global warming. The evolving severity of ARs over the observational period—particularly in terms of TCW—is best understood in terms of the prevailing atmospheric circulation, rather than concurrent long-term thermodynamic changes in the climate system.
In this context, we suggest that future studies should explore controls on these dynamics in more detail. Although research has established a connection between the phase of the North Atlantic Oscillation and the number of BI ARs (Brands et al 2017, Lavers and Villarini 2013), less is known about how such modes of variability may influence the intensity of ARs through modifying air parcel trajectories and moisture uptake locations. The AMO may also play an important role in this respect. Not only does it directly affect moisture uptake (through elevated SSTs), it also modulates North Atlantic atmospheric circulation (McCarthy et al 2015, Peings and Magnusdottir 2014). The AMO's predictability at lead times of up to a decade (Mochizuki et al 2012), raises the prospect of forecasting periods of enhanced AR hazard with considerable lead time. The recent release of centennial records of North Atlantic ARs (Brands et al 2017) opens a way to examine these possible controls in the near future.
In closing, we summarise that our research has explained the severity of Storm Desmond from a process-based perspective, highlighting empirically the role of SSTs in modulating AR moisture. Accordingly, we interpret that long-term North Atlantic warming may have increased the chance of an AR as severe as in Storm Desmond. This conclusion may help provide a tangible, easily communicated example for wider dissemination, of the impacts from climate change on North Atlantic hydroclimatic extremes. Further, we are hopeful that, in addressing the influence of SSTs on AR moisture content, our results may encourage exploring SST forcing of AR severity in more detail, including any influence on dynamics. We are hopeful that such understanding may eventually improve prediction of extreme events and ultimately contribute to risk reduction efforts.
Acknowledgments
Michael Sprenger is gratefully acknowledged for help with using the LAGRANTO software. Two anonymous referees are also thanked for their insights which improved the study considerably. Conor Murphy was funded by the Irish Environmental Protection Agency under project 2014 CCRP-MS.16.