

Abstract
With growing concerns regarding future impacts of sea-level in major coastal cities, the most accurate information is required regarding local sea-level changes with respect to the coast. Besides global and regional sea-level changes, local coastal vertical ground motions can substantially contribute to local changes in sea-level. In some cases, such ground motions can also limit the usefulness of tide-gauge records, which are a unique source of information to evaluate global sea-level changes before the altimetry era. Using satellite synthetic aperture radar interferometry, this study aims at characterizing vertical coastal ground motion in Dakar (Senegal), where a unique century-long record in Africa has been rediscovered. Given the limited number of available images, we use a stacking procedure to compute ground motion velocities in the line of sight over 1992–2010. Despite a complex geology and a rapid population growth and development, we show that the city as a whole is unaffected by differential ground motions larger than 1 mm year−1. Only the northern part of the harbor displays subsidence patterns after 2000, probably as a consequence of land reclamation works. However, these ground motions do not affect the historical tide gauge. Our results highlight the value of the historical sea-level records of Dakar, which cover a 100 year time-span in a tropical oceanic region of Africa, where little data are available for past sea-level reconstructions.
Export citation and abstract BibTeX RIS

Content from this work may be used under the terms of the Creative Commons Attribution 3.0 licence. Any further distribution of this work must maintain attribution to the author(s) and the title of the work, journal citation and DOI.
1. Introduction
Since the end of the 19th century, global sea-level has risen as much as 15–20 cm, mostly because of climate warming(e.g., Church et al 2013, Hay et al 2015). As this process is very likely to continue and accelerate in the future, drastic aggravation of coastal erosion and flooding hazards are expected. However, the aggravation of coastal flooding should be the most immediate consequence (Nicholls and Cazenave 2010). This issue is particularly critical in large and densely populated coastal cities (Hanson et al 2011), and it is recognized as a global concern. For example, Hallegatte et al (2013) estimated that without adaptation, damage costs due to flooding could exceed 50 bn$ per year by 2050 in the 140 largest cities in the world.
In this context, a possible aggravating factor can be vertical ground motion. Indeed, the relevant sea-level change for assessing coastal flooding (as it is actually measured by tide gauges) is the difference between sea-level changes from ocean (including climate contributions) and local vertical ground motion processes. Far from being negligible, such land motion can represent a large contribution to relative sea-levels and must be taken into account in coastal impact assessments: different ground motions estimates can lead to substantially different assessments, by as much as several hundred thousand exposed persons and several tens of billions of dollars for a single major coastal city such as Alexandria (Wöppelmann et al 2013). Hence, local and regional vertical ground motions are one of the important sources of uncertainty to consider in assessing sea-level rise and its impacts. Moreover, it is very difficult, if not impossible, to evaluate them without observations, due to their complex causes and evolution in space and time (e.g., Chaussard et al 2013, Raucoules et al 2013, Samsonov et al 2014). Therefore, a first motivation to accurately characterize vertical ground motions in large coastal cities is to reduce the uncertainties associated with relative sea-level changes, and, subsequently, their future impacts.
A second challenge motivating a precise characterization of vertical ground motions in coastal cities is to reconcile sea-level estimates for the 20th century: over this period, there is a slight disagreement between (1) observations of sea-level rise obtained from the available tide gauge data sets, and (2) the sum of contributions from each process causing sea-level rise (Munk 2002, Church et al 2013, Gregory et al 2013). Indeed, the main contributors to contemporary global sea-level rise are land ice melting from mountain glacier and polar ice sheets and thermosteric effects, while water exchanges between the continents and the ocean and the global isostatic adjustment had a negligible contribution over the time-scale of the past century (Church et al 2013). Several non-exclusive hypothesis may explain this slight difference in the various 20th century sea-level rise estimates, including (1) errors in the estimation of one or several contributors to sea-level rise (Gregory et al 2013); (2) the uneven spatial and temporal distribution of tide gauge records (Jevrejeva et al 2014, Hay et al 2015), and (3) local coastal vertical ground motions (Wöppelmann et al 2014). Accurate knowledge about the ground motions affecting tide gauges is thus highly desirable, especially in regions poorly covered by observations such as inter-tropical regions or the Southern hemisphere.
Hence, two challenges of global significance motivate characterizing vertical ground motions in major coastal cities. They can be exemplified in the case of Dakar (Senegal), a coastal city located on the Cape-Verde peninsula:
- - First, Dakar is a rapidly growing city potentially affected by adverse effects of sea-level rise. Its southern coast is constituted by low elevation built areas prone to flooding and bounded by often eroded sandy beaches (Lo and Diop, 2000). Moreover, urban development and population increase has taken place during the past decades, as the population rose from 400 000 inhabitants during the seventies to around 1.2 million in 2011 (UN 2011 SD Demographic Statistics). The entire urban area reaches a population of around 3 million, with a density of 1920 inhabitants per km2, while the present urban surface covers around 550 km2. Hence, Dakar was included in the previous assessments of future coastal flooding impacts in 140 major coastal cities (Hanson et al 2011, Hallegatte et al 2013).
- - Second, historical records from tide gauges back to the 19th century were recently rediscovered (Wöppelmann et al 2008), offering the potential to provide sea-level trend estimates in a continent (Africa) and area (Tropics) where long tidal records are extremely rare, and henceforth invaluable for sea level science (Woodworth et al 2007;). A review of the Permanent Service for Mean Sea Level (PSMSL) data holdings as of January 2015 (figure 1) confirms the scarcity of tide gauge records longer than a 100 years with at least 70% of valid quality controlled data (Holgate et al 2013, Haigh et al 2014). This underscores the relevance of undertaking a data archeology investigation to rescue the historical sea level records from Dakar.
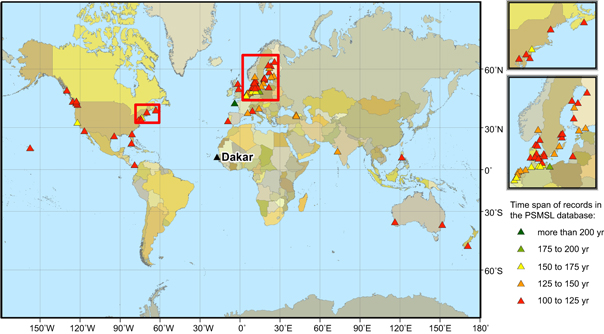
Figure 1. Location of the tide gauges with records longer than 100 years and at least 70% valid controlled data in the PSMSL data repository. Dakar is located in a coastal region of Africa, where no other sea-level records presently meet these criteria.
Download figure:
Standard image High-resolution imageSeveral evaluations of vertical ground motion in Dakar have been attempted without much success so far. Table 1 shows that the uncertainties from the previous studies were too large to detect a non-zero geocentric vertical land motion. Furthermore, all the past estimates are point-wise measurements (Doris stations, permanent GPS, comparisons between sea level trends from satellite radar altimetry and tide gauges). Hence, the possibility that the city is affected by differential ground motions cannot be ruled out. This possibility of differential ground motions seems plausible considering the complex geology of Dakar (presence of volcanic rocks, Quaternary sand deposits and anthropogenic embankments; figure 2), the susceptibility to shrink-swell hazards as well as the history of groundwater pumping (DaSylva and Cosandey 2005, Roger et al 2009).
Table 1. Summary of ground motion estimates identified for Dakar. All these estimates are provided with respect to a geocentric reference frame, whereas InSAR measures differential ground motions with respect to a fixed reference point within the observed area. Hence, InSAR cannot assess the absolute trends provided here by the other techniques, but it can evaluate their spatial consistency. Note that the effect of the global isostatic adjustment is on the order of 0–1 mm year−1 in Dakar depending on the model (Jevrejeva et al 2014).
| Vertical ground motion linear trends | Source of data | Study |
|---|---|---|
| 0.1 ± 1.3 mm year−1 | Doris station | Soudarin et al (1999) |
| 1.4 ± 0.6 mm year−1 | Doris station | Ray et al (2010) |
| 0.7 ± 1.3 mm year−1 | Satellite altimetry minus tide gauge | Ray et al (2010) |
| 2.0 ± 1.7 mm year−1 | Permanent GPS | Bouin and Wöppelmann (2010) |
| Trends estimate not robust (too short valid record) | Three permanent GPS (www.sonel.org) | Santamaría-Gómez et al (2012) |
| 0.25 ± 2.9 mm year−1 | DAKA-GPS | sideshow.jpl.nasa.gov/post/series.html accessed 24/06/2015 |

Figure 2. Lithological map of Dakar (data from Roger et al 2009). The red box indicates the spatial extent of InSAR results presented in figure 5.
Download figure:
Standard image High-resolution imageUsing satellite Synthetic Aperture Radar Interferometry (InSAR; see part 2), this study aims at characterizing potential differential ground motions in Dakar. Its main objective is to examine if Dakar is affected by vertical ground motions that could significantly deviate the trend of local relative sea level rise from global estimates. In part 3, we estimate the spatial extent of these ground motions using InSAR. This result offers the opportunity to revisit previous geological and geodetic studies on Dakar, and to investigate the two following questions:
- - Could the ground surface deformation be anticipated considering the geology of the area and the available point-wise measurements? (Question addressed in part 4).
- - To which extent are our results a useful contribution for scientists concerned with the 20th century sea-level rise budget? (Question addressed in part 5).
2. Synthetic aperture radar (SAR) data and interferometric methods
SARs are active instruments, which produce a signal that can be partly backscattered by the ground surface. The principle of InSAR is to use the phase of the radar signal, which is known modulo 2π rad, and which can be related to the path length of the electromagnetic signal. Using two different SAR images, the phase difference at each pixel of the SAR image can be processed to produce ground deformation maps in the line of sight of the sensor. Since the first demonstrations of the technique applicability (e.g. Massonnet and Feigl 1998), several advanced InSAR processing methods have been developed: a first set of methods (Persistent Scatterers Interferometry) is based on the analysis of particular pixels, in which the signal is particularly well backscattered by specific targets with adequate radiometric and geometric properties with little radiometric relative temporal variation (e.g., Ferretti et al 2001, Wegmuller et al 2003). This method can be applied only when a sufficient number of SAR images (typically 40–50) have been acquired over the area of interest. Other methods consist in stacking a set of interferograms to compute maps of ground deformation velocities trends (Usai 2003, Le Mouélic et al 2005, Pepe et al 2005). Both stacking and Persistent Scatterers approaches minimize the atmospheric effects, which are the main source of uncertainty in ground motion velocity estimation in urban areas. Indeed, since these atmospheric effects are not correlated in time, they can be averaged and reduced through techniques using more than 2 images, and in particular by applying a stacking procedure. Numerous previous studies have demonstrated that InSAR techniques are particularly adapted to monitor urban ground motions in the order of less than 1 mm year−1 to a few centimeters per year depending on the technique and the number of images (Raucoules et al 2009).
In the case of Dakar, 25 valid SAR images have been acquired by ERS 1/2, and 10 by Envisat/ASAR during their operational lifetime (figure 3). This limited amount of data for both ERS and Envisat data sets prevents from obtaining good performance from Permanent Scatterers Interferometry. Hence, our approach follows the following steps: first, we compute the interferograms for the ERS1/2 and Envisat/ASAR pairs of SAR images whose baselines do not exceed 500 m. Second, following Le Mouélic et al (2005), we examine each interferogram visually and remove those displaying obvious atmospheric effects or high temporal decorrelation in the area of interest, that is, the city center where the tide gauge and the other geodetic instruments are located (figure 4). Finally, we stack all the ERS1/2 and Envisat/ASAR interferograms. After such a procedure, the upper bound for the precision of the resulting ground motion velocity maps is proportional to the remaining atmospheric fluctuations (typically equivalent to 1 cm on a single interferogram at the scale of the city), divided by the temporal sampling rate and the square root of the number of independent interferograms (Williams et al 1998). In the case of Dakar this results in precision values on the order of 1–2 mm year−1 over the ERS or Envisat periods.
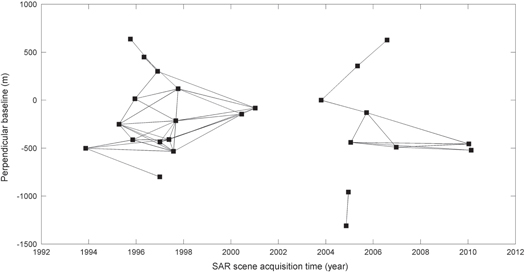
Figure 3. Baseline/time diagram for the ERS1, ERS2 and ENVISAT data. This diagram displays the selected SAR scenes (squares) and interferograms (segments) used to compute the following ground motion velocity maps. These scenes and interferograms meet the requirements in terms of baseline, time span, coherence and limited atmospheric effects. The ordinate axis origin is set to zero for the master scene of both Envisat and ERS stacks of interferograms (SAR scene acquired on 23rd October 2003).
Download figure:
Standard image High-resolution image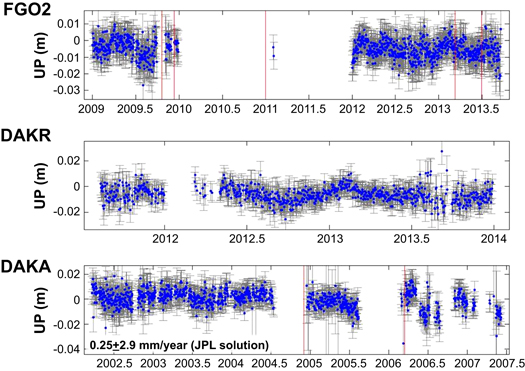
Figure 4. Records of the three GPS located in Dakar from the latest reprocessing of global GPS velocity fields of the University of La Rochelle (ULR-6). Red lines indicate discontinuities. In the case of the DAKA station, these discontinuities are probably related to changes of the instruments (see text).
Download figure:
Standard image High-resolution imageTo maximize the precision of the ground motion velocities, we compute a stack combining all ERS 1/2 and Envisat/ASAR interferograms. This implies resampling each SAR scene on the same reference image during the interferometric processing. Hence, we select the Envisat SAR scene acquired on 23/10/2003 as the master scene for both Envisat and ERS stacks of interferograms. This last procedure enables us to compute ground motion velocity map averaged over 1993–2010, with formal uncertainties lying slightly below 1 mm year−1.
As InSAR evaluates differential ground motions, all ground motion velocities are evaluated with respect to a reference point selected during the processing of SAR images. Here, the ground deformation velocities were computed with respect to the location of a permanent GPS located in the city center of Dakar ('DAKA-GPS'). This instrument provides the longest GPS record available in the city, from 2002 to 2007 (www.sonel.org; figure 4). The time series of other records from the GPS stations still remain too short (DAKR) or discontinuous (FG02) to compute reliable trends. The vertical ground motion velocity of 'DAKA-GPS' is estimated at 0.25 ± 2.9 mm year−1 in the global solution of the Jet Propulsion Laboratory (table 1). No trend is provided by Santamaría-Gómez et al (2012) at this station in the 5th reprocessed solution of global GPS vertical velocity fields of the University of La Rochelle (table 1). Considering the records more closely, we note that its position time series display discontinuities from July 2004 onwards. All its weekly position estimates remain within a range of [−5; +5 mm], except from February to May 2006 where it reaches +1 cm. As reported by Bruyninx (2004), such discontinuities are typically observed whenever the equipment is changed (antenna or receiver). This suggests that the uncertainties on the vertical ground velocity of 'DAKA-GPS' are due to metrological issues. In addition, this does not prevent us from using it as reference point because the primary aim of this study is to investigate whether all instruments are affected by different vertical ground motion velocities. In the following sections, all vertical ground motion velocities are computed with respect to this location.
3. Observational evidence of vertical ground motions in Dakar
The InSAR results show that no important variation in subsidence or uplift is affecting the city from 1993 to 2010 (figure 5). In most of the area of interest, vertical ground motions do not exceed ±1 mm year−1. As a first approach, average ground motion velocities and their precision can be estimated by calculating the mean and standard deviation over coherent areas (i.e. interferometric coherence values larger than 0.6). From 1993 to 2010, the mean deformation rates with respect to the permanent GPS location 'DAKA-GPS' is −0.032 ± 0.1 rad year−1 (−0.14 ± 0.5 mm year−1) in the Line of Sight (LoS) of the satellite. Therefore, from 1993 to 2010, most of the city can be considered stable with respect to the location of 'DAKA-GPS' and within the estimated upper bound for the uncertainties of ±1 mm year−1. The ERS and Envisat stacks of interferograms show that the same conclusion can be drawn for the sub-periods 1993–2001 and 2003–2010 (figure 6). The confidence in ground motions velocities can be further assessed by considering the mean coherence values of ERS and Envisat interferograms (figure 7). In areas where the coherence is low (e.g., western side of the city), the ground motion velocity maps appear noisy. This can be explained by the land cover, as these areas are less urbanized, and, therefore, results in a temporal decorrelation phenomenon (Zebker and Villasenor 1992). Note that low-coherence areas appear noisier from 2003 to 2010 than from 1993 to 2001. Indeed, we could process more ERS 1/2 than Envisat/ASAR interferogramms (figure 3). Hence, the stacking procedure performed better in averaging and removing errors for the timespan covered by ERS 1/2 (see part 2).
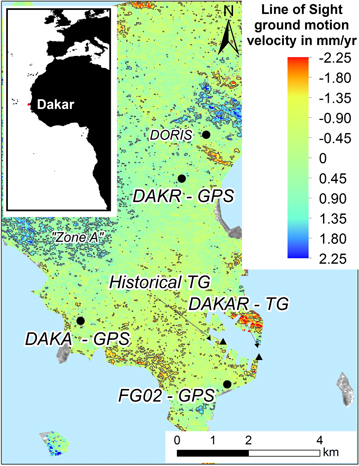
Figure 5. Line of Sight ground motion velocity in mm year−1 for the whole 1993–2010 period (ERS1, ERS2 and Envisat). Negative values indicate subsidence. Gray contour lines are plotted for the following LoS ground motion velocity values: −3 mm year−1; −1 mm year−1; +1 mm year−1; +3 mm year−1.
Download figure:
Standard image High-resolution image
Figure 6. Line of Sight ground motion velocity in mm year−1 for 1993–2001 (ERS 1–2 data, left) and 2003–2010 (Envisat data, right). For figure readability, the color palette is saturated at its extreme values.
Download figure:
Standard image High-resolution image
Figure 7. Mean coherence of the ERS and Envisat interferograms selected to compute ground motion velocity trends over 1993–2010. White contour lines are plotted for the following coherence values: 0.25; 0.5; 0.75.
Download figure:
Standard image High-resolution imageA small subsidence pattern can be identified in a coherent area located on the northern part of the harbor (figure 8). This subsidence is non-linear in time (figure 6): the rates of subsidence in the Line of Sight reach −0.97 ± 0.3 rad year−1 (−4.3 ± 1.3 mm year−1) over the Envisat acquisition period (2003–2010), whereas the same area is stable with respect to the location of 'DAKA-GPS' on the ERS stack of interferograms (1993–2001). This subsidence occurs in a coherent area, where radiometric and geometric properties of the scaterring elements on the ground surface are stable over the monitoring period. In the harbor of Dakar, coherent areas correspond to permanent port facilities such as hangars and hydrocarbon infrastructures. However, a significant part of harbors is used to store shipping containers. The radiometric properties of such objects are suitable to backscatter the radar signal to the satellite, but no ground motion deformation can be reliably measured because they are frequently displaced. The least coherent areas are therefore either container area, or sectors where construction works have been undertaken over the monitoring period. The extent of the deformation (larger than 1 km) suggests a subsidence of the whole northern platform of the harbor rather than individual building motions.
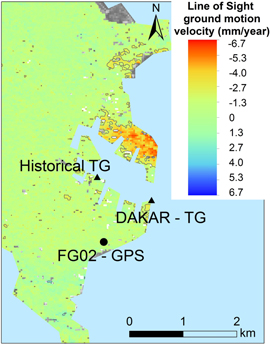
Figure 8. Zoom over the harbor area showing the Line of Sight (LoS) ground motion velocity in mm year−1 for the 2003–2010 period (Envisat). These results highlight the subsidence of the northern part of the harbor. Note that the coherent subsiding areas correspond to the hydrocarbure transport facilities, which are located on backfill materials and were recently extended. Gray contour lines are plotted for the following LoS ground motion velocity values: −2 mm year−1 and +2 mm year−1.
Download figure:
Standard image High-resolution imageOther areas may deserve specific attention: in the western side of the city, north of the GPS ('Zone A' in figure 5), the results suggest a small uplift of 0.21 ± 0.08 rad year−1 (0.9 ± 0.4 mm year−1 in LoS) from 1993 to 2010 (coherence exceeds 0.6). The same 'Zone A' area is uplifting as much as 0.23 ± 0.10 rad year−1 in the LoS during the ERS period, but the uplift becomes negligible during the Envisat period (0.07 ± 0.15 rad year−1 in the LoS). While this pattern is detected at the limit of the capabilities of the techniques, the reasons for considering it will appear obvious in section 4.
No other differential ground motion can be identified with confidence at the scale of the city: except in the harbor, differential ground motions larger than ±1 mm year−1 can therefore be discarded in the coherent areas mapped in figure 6. First, if we assume that the uncertainties affecting the 'GPS-DAKA' vertical ground motion velocities are due to GPS antenna or receivers changes, these results indicate that ground subsidence can be neglected in assessments of future coastal hazards in Dakar (except in the northern part of the harbor). For coastal stakeholders concerned with adaptation to future sea-level rise, this makes a significant difference with some other large coastal cities, affected by subsidence larger than 1 cm year−1 (e.g., Hanson et al 2011, Ng et al 2012, Chaussard et al 2013). Secondly, these observations of ground motion over the last 20 years highlight the value of the historical Tide Gauge at Dakar, because the historical tide gauge and all permanent GPS are located in coherent areas unaffected by differential ground motions larger than 1 mm year−1 (table 2). This further supports the idea that the recently rediscovered tide gauge records are particularly valuable for studies of long-term trends in sea-levels (Wöppelmann et al 2008).
Table 2. InSAR-based estimations of the surface deformations affecting with respect to a point located near 'DAKA-GPS'. Trends and error bars are computed by considering the mean and standard deviation of ground motion velocity trends for pixels located within a circle with a radius of 100 m around each geodetic instrument. (*): denotes data available on the PSMSL data repository; (+): denotes data available on Sonel.
| Trends obtained from the stack of interferograms from 1993–2010 | DAKA-GPS | FG02-GPS | DAKR-GPS | Historical Tide gauge | DAKAR TG | Doris |
|---|---|---|---|---|---|---|
| Timespan covered by the in situ instrument | 2002–2007 (+) | 2009–2015 | 2011–2015 | 1942–1966 (*) | 1992–2012 (*) | 1993–1998 |
| Status of the instrument/data | Decommissioned | Operational | Operational | Ongoing digitalization of old records | Operational | Decommissioned |
| Geology | Clayed sands | Laterite | Aeolian sands | Backfill material | Backfill material | Aeolian sands |
| Line of Sight ground motion velocity in mm year−1 | 0.19 ± 0.4 | 0.19 ± 0.4 | −0.31 ± 0.4 | 0.06 ± 0.3 | 0.09 ± 0.4 | 0.10 ± 0.5 |
| Vertical ground motion velocity in mm year−1 | 0.21 ± 0.5 | 0.22 ± 0.5 | −0.34 ± 0.5 | 0.06 ± 0.3 | 0.10 ± 0.5 | 0.11 ± 0.5 |
4. Ground motions in the context of geological and hydro-geological settings in Dakar
The general stability of Dakar was difficult to anticipate given its complex geology, land-use history and rapid and recent urban development. Indeed, the peninsula is constituted by a rocky tip at the western part of the city, linked to the continent by a sandy spit (figure 2). The Western tip is mainly constituted by Early Quaternary basalts and volcanic rocks, partially overlaid by later Quaternary clayey sands (Roger et al 2009). Interestingly, this area corresponds to the 'zone A' in figure 5, which might be uplifting. However, the limited number of SAR scenes limits the precision of ground motions velocities and prevents us from firmly concluding on this uplift.
Most of the remaining part of the Cape-Verde peninsula is covered by Quaternary deposits with dominant Aeolian sands ('Erg Pikine', orientation of the dunes NNE-SSW), alternating with marine sands and brackish deposits (organic clay and sand, gravels). Considering such a complex geology and given the drastic growth of the city, one could expect complex subsidence patterns. None is observed so far however.
The shrink-swell hazard is directly linked to the clay content of both the soils and the underlying geological formation. The shrink-swell hazard (Roger et al 2009) is negligible in areas where sands are dominant, medium on the western tip where the basalts constitute the substratum and are variously affected by weathering, and high where the laterite or the Middle Eocene marls outcrop (SW tip of the peninsula). This latter area (southern extremity of the peninsula) is constituted by Palaeocene marls and Eocene clays, which are prone to landslides (Fall et al 1996), and it appears subsiding in the stack of Envisat interferograms, but the lack of coherence in this area prevents us from drawing robust conclusions. In general, no indication of a relationship between ground motions and the geological patterns underpinning shrink-swell hazard could be identified, whether from single interferograms or in the map of errors resulting from the stacking procedure.
In the early 20th century, groundwater extractions took place north of the city center close to the decommissioned Doris station, and, later, in the Quaternary sands located on the North of the peninsula. Such processes use to be a standard cause of rapid subsidence and can be observed even when aquifers are artificially recharged (Wang et al 2012). In the area considered in figures 5 and 6, groundwater extractions are no longer reported (DaSylva and Cosandey 2005), and we did not identify any potential sign of subsidence or uplift in relation to these processes.
Finally, the unique significant subsidence that can be observed with confidence is located in the harbor of Dakar. This subsidence is probably due to recent embankment work in the northern part of the harbor, which may have caused a moderate subsidence of backfill materials used to reclaim land from the sea.
5. Consequences for sea level measurements in Dakar
Table 2 shows differential ground motion velocities affecting the geodetic instruments located in Dakar. All differential ground motions found are close to zero and below the precision threshold of the method.
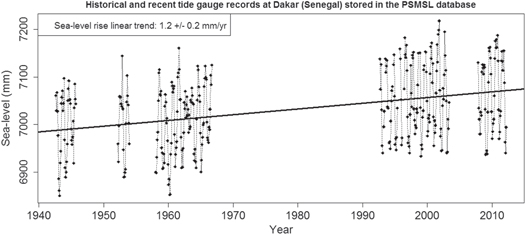
The ranges of errors on previously published vertical ground motion velocities are either slightly larger than 1 mm year−1 or not reliable because of the short time series (case of permanent GPS). The uncertainty of InSAR ground motion velocities is lower than or of the same order of magnitude as the uncertainty derived from other geodetic measurements available presently (table 1). In particular, vertical ground motion velocities obtained by subtracting trends from satellite altimetry and tide gauge (SA-TG) records are subject to high uncertainties. Indeed, the uncertainty on satellite altimetry records reaches 1–2 mm year−1 at regional scales (Ablain et al 2015). Actually, there are two situations where SA-TG trends can be validated against GPS ground velocities in combination with InSAR: (1) in semi-enclosed basins such as the Mediterranean sea, where uncertainties of SA-TG trends can be reduced (Kuo et al 2004); (2) in regions where climate-induced sea-level rise is much faster than the global average: in such case, a lower precision in trends becomes sufficient to compare SA-TG trends with other geodetic measurements (Cazenave et al 1999). We met these two cases in Alexandria (Egypt) and Manilla (Philippines) respectively (Wöppelmann et al 2013, Raucoules et al 2013). However, none of these two conditions is met in Dakar, which is located on a peninsula on the Atlantic Ocean (figures 1 and 2), and where sea-level has risen at millimetric rates in recent decades (figure 9).
Figure 9. Monthly sea-level data available from the PSMSL repository for the two tide gauges in Dakar with associated linear trend (least-squares adjustment and formal uncertainties). Data recorded after 1992 originate from the most recent tide gauge.
Download figure:
Standard image High-resolution image
In summary, the different estimates of ground motion velocities published for Dakar are consistent with each other and with our InSAR results, within the current uncertainties obtained from the data analysis of each technique. All techniques agree that all geodetic instruments in Dakar are following the same very low ground motion within uncertainties of ±1 mm year−1, except possibly the recent tide gauge. The analysis of the geological and urban development context suggests possible processes resulting in ground motions (Part 4). However, except in the northern part of the harbor where construction works have probably caused subsidence of embankments, no significant contributions of natural processes (tectonics, volcanism) or human activities (e.g., groundwater extractions) have been detected from 1992 to 2010. This suggests that the impacts of the same processes were insignificant earlier as well, and that the signature of the long term vertical ground motion can be assumed stationary over the 20th century in most of the city. Therefore, the long term historical tide gauge records appear suitable for long term sea-level reconstructions and analysis.
The case of the recent tide gauge deserves more attention: the area is not coherent enough to conclude firmly on the rate of vertical ground motions, which is found at 0.10 ± 0.5 mm year−1. More information regarding this location would be useful to evaluate to what extent this tide gauge is suitable for bias drift corrections and validation of satellite altimeters such as Topex, Jason 1/2, ERS 1/2 , Envisat , Saral or HY2 (e.g., Ablain et al 2015, Watson et al 2015). The installation of specific devices such as permanent GPS or corner reflectors adapted to present SAR missions (e.g., Sentinel 1) could be considered to conclude on this point.
6. Conclusions
Using InSAR, our findings suggest that differential ground motion in Dakar are generally low and do not exceed the 1 mm year−1 precision threshold of the method (upper bound). This general stability could not be anticipated from prior geologic knowledge or from the important urbanization of the city over the recent decades. A notable exception is the northern part of the harbor, which experiences subsidence likely due to land reclamation. Other geodetic instruments located in Dakar (Doris station, permanent GPS, tide gauge) display moderate vertical ground motions, which are statistically insignificant from zero within the precision of each method. As a result, the concerns related to coastal erosion, flooding and saltwater intrusion in aquifers should not be significantly aggravated by ground motion in Dakar. In terms of coastal adaptation, the consequence is appreciable compared to other large coastal cities presently affected by high rates of ground subsidence (in the order of 1 cm year−1 or more), in particular in South-East Asia.
Another important outcome of this study is related to the sea level changes. Sea level is considered an essential parameter in climate change research. However, tide gauge datasets are limited in size and quality, with a few century-scale stations at inter-tropical latitudes. Moreover, the tide gauge ground stability is of crucial importance to the study of the rate of change of coastal sea level. The historical tide gauge from Dakar appears located on a stable area with respect to three permanent GPS and a Doris station. Hence, extrapolating the lack of evidence that this area has been unstable from modern geodetic methods or from geologic data, the ongoing Dakar tide gauge data rescue will soon provide an accurate estimate of the rate of geocentric sea level rise over the past century, and help in the understanding of the spatial patterns of sea level rise.
Acknowledgments
This study was supported by the French Geological Survey (BRGM) through the EVARISTE project (Evaluation of local sea-level VARIations using Satellite TEchniques). We thank Pierre Nehlig for drawing our attention to previous geological investigations in Dakar. We thank the European Space Agency (ESA) for providing ERS and Envisat/ASAR SAR data as well as Sonel and the PSMSL data repository for providing a comprehensive access to GPS and tide gauge records. We thank three anonymous reviewers for their comments and suggestions that significantly improved this article.