

Abstract
Climate model based projections suggest a drying of the central European summer climate toward the end of the century. In this study we investigate the influence of the spatial resolution of an atmosphere-only climate model (EC-Earth at two resolutions, ∼25 and ∼112 km horizontal) on the simulated summer drying in this area. High resolution models have a more realistic representation of circulation in the current climate and could provide more confidence on future projections of circulation forced drying. We find that the high resolution model is characterized by a stronger drying in spring and summer, mainly forced by circulation changes. The initial spring drying intensifies the summer drying by a positive soil moisture feedback. The results are confirmed by finding analogs of the difference between the high and medium-resolution model circulation in the natural variability in another ensemble of climate model simulations. In the current climate, these show the same precipitation difference pattern resulting from the summer circulation difference. In the future climate the spring circulation also plays a key role. We conclude that the reduction of circulation biases due to increased resolution gives higher confidence in the strong drying trend projected for central Europe by the high-resolution version of the model.
Export citation and abstract BibTeX RIS

Content from this work may be used under the terms of the Creative Commons Attribution 3.0 licence. Any further distribution of this work must maintain attribution to the author(s) and the title of the work, journal citation and DOI.
1. Introduction
Summers are projected to become drier in central Europe due to anthropogenically forced climate change (Polade et al 2014). This is accompanied by an enhanced increase in air temperatures (Zampieri et al 2009).
The mechanisms involved in future precipitation change can be divided in thermodynamic and dynamic mechanisms (Polade et al 2014). Thermodynamic mechanisms include the consequences of the increase in atmospheric water vapor concentration and transport in a warmer climate. Dynamic mechanisms are related to changes in the atmospheric circulation: the descending Hadley cell branch and subtropical dry zones expand poleward and midlatitude westerlies adjust to a reduced equator-to-pole temperature gradient (Polade et al 2014) and other changes (e.g., Bladé et al 2012). If a model is biased in its circulation characteristics, this has an impact on the quality of other simulated variables such as temperature and precipitation, not only in the mean state but also in the changes due to the radiative forcing (van Ulden et al 2007).
General circulation models (GCMs) often do not have the spatial resolution required to have an accurate representation of synoptic systems affecting precipitation (e.g., van Haren et al 2013a, 2013b). Different studies have shown that aspects of the simulated circulation improve with increasing spatial resolution (e.g. Hack et al 2006, Champion et al 2011, Dawson et al 2012, Jung et al 2012, Berckmans et al 2013, Colle et al 2013, Demory et al 2013, Willison et al 2013, Zappa et al 2013, van Haren et al 2015). The need for improved circulation statistics for regional downscaling over Europe was emphasized by van Haren et al (2013a, 2013b). Because of their small spatial domain, regional climate models strongly depend on the synoptic systems provided by the driving GCM: they can refine their features but not change the large-scale circulation.
Numerous studies have studied the simulated future European summer climate in climate models. Most of these studies focus on local feedbacks (e.g. Vidale et al 2007, Haarsma et al 2009, Zampieri et al 2009, Seneviratne 2013, Teuling 2013, Vautard 2013, Mueller and Seneviratne 2014), but some studies have shown that large scale circulation is also a relevant driver (e.g., Rowell and Jones 2006, Bladé et al 2012). In this study we investigate the influence of GCM spatial resolution on simulations of future central European summer drying, checking the hypothesis that increased resolution leads to a more realistic circulation and hence circulation-induced changes in precipitation. We then use analogs to determine to what extent the circulation changes affect the projected drying trend. If they are indeed a major factor and the high-resolution model is more realistic, this would increase our confidence in projections of summer drying in central Europe. A reasoning that bears resemblance with the approach used in the work by Stegehuis et al (2013) on future European temperature change uncertainties.
2. Data and analysis domain
2.1. Data
The model used in this study is EC-Earth version 2.3 (Hazeleger et al 2012). The atmospheric component of the model is derived from the weather forecast model (IFS cycle 31r1) of the European Centre for Medium-Range Weather Forecasts (ECMWF). The experiment consists of two six-member ensembles of 5 year simulations members for both the current period (2002–2006) and the future period (2094–2098, RCP4.5 scenario, Moss et al 2010). We used the data from the experiments done by Haarsma et al (2013). The ensembles differ both in horizontal and vertical resolution. The high resolution model is at a T799L91 resolution (∼25 km horizontal resolution, 91 vertical levels), the medium resolution model is at a T159L62 resolution (∼112 km horizontal resolution, 62 vertical levels). Both the land surface component and the parameterizations packages of the high and medium resolution model are the same. For horizontal resolution, the physical parameterizations of the model are fixed and independent of the model resolution. Exceptions are that the relaxation time for CAPE is shorter at high resolution to respond more quickly to the increased vertical velocities (Bechtold et al 2008), and the fact that more orography is resolved at higher resolution. For vertical resolution, the high resolution model has a better representation of the highest parts of the model domain, but the representation for the troposphere is the same for both model resolutions (Stockdale and Beljaars 2015). Sea surface temperatures (SSTs) and sea-ice are prescribed for both the current and future period. For the current period these are from the optimum interpolation SST analysis (Reynolds et al 2002). For the future period SSTs are computed by adding the ensemble mean SST change as simulated by the ECHAM5/MPI-OM model used in the ESSENCE project (Sterl et al 2008). Future sea-ice coverage was computed by using a linear regression using the present SST and sea-ice cover fields (Haarsma et al 2013). Soil moisture fields were not saved from the experiment and could therefore not be used in the analysis.
For additional analysis to interpret the results we used data from an eight-member already existing readily available ensemble of coupled EC-Earth simulations for the RCP8.5 scenario. The coupled model is at a T159L62 resolution. We used the period 1982–2011 to represent the current period, and 2070–2099 to represent the future period. The ensemble therefore provides 240 years of data for each time-slice, which allows for a robust statistical analysis. In addition, the model ensemble allows to test our hypothesis under coupled ocean-atmosphere conditions.
Precipitation is verified against ERA-Interim (Dee et al 2011), a global atmospheric reanalysis produced by the ECMWF, extending back to 1979. ERA-Interim has a T255L60 resolution (∼80 km horizontal resolution, 60 vertical levels). An additional evaluation of the simulated precipitation is performed using the precipitation fields of the European ENSEMBLES project version 9.0 (Haylock et al 2008, E-OBS,  horizontal resolution). The dataset is based on meteorological station measurements and is designed to provide the best estimate of grid box averages to enable direct comparison with climate models. For both reanalysis and observations we used 1982–2011 to represent the current period.
All data was first regridded to the T159 grid of the medium resolution ensemble by means of second order conservative remapping (Jones et al 1999).
2.2. Analysis domain
We focus in this study on the climate change signal in central European summer precipitation between the beginning and the end of the 21st century (figure 1). This area is wet in the current climate but is projected to show strong drying under climate change. Because preconditioning plays an important role we investigate both the season with most pronounced drying, late summer (July–September) and the preceding three months, late spring (April–June). For simplicity we refer to those periods as summer and spring.
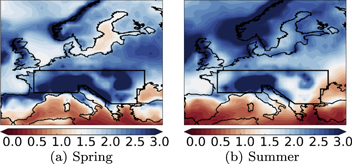
Figure 1. Mean precipitation in the current climate in the high resolution model (T799) for (a) late spring (April–June), and (b) late summer (July–September) (mm day−1). The analysis domain is outlined in black.
Download figure:
Standard image High-resolution image3. Analysis and results
3.1. Mean climate and climate change signal in the analysis domain
The seasonal cycle of modeled and observed precipitation averaged over the analysis domain are shown in figure 2(a) for the current climate. In general, the model has a similar representation of the annual cycle at both resolutions, but significant differences occur for individual months. Considering the spring and summer seasons, the high resolution model simulates significantly less precipitation in May, and significantly more precipitation in August. Compared to ERA-Interim and E-OBS there is a very significant overestimation (∼20%) of average precipitation throughout most of the year, with the exception of late summer, July–September.

Figure 2. Annual cycle of precipitation averaged over the analysis domain (a). Climate change signals (difference between 2070–2099 and 1982–2011) of precipitation (b), surface sensible heat flux (c), and evaporation (d). Confidence intervals (90%) are computed by bootstrapping (Efron and Tibshirani 1993, bias-corrected accelerated ( ) method) the 30 years of data, assuming all years are independent. (e)–(h) Difference in geopotential at 500 hPa (Z500) in the present climate between the EC-Earth simulations and ERA-Interim. Differences with
  (estimated with a two-sided t-test) have been made lighter.
Download figure:
Standard image High-resolution imagePanels 2(b)–(d) show the climate change signal for both the medium and high resolution model for precipitation, surface sensible heat flux and evaporation. Compared to the medium resolution model, the high resolution model simulates a slightly larger reduction of precipitation in spring (April–June, significant in the months April and June). In addition, the model simulates a much larger significant increase in evaporation in this period, resulting in drier soils at the beginning of summer. The much larger precipitation decrease in the high resolution model in summer (July–September, ∼ −0.8 mm day−1 for the high resolution model versus ∼ −0.5 mm day−1 for the medium resolution model) is accompanied by a decrease in evaporation and an increase in surface sensible heat flux, indicating drier soils. The high sensible heat flux produces a deeper, warmer and drier atmospheric boundary layer that tends to inhibit cloud formation. This positive land-atmosphere feedback intensifies the drying (e.g., Seneviratne 2013, Teuling 2013, Miralles et al 2014, Mueller and Seneviratne 2014).
Although the area-averaged precipitation in the current climate is similar in the high and medium resolution model (figure 2(a)), the models do differ in their circulation. The high resolution model has a more accurate representation of the atmospheric circulation in the current climate compared to ERA-Interim (figures 2(e)–(h)). In van Haren et al (2015) we found an improvement in the representation of the atmospheric circulation for the same region for the winter period as well using the same two model ensembles. The more accurate baseline provides more confidence in the simulated circulation response at this model resolution.
In order to better understand the larger drying due to anthropogenically forced climate change in the central European region in the high resolution model, we consider the differences in the climate change signal, for both spring and summer, in more detail in the next sections.
3.2. Dynamical driving mechanisms in spring
Figure 3 shows the climate change signal  for the high resolution model (figures 3(a)–(e)), as well as the difference in climate change signal between the high and medium resolution versions of the model
  for precipitation and related variables for the European region (panels 3(f)–(j)). The climate change signal in the geopotential at 500 hPa (Z500) is dominated by an increase over the Mediterranean area with an extension toward the British Isles, with the sea-level pressure (SLP) mainly showing the latter (figure 3(b)). The Northern extension is absent in the medium-resolution model (figure 3(g)). It causes drying over the British Isles and central Europe North of the Alps due to increasing subsidence, decreasing convection and increasing surface solar radiation (figures 3(e), (j)). This in turn results in an increase in evaporation and specific humidity (figures 3(c)–(d), (h)–(i)).
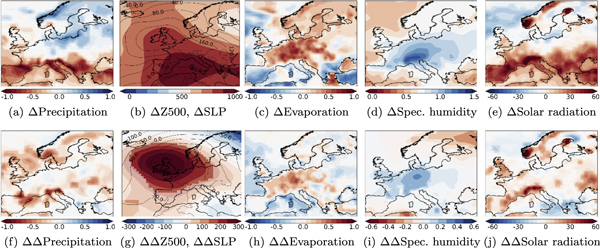
Figure 3. Top row: spring (April–June) climate change signal in the high resolution model for (a) precipitation (mm day−1); (b) geopotential at 500 hPa (shading, ( )) and mean sea level pressure (contour, (Pa)); (c) evaporation (mm day−1); (d) specific humidity (g kg−1); (e) net surface solar radiation (
 ). Bottom row: (f)–(j) same but for the difference in climate change signal between the high and low resolution model
  . Differences with p > 0. 1 (estimated with a two-sided t-test) have been made lighter.
Download figure:
Standard image High-resolution imageHowever, this does not explain the differences in precipitation in the Southern part of our analysis domain. The main change there is a larger decrease in precipitation in the high-resolution model on the south side of mountain ranges (figure 3(f)). This is due to a change in flow across these mountains, associated with the higher pressure over the British Isles, and higher mountains in the high-resolution version of the model. To estimate the relative contributions of these terms we computed the dependence of the precipitation P on the components (G) of the geostrophic wind ( ,
,  and vorticity (ω)). The average dependence dP/dG times the difference in geostrophic wind change, ΔΔ
G shows how much of the difference in precipitation change is due to the different circulation patterns between the high and medium resolution versions of the model. Conversely, the difference Δ dP/dG times the average change in mean flow Δ
G shows the effect of the different orography. Both terms turn out to contribute about equally to the lower precipitation on the south side of the mountains in spring (not shown).
and vorticity (ω)). The average dependence dP/dG times the difference in geostrophic wind change, ΔΔ
G shows how much of the difference in precipitation change is due to the different circulation patterns between the high and medium resolution versions of the model. Conversely, the difference Δ dP/dG times the average change in mean flow Δ
G shows the effect of the different orography. Both terms turn out to contribute about equally to the lower precipitation on the south side of the mountains in spring (not shown).
It should be noted that the modeled precipitation in this area is around 50% large-scale and 50% convective in late spring. The change in precipitation associated with the change in orography between the two resolutions is almost entirely in the large-scale component, so in the interaction with frontal systems with the mountains rather than local showers.
The increased pressure over the British Isles and the higher mountains therefore causes less rain and more solar radiation and hence increased evaporation in central Europe in the high-resolution model, resulting in drier soils at the start of summer.
An alternative explanation for the soil drying would be that it stems from different distributions of precipitation intensity. High precipitation rates increase runoff, and thereby ultimately the drying. However, we find a larger decrease for both moderate and extreme events for the high resolution model. Therefore, this is not likely to be a primary effect.
3.3. Climate change signal in July–September
The climate change signal for the high resolution model, as well as the difference in summer climate change signal between the high and medium resolution model, are shown in figure 4. Panel a shows the strong summer drying signal in central Europe. This is accompanied with a developing heat low over the Mediterranean (Haarsma et al 2009) and a pressure dipole between the British Isles and Greenland, the positive phase of the summer NAO (Bladé et al 2012). Evaporation is projected to become lower in the future over the land areas of central and Southern Europe due to drier soils and the increased pressure and lower relative humidity cause a large increase in solar radiation at the surface.

Figure 4. Climate change (2100–now) signal summer (July–September) for the high resolution model for (a) precipitation (mm day−1); (b) geopotential at 500 hPa (shading, ( )) and mean sea level pressure (contour, (Pa)); (c) evaporation (mm day−1); (d) specific humidity (g kg−1); (e) surface solar radiation (W m−2). (f)–(j) same but for the difference in climate change signal between the high and low resolution model
  . Differences with p > 0.1 (estimated with a two-sided t-test) have been made lighter.
Download figure:
Standard image High-resolution imageThe high resolution model shows a much larger decrease in precipitation in central and Southern Europe (figures 4(a), (f)). The difference in climate change signal in geopotential at 500 hPa and mean sea level pressure is a high pressure area over central and Southern Europe and a low pressure area over Northern Europe (figures 4(b), (g)). This results in an increase in zonal vapor transport mainly in the Northern half of central Europe and a decrease over the Mediterranean. Furthermore, the areas of high pressure are associated with an increase in subsidence, thereby decreasing convection and increasing surface solar radiation (figures 4(e), (j)). Drier soils in the high resolution model limit the rate of evaporation (figures 4(c), (h)), thereby reducing specific humidity (figures 4(d), (i)) and local recycling of moisture. Sensible heat flux and temperature increase (not shown).
3.4. Analogs in natural variability
In the previous sections we argued qualitatively that the circulation difference in the climate change signal between the high and medium resolution model (figures 3(g) and 4(g)) is an important driver for the stronger future summer drying in central and Southern Europe in the high resolution model. In order to test this hypothesis, we extract analogs of this pressure difference (at mean sea level) in the natural variability of a coupled model (figure 5). We assume that the difference in circulation response also shows up as natural variability in the coupled model. This enables us to isolate the effect of circulation on precipitation differences. If these are similar to the modelled differences between the two resolutions, the circulation changes are a major driver.

Figure 5. Analogs in natural variability of the circulation driven climate change signal (mm day−1). (a) Analogs based on MSL pattern summer (figure 4(b)) in the current climate; (b) analogs based on MSL pattern in summer (figure 4(b)) and spring (figure 3(b)); ((c)–(d)) same but for the future climate.
Download figure:
Standard image High-resolution image
To replicate the climate change signal, we make random combinations in the available 240 years of model data (e.g. (member 4, year 20) with (member 7, year 2)), both for the current and future climate. For each climate, this results in a total of 5 7360 possible combinations. Within each climate and for each season, pressure differences are computed for each of these 5 7360 possible combinations. To find analogs of the difference in pressure climate change signal between the high and medium resolution model (target patterns, contours in figures 3(g) and 4(g)), we compare the target pattern to the computed pressure differences in the coupled model (source patterns). The best matching source patterns are found by minimizing the area-weighted Euclidean distances between the (anomalized) pressure fields.
The effect of the difference in summer circulation change is computed from the closest matching 5000 summer source patterns to the summer target pattern (as visualized by the contours in figure 4(g)). The additional effect of a drier spring caused by the difference in spring circulation change is computed from the closest 500 matching spring source patterns to the spring target pattern (as visualized by the contours in figure 3(g)) in the pool of 5000 closest matching summer patterns. The number of extracted source patterns was chosen as such to have reasonable matching patterns (best ∼10% of the available pool), and still have a large enough sample size to perform a statistical analysis. We repeated the experiment with smaller sample sizes, yielding similar results.
Compared to the average summer precipitation in the coupled model, the analogs based only on summer circulation result in a decrease in precipitation over central Europe and the Mediterranean area, and an increase North of it (figures 5(a), (b)). This precipitation response is in agreement with the difference in precipitation change between the high and medium resolution model (figure 4(a)). The analogs based on both spring and summer circulation (figures 5(c), (d)) yield a similar pattern, but is intensified (from −0.16 to −0.22 mm day−1) in the future climate (area-averaged difference between figures 5(c) and (d) for our analysis domain is significant at p < 0. 05, estimated with a two-sided t-test). The results confirm that circulation differences in the high-resolution model compared to the medium resolution model in both spring and summer are important drivers for the stronger summer drying in central and Southern Europe. We note that the improvement in summer circulation could also help seasonal predictions in this area.
4. Conclusion
Future drying over mid-latitude continents is often assessed using climate model simulations. Here we investigate the influence of AGCM resolution on the simulated summer drying over the central European region by comparing the results of a medium (T159) and a high resolution version of the same AGCM (T799). The simulated circulation in the current climate in the high resolution model is more realistic, providing more confidence in the simulated circulation change at this model resolution.
We find that the high resolution model simulates a larger drying in spring, resulting in drier soils at the beginning of summer. The larger spring drying in the high resolution model is caused by two factors. The projected circulation change over the European area differs and the mountains in central Europe are resolved better.
The initial drying in spring is intensified in summer by a positive soil moisture feedback and a dipole structure in the pressure difference in climate change pattern between the high and medium resolution model. The dipole structure is one of high pressure over central and Southern Europe, and low pressure over Northern Europe, causing a decrease of moisture transport over Southern Europe and an increase in subsidence over central and Southern Europe, thereby reducing precipitation in this area.
The hypothesis that the circulation difference in the climate change signal between the medium and the high resolution model is an important driver for the difference in projected change in precipitation has been tested by finding analogs in the natural variability of a coupled model. The results confirm that circulation differences in both spring and summer are important drivers for the larger summer drying in central and Southern Europe in the high resolution model. Preconditioning in spring yields a stronger drying in summer. These results show that the improvements in the global circulation that are the result of increased resolution have a large influence on the local climate change projections in central Europe. Due to the smaller bias in the current climate we have more confidence in the strong drying trend of the high-resolution version of the model.
Acknowledgments
We would like to thank Tim Stockdale and Anton Beljaars (ECMWF) for the helpful comments about the code differences between the two model resolutions.