

Abstract
In 2014, Central England experienced its warmest year in a record extending back to 1659. Using both state-of-the-art climate models and empirical techniques, our analysis shows a substantial and significant increase in the likelihood of record-breaking warm years, such as 2014, due to human influences on climate. With 90% confidence we find that anthropogenic forcings on the climate have increased the chances of record warm years in Central England by at least 13-fold. This study points to a large influence of human activities on extreme warm years despite the small region of study and the variable climate of Central England. Our analysis shows that climate change is clearly visible on the local-scale in this case.
Export citation and abstract BibTeX RIS

Content from this work may be used under the terms of the Creative Commons Attribution 3.0 licence. Any further distribution of this work must maintain attribution to the author(s) and the title of the work, journal citation and DOI.
1. Introduction
The Central England temperature (CET) series is the longest instrumental time series of temperature in the world (Parker et al 1992). The monthly CET series extends back to 1659 whilst the daily CET goes as far back as 1772. In 2014, the highest annual value for the CET was recorded in the 356 year long series. During the last 60 years there has been a rapid warming in the CET which is consistent with the anthropogenic influence on the climate (Karoly and Stott 2006). This leads us to the question of what was the contribution of human-induced climate change to the 2014 record annual CET value.
Attribution studies of extreme climate events have been undertaken for many different types of event across a range of locations around the world with varying degrees of anthropogenic influences found (e.g. Peterson et al 2012, 2013, Herring et al 2014). The majority of event attribution analyses focus on larger regions than Central England so as to maximize the signal-to-noise ratio (e.g. Fischer et al 2013); for example, studies of the cold spring of 2013 in the UK (Christidis et al 2014) and the warm summer of 2013 in Western Europe (Dong et al 2014). Smaller regions and shorter timescales (between a single day and a month) may be studied using very large ensembles of regional model simulations, such as those based on the 'weather@home' setup (Massey et al 2014) which harnesses volunteers' computers to generate tens of thousands of simulations. Examples include analyses of heavy snowfall in the Pyrennes (Añel et al 2014) and heavy rainfall in the Danube and Elbe basins (Schaller et al 2014). The model-based component of our study uses an ensemble of state-of-the-art climate model simulations to examine the 2014 record CET. Our analysis uses a multi-model ensemble of simulations that is smaller than the weather@home ensemble. This is possible because we are studying an annual anomaly as opposed to a single day or month. The annual CET anomaly that is being studied has a higher signal-to-noise ratio than the events mentioned above. Therefore, differences between models, with differing attributes including a range of parameterization schemes, are more important relative to the natural variability, hence the multi-model set-up is preferred.
Our study employs two different methods for performing this event attribution; one analysis based primarily on climate model simulations (where we calculate the change in probability of a very warm year, like 2014, between simulations with natural-only forcings and simulations with both natural and anthropogenic forcings) and a second purely observations-based analysis (where the changing probability of exceeding a temperature threshold is investigated using a trend covariate). Using these two methods (described in more detail in section 3) allows for a comparison of the attribution statistics and provides increased confidence in our results. The sensitivity of the results to the methods used is discussed.
2. Data
The CET monthly series (Manley 1974, Parker et al 1992) updated to 2014 and maintained by the UK Met Office (http:metoffice.gov.uk/hadobs/hadcet/) was analysed. The CET series is calculated from a station network that varies through time (the locations of all stations are shown in figure 1(a)) and is designed to represent the climate of the English Midlands approximated by a triangular area enclosed by Lancashire in the North, Bristol in the South–West and London in the South–East. The CET has undergone thorough and extensive quality control (Parker et al 1992) and can, therefore, be studied in the context of event attribution. The annual CET value for 2014 was 10.93 °C, the highest in the 356 year series. However, it is worth noting that, at approximately 0.06 °C above the previous 2006 record, we cannot be entirely certain that 2014 was the warmest on record. Parker and Horton (2005) state that for annual mean CET values to be deemed significantly different a 0.25 °C difference is required.
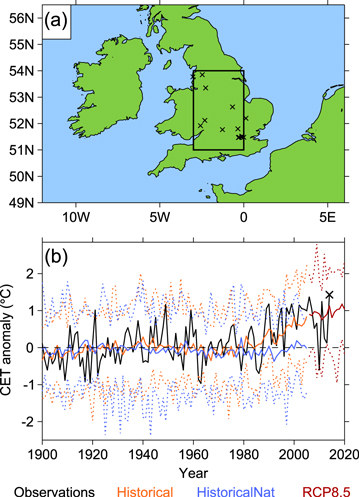
Figure 1. (a) Map with the Central England area marked (51°N–54°N, 3°W–0°E). The black crosses show the locations of stations used in the calculation of the CET at some time from 1659 to the present day. (b) Timeseries of the observed CET (black). Timeseries of the mean of the historical simulations (solid orange), RCP8.5 simulations (solid red) and historicalNat simulations (solid blue). The maximum and minimum values of the modelled CET are shown for the historical simulations (dashed orange), RCP8.5 simulations (dashed red) and HistoricalNat simulations (dashed blue). The record annual CET is marked by the black cross.
Download figure:
Standard image High-resolution imageA set of model simulations from the fifth phase of the Coupled Model Intercomparison Project (CMIP5; Taylor et al 2012) was analysed. Monthly surface air temperature data from historical (1900–2005), historicalNat (1900–2005), and RCP8.5 (2006–2020) simulations from climate models (listed in table 1) were used to calculate the change in likelihood of warm years like 2014 in the CET region due to anthropogenic influences on the climate. The historical simulations were run with both time-dependent anthropogenic (greenhouse gas concentrations, aerosols and ozone) and natural (solar and volcanic) forcings. The historicalNat simulations were run only with the time-dependent natural forcings (thus providing estimates of the Earth's climate without anthropogenic influences). The RCP8.5 simulations were run with projected increases in greenhouse gases and are a 'high-end emissions scenario' that agrees best with observed emissions since 2006. The choice of emissions scenario for analysis to 2020 is relatively unimportant compared to other sources of uncertainty (Hawkins and Sutton 2009). Only models with at least three historical simulations available on the Australian node of the Earth System Grid were analysed. An assessment of the model simulated variability in the Central England region was conducted, as described in section 3. In the models, the Central England region was defined as the area within 51°N–54°N and 3oW–0oE, also shown in figure 1(a).
Table 1. Table of CMIP5 model simulations analysed. Models shown in bold adequately captured historical variability of the observed CET and were used in the FAR analysis. The simulations in the HistoricalNat and RCP8.5 columns were bootstrapped to calculate 10 000 estimates of the FAR. The adjustments applied to the HistoricalNat simulations are shown for each model. The total numbers of Historical, HistoricalNat, and RCP8.5 simulations are shown in the bottom row.
| Model | Historical runs | HistoricalNat runs | RCP8.5 runs | Adjustment to HistoricalNat (°C) |
|---|---|---|---|---|
| ACCESS1.3 | 1,2,3 | 1 | 1 | −0.12 |
| CanESM2 | 1,2,3,5 | 1,2,3,5 | 1,2,3,5 | +0.09 |
| CCSM4 | 1,2,3,5 | 1,2 | 1,2 | −0.37 |
| CESM1-CAM5 | 1,2,3 | 1,2,3 | 1,2,3 | −0.08 |
| CNRM-CM5 | 1,2,3,5 | 1,2 | 1,2 | −0.13 |
| CSIRO Mk3.6.0 | 1,2,3 | 1,2,3 | 1,2,3 | +0.10 |
| FGOALS-g2 | 1,2,3,5 | |||
| GISS E2 H | 1,3,5 | 1 | 1 | −0.44 |
| GISS E2 R | 1,2,3,5 | 1,2 | 1,2 | −0.43 |
| HadGEM2-ES | 1,2,3,5 | 1,2,3 | 1,2,3 | −0.37 |
| IPSL-CM5A-LR | 1,2,3,5 | |||
| IPSL-CM5A-MR | 1,2,3 | 1 | 1 | −0.34 |
| MIROC-ESM | 1,2,3 | 1 | 1 | +0.02 |
| NorESM1-M | 1,2,3 | 1 | 1 | +0.21 |
| Total | 49 | 24 | 24 |
The observed CET time series and the mean, minimum and maximum CET in each set of model simulations are shown in figure 1(b).
3. Methods
The CMIP5 analysis largely follows the methodologies of Lewis and Karoly (2013, 2014) used to study Australia's record hot 2013 annual and summer temperatures. Here we outline the exact methods applied in the model analysis. Annual temperatures anomalies were calculated (relative to a 1961–90 climatology) for the 1900–2005 period for the historical and historicalNat simulations from 14 climate models (see table 1). Annual temperature anomalies for the 2006–2020 period were also calculated for each RCP8.5 simulation (relative to the 1961–90 climatology in the corresponding historical run).
Gridboxes containing at least 75% land were used to calculate the area-average CET. All model simulations were regridded onto a common regular 1.5° resolution grid.
A sub-selection of models that adequately capture the variability of observed annual temperature variability in the Central England region was made. A Kolmogorov–Smirnov (KS) statistic was calculated to compare the probability density function (PDF) of annual temperature anomalies from each model's historical simulation with the PDF of the CET series over the 1900–2005 period. Models were selected for further study if at least three historical simulations were available and no more than one simulation was significantly different (p < 0.05) from the observed CET anomalies. The models that passed this test are shown in bold in table 1. There is good agreement between the statistical distributions of those models that passed the test, and were therefore used in our attribution study, and the PDF of observed annual CET anomalies (figure 1(b)). The observed trend of the mean CET over 1950–2011 is also well within the CMIP5 ensemble in this region (van Oldenborgh et al 2013).
The historicalNat (1900–2005) and RCP8.5 (2006–2020) simulations were used to perform the attribution analysis. The historicalNat temperature anomalies, defined relative to a 1961–1990 period, were adjusted for any change in temperature prior to the 1961–1990 climatological period as simulated by each climate model. This adjustment, ΔT, compensates for the warming trend up to the reference period 1961–1990 and was calculated as:
where  and
and  are the average temperatures in the historical simulations for 1901–1930 and 1961–1990 respectively, and
  and
and  are the average temperatures in the historicalNat simulations for 1901–1930 and 1961–1990 respectively. The adjustments applied to each model are shown in table 1.
Using the adjusted historicalNat simulations and the RCP8.5 simulations, a fractional attributable risk (FAR; Allen 2003) calculation was performed. The FAR was calculated as:
where PHistNat and PRCP8.5 are the probabilities of a warm annual CET value (T > + 1.38 °C) in the historicalNat and RCP8.5 simulations respectively. The threshold for the FAR analysis of +1.38 °C was chosen as it is the second warmest annual CET anomaly in the observed 1659–2014 series and occurred in 2006. This meant the FAR analysis could be used to answer the question of whether anthropogenic climate change has increased the chance of years warmer than 2006 in Central England, such as 2014.
In order to estimate the uncertainty in the FAR, the historicalNat and RCP8.5 simulations were bootstrapped with replacement such that 10 000 sub-samples each composed of half of the complete number of model simulations were chosen each time to calculate the FAR statistic. Ranking these 10 000 FAR statistics means the median and 10th percentile FAR values can be extracted and these are shown in section 4 and figure 2.
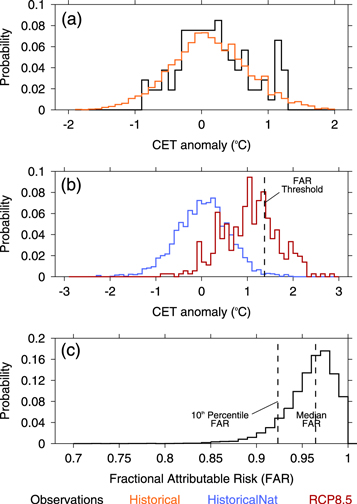
Figure 2. (a) Histograms of the observed CET (black) over 1900–2005 and the modelled CET (orange) in historical simulations over 1900–2005 by models that adequately capture the variability of the observed CET. (b) Histograms of the annual CET anomalies (relative to 1961–90) in the HistoricalNat simulations for 1900–2005 (blue) and RCP8.5 simulations (red). The dashed line marks the 2006 observed CET anomaly used in the FAR analysis. (c) Histogram of the 10 000 FAR values calculated from bootstrapping the historicalNat and RCP8.5 model simulations. The dashed lines mark the median FAR value and 10th percentile FAR value.
Download figure:
Standard image High-resolution imageAn alternative methodology was also used involving the application of empirical techniques to the available observational data (van Oldenborgh 2007, van Oldenborgh et al 2012). This empirical methodology is outlined below. This methodology allows for a detection of changes in the likelihood of warm years like 2014 in the CET time series. The attribution to anthropogenic factors is then done by relating changes in the extremes, captured by the trend covariate, to changes in the mean that have been attributed to anthropogenic forcings in a previous analysis, in this case by Karoly and Stott (2006). That study found that two-thirds (±one-third) of the 100 year warming in the CET annual series up to 1999 could be attributed to anthropogenic forcings.
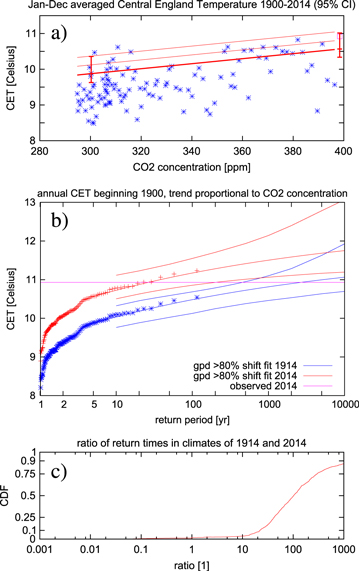
The statistical model we used to detect trends in extremes was a peak-over-threshold method. The 20% warmest years above a time-varying threshold were fitted to a generalized Pareto distribution (GPD). This is a very low threshold, but still only gives 23 points for fitting the GPD (figure 3(a)). The GPD is used to allow for non-normal tails, although in this case it is not strictly necessary as a normal distribution fits the observations quite well. The threshold is allowed to vary nonlinearly with time; it is proportional to the increasing carbon dioxide concentration in the atmosphere, which is strongly correlated with the global average surface air temperature (r = 0.9). The rate at which the threshold increases is determined simultaneously in the maximum-likelihood fit. The empirical analysis was restricted to the period after 1900, as before this time there is higher variance in the annual CET series (likely related to observational biases). The event being studied, the record 2014 temperature value, was also not included in the fit. The GPD was then bootstrapped 1000 times to estimate the uncertainties in this analysis.
Figure 3. (a) Observed CET 1900–2013 (blue), 2014 (purple box), threshold of the GPD fit (red) with 95% confidence intervals at 1914 and 2014, the thin red lines indicate the threshold plus (two times) the scale parameter. (b) Return times of the GPD fit for the climate of 2014 (red lines) and the climate of 1914 (blue lines) with 95% uncertainty margins (estimated with a 1000-member non-parametric bootstrap). The crosses denote the annual CET observed values shifted up by the fitted trend to the climate of 2014 (red) and down to 1914 (blue). The horizontal line gives the observed value in 2014, and the intersections with the curves mark the return times corresponding to the two climates. (c) The cumulative distribution of the ratio of the return times, equivalent to the FAR. The median is at 100 (FAR = 0.99) and the 10th percentile is at 22 (FAR = 0.95).
Download figure:
Standard image High-resolution image
Using the resulting GPD with time-varying threshold allows for the calculation of return periods of the 2014 temperature in the climate of 2014 and the climate of 100 years ago. A ratio of these values gives the increase in the return period due to the anthropogenic influence on the climate. The FAR due to the trend can be computed trivially from this ratio. Note that this is larger than the FAR due to anthropogenic factors as the uncertainties in the attribution step are not included.
4. Results
The historical simulations of 12 CMIP5 models adequately captured the variability in annual temperature anomalies seen in the Central England region (shown in bold in table 1). The observed trend also agrees well with the multi-model mean trend. The strong agreement of the multi-model PDF with the PDF of the observational CET series is shown in figure 2(a).
Using the historicalNat (after applying the temperature adjustment) and RCP8.5 simulations, the FAR estimates could be made. The PDFs of the model historicalNat and RCP8.5 simulations (figure 2(b)) are significantly different at the 5% level as measured by a KS-test. The return periods for years hotter than 2006 in the historicalNat and RCP8.5 simulations are 121 years and five years respectively. The 10 000 FAR estimates, based on 50% sub-samples of the historicalNat and RCP8.5 simulations, point to a significant anthropogenic role in the record warm 2014 CET value (figure 2(c)). The estimate of the median FAR is 0.96. This equates to a median estimate for the increase in risk of warm years of 28-fold. The more conservative 10th percentile FAR is 0.92. This means that we can state, with 90% confidence, that anthropogenic climate change has increased the risk of warm years, such as 2014, in Central England by at least 13-fold.
We assessed the sensitivity of the FAR results using two further tests. Firstly, we used the observational uncertainty estimates (standard error estimated at 0.09 °C) from Parker and Horton (2005) to examine the sensitivity of the FAR to the threshold used. The FAR analysis outlined in section 3 was repeated for a range of 18 additional thresholds at 0.01 °C intervals between 0.09 °C below and above the 2006 annual CET value. The effect on the 10th percentile and median FAR estimates was negligible. Secondly, the use of the full model set (including the two models which failed to adequately reproduce the observed distribution of annual CET values; listed in table 1) was compared with analysing only the subset of 12 models in the original analysis. The FAR calculations were again applied using the same methodology to the expanded set of model simulations and the effect on the distribution of FAR values, including the 10th percentile and median values, was negligible. The FAR statistics are, therefore, insensitive to uncertainties in the threshold and the model selection.
The empirical analysis of the observational data produced similar results to the model analysis despite it answering a slightly different question (as the attribution step is excluded). The 1000 bootstrapped estimates of the GPD fit applied to the warmest years in the CET series were used to calculate return periods for the 2014 CET value and confidence intervals (figure 3(b), table 2). The best estimate of the return period for the annual 2014 CET value in the climate of 1914 is about 2500 years, with a lower bound of the 95% confidence interval of 350 years. This means that an annual mean CET as high as the 2014 value or higher would not have been impossible but highly improbable, a result which is compatible with the climate model result above. However, in the climate of 2014 the best estimate of the return period is substantially reduced to about 25 years. This means there is a 100-fold reduction in the best estimates of the return periods of warm years like 2014 (figure 3(c)). Using the bootstrapped estimates of the GPD fit, this empirical analysis finds that anthropogenic climate change has, with 90% confidence, increased the likelihood of warm years in Central England, like 2014, by at least 22-fold. Assuming a normal distribution rather than the GPD gives a return time in the current climate of about 10 years and a lower bound of the 90% confidence interval of the ratio of 48. The difference is due to the GPD fit finding a smaller trend in the warm years than in the mean trend.
Table 2. Table of return periods and confidence intervals for the CET in 2014 relative to the climates of 1914 and 2014 and the ratio.
| Return period (years) | Confidence intervals (2.5–97.5%) | |
|---|---|---|
| Climate of 1914 | 2500 | 350–1.5 × 10⁶ |
| Climate of 2014 | 25 | 4–200 |
| Ratio | 100 | 5–40 000 |
5. Conclusions
Central England experienced its warmest year on record in 2014 in a series that extends back to 1659. By using both climate model simulations and the observed CET series, we show that anthropogenic climate change very likely played a major role in this record warm year.
Model simulations with and without anthropogenic influences on the climate and the application of a FAR methodology were used to assess the role of anthropogenic climate change in the record warm 2014. This analysis suggests, with 90% confidence, that the anthropogenic influence on the climate has increased the likelihood of warm years in Central England, such as 2014, by at least 13-fold.
The empirical techniques applied to the observational CET series produced remarkably similar results to the model simulations. The results of this analysis pointed to an increase in the probability of warm years like 2014 by at least a factor of 22-fold between 1914 and 2014, with 90% confidence.
A large difference in the return periods between the two methods was found. The return periods are much shorter based on the model analysis (historicalNat: 121 years, RCP8.5: five years) than the best estimates from the empirical analysis (climate of 1914: 2500 years, climate of 2014: 25 years). This is in part related to the larger sample size and also slightly higher variability in the models giving a longer warm tail to the distribution than is seen in the observations (figure 2(a)), where the 95% bootstrapped confidence interval goes down to 12 years. The difference in the change in likelihood estimates between the two methods is partially related to uncertainties in the attribution step not being included in the empirical method.
A direct comparison of the results from the different methods is difficult due to slight differences in assumptions. However, overall, the agreement in the results is strong, in part because of the breadth of the confidence intervals on the increase in likelihood of warm years derived from the empirical technique (table 2) and the similarly broad distribution in FAR statistics based on the model simulations (figure 2(c)). A substantial increase in the likelihood of warm years due to anthropogenic influences is found using both methods with very high confidence. This conclusion is robust especially when we consider that the two methods are primarily based on different datasets, one model simulations and the other observations.
It is remarkable that such a substantial anthropogenic influence can be found for an annual extreme in a region as small as Central England. Despite the variability in the climate seen in this part of the world, even on annual time-scales, the anthropogenic warming signal is evident. Trends in extremes can even be detected on seasonal timescales except in winter when variability is larger. It is unlikely that such a strong anthropogenic influence would be detected on shorter timescales, such as months or days, due to higher variability. The methodologies employed here may provide a framework for further event attribution studies on smaller spatial scales than studied previously.
Overall, this study provides substantial evidence to suggest that the anthropogenic influence on the climate has significantly increased the likelihood of warm years in Central England.
Acknowledgments
This research was supported by the ARC Centre of Excellence for Climate System Science (grant CE 110001028) and the NCI National Facility in Australia. G J van Oldenborgh was supported by the NWO project 'Trend or Coincidence' and the EUCLEIA project funded by the European Union's Seventh Framework Programme [FP7/2007–2013] under grant agreement no. 607085. We acknowledge the World Climate Research Programme's Working Group on Coupled Modelling, which is responsible for CMIP, and we thank the climate modelling groups for producing and making available their model output. For CMIP the US Department of Energy's Program for Climate Model Diagnosis and Intercomparison provides coordinating support and led development of software infrastructure in partnership with the Global Organization for Earth System Science Portals. We also thank the Met Office for providing the annual Central England Temperature series through the HadOBS website (http:metoffice.gov.uk/hadobs/hadcet/).