

Abstract
Desertification in the Tibetan Plateau (TP) has drawn increasing attention in the recent decades. It has been postulated as a consequence of increasing climate aridity due to the observed warming. This study quantifies the aridity changes in the TP and attributes the changes to different climatic factors. Using the ratio of precipitation to potential evapotranspiration (P/PET) as an aridity index, we used observed meteorological records at 83 stations in the TP to calculate PET using the Penman–Monteith algorithm and the ratio. Spatial and temporal changes of P/PET in 1979–2011 were analyzed. Results show that stations located in the arid and semi-arid northwestern TP are becoming significantly wetter, and half of the stations in the semi-humid eastern TP are becoming drier, though not significantly, in the recent three decades. The aridity change patterns are significantly correlated with the change patterns of precipitation, sunshine duration and diurnal temperature range. Temporal correlations between the annual P/PET ratio and other meteorological variables confirm the significant correlation between aridity and the three variables, with precipitation being the dominant driver of P/PET changes at the interannual time scale. Annual PET are insignificantly but negatively correlated with P/PET in the cold season. In the warm season, however, the correlation between PET and P/PET is significant at the confidence level of 99.9% when the cryosphere near the surface melts. Significant correlation between annual wind speed and aridity occurs in limited locations and months. Consistency in the climatology pattern and linear trends in surface air temperature and precipitation calculated using station data, gridded data, and nearest grid-to-stations for the TP average and across sub-basins indicate the robustness of the trends despite the large spatial heterogeneity in the TP that challenge climate monitoring.
Export citation and abstract BibTeX RIS

Content from this work may be used under the terms of the Creative Commons Attribution 3.0 licence. Any further distribution of this work must maintain attribution to the author(s) and the title of the work, journal citation and DOI.
1. Introduction
Desertification is the persistent degradation of dryland ecosystems due to human activities and variations in climate (United Nations Convention to Combat Desertification (1994), Green Facts 2013). It is a significant global ecological and environmental problem that has received widespread attention since the United Nations Conference on Desertification in Nairobi in 1977 (Glantz and Orlovsky 1983). As desertification takes place, the landscape may progress through different stages and continuously transform in appearance (Klausmeier 1999). Across the world, desertification affects the livelihoods of millions of people who rely on the benefits that dryland ecosystems provide. It has played a significant role in human history as we witnessed loss of human lives and livestock and widespread environmental deterioration (Green Facts 2013). Therefore, desertification is one of the greatest environmental challenges and a major barrier to meeting ecological and human needs in drylands.
Different definitions of desertification appear in the literature through the lens of various disciplines, such as climatology, hydrology, geomorphology, soil science and vegetation dynamics. Desertification can result from combined effects of natural and anthropogenic factors and processes, with climatic change being the main driving force (Dong 2004, Liu et al 2005). Terrestrial aridity is one of the climatic change phenomena contributing to desertification. Desertification and aridity are highly related, particularly in areas with limited human accessibility.
With an average altitude above 4000 m, The Tibet Plateau (TP) encompasses a vast geographical coverage and complex climatic influence (Wang et al 2008, Yang et al 2014). The annual mean surface air temperature in the TP is around the freezing point and decreases with increasing altitude. The annual precipitation amount observed at the CMA stations is about 400 mm or more at most stations located in southeastern TP stations due to the influence of the Asian summer monsoon, but it decreases to around 200 mm or less at most stations in northwestern TP not reachable by the moisture from the summer monsoon (Yang et al 2011). According to the mean annual precipitation amount, the TP region can be divided into four climate zones: arid, semi-arid, semi-humid, and humid progressing from the northwestern to the southeastern TP. The ecosystems over the vast northwestern TP are rather fragile. Meanwhile, TP is one of the regions most sensitive to climate change (Liu and Chen 2000, Wu et al 2007, Liu et al 2009, Kang et al 2010). Recent investigations have revealed that desertification has become a severe environmental problem in the TP (Tu et al 1999, Feng et al 2006, Xue et al 2009, Dong et al 2010) due to the significant warming (Liu and Chen 2000, Wu et al 2007, Solomon et al 2007, Wang et al 2008, Krause et al 2010, Moore 2012). If desertification greatly expands, it may have unforeseen influence on the global climate given the important role of the TP as an elevated heat source and sink that drive global circulation (Fang et al 2004, Li et al 2010). Held and Soden (2006) discussed a wet gets wetter and dry gets drier thermodynamic mechanism for hydrological cycle changes under global warming based on the Clausius–Clapeyron (C–C) relation. Some studies addressed a global expansion in drought (Loukas et al 2008, Li et al 2009, Dai et al 2011, Chen and Chen 2013, Trenberth et al 2014, Fu and Feng 2014) or drylands (Feng and Fu 2013) due to the warming. The expansion of drylands as a result of warming that increases evaporative demand has a direct impact on desertification, and is a central issue for sustainable development in arid, semiarid, and dry sub-humid areas. Studies in the TP have reported an expansion of desertification from 1990 to 2005 (Li et al 2010, Dong et al 2012). Although recent temperature records have revealed a hiatus in global warming after 2000 (Easterling and Wehner 2009), the TP has experienced a consistent warming rate without abatement. Following the 'dry gets drier' and enhanced aridity under warming arguments, the vast northwestern TP may have become drier during the last warming and desertification may present an imminent challenge for the region.
As Seager and Vecchi (2010) argued, the net precipitation (i.e., precipitation minus evapotranspiration) is bounded by zero over land, so the simple argument of wet gets wetter and dry gets drier cannot explain continental drying in a warmer climate. Using various hydrological datasets, Greve et al (2014) did not find robust dryness changes over three-quarters of the global land area between 1948 and 2005. Over the TP, precipitation and snowpack do not show consistent and plateau-wide changes during the past decades (Krause et al 2010, Yang et al 2011, Gao et al 2014). A majority of rain gauge records and station measurements have presented increasing trends in precipitation, lake area and water level (Bian et al 2006, Wu and Zhu 2008, Zhu et al 2010, Yao et al 2012, You et al 2012). Other studies also reported positive P–E (precipitation minus evapotranspiration) changes over the TP (Shi et al 2007, Krause et al 2010, Yang et al 2011, Yin et al 2012, Gao et al 2014), indicating that the TP is getting wetter in general, especially in the vast northwestern TP. The diverse arguments and observational evidences motivate a need to investigate the aridity response to climate changes in the TP and which observed climatic factors contribute more dominantly to the aridity changes.
Aridity indices are commonly used to detect the potential risk of occurrence and severity of aridity changes and to attribute the spatial-temporal changes. Several aridity indices were developed based on different variables and parameters (Jain et al 2010, Hasan and Murat 2011, Lampros et al 2011, Liu et al 2012, Maliva and Missimer 2012). One of these aridity indices is defined by the ratio of annual precipitation (P) to annual potential evapotranspiration (PET) (Middleton and Thomas 1992) which has been recommended by the Food and Agriculture Organization (FAO) (Fu and Feng 2014) and has seen widespread used by the United Nations educational, scientific and cultural organization (UNESCO), Global environment monitor system (GEMS), Global resource information database (GRID) and Desert cure and prevention activity center (DC/PAS). PET is the evaporative demand of the atmosphere that indicates the maximum amount of evapotranspiration possible without constrained by water availability in a given climate (Lu et al 2005, McMahon et al 2013). The P/PET ratio is thus a quantitative indicator of the degree of water deficiency at a given location (White and Nackoney 2003, Fu and Feng 2014).
This study analyzes the aridity changes in terms of the P/PET ratio in the TP during the recent three decades and investigates the aridity response to climate change. We specifically address the following questions: what aridity change has been observed in the TP, which observed climate change factor contributes the most to the aridity change, and how representative are station observations of changes at the basin scale? The manuscript proceeds with section 2 that introduces the methods and data used, followed by section 3 that analyzes the spatial and temporal changes of the aridity changes. To address the representativeness of the stations for domain average, scaling issue is also explored in section 3. Lastly, section 4 concludes and discusses our findings.
2. Methods and data
The most critical step in estimating P/PET is the calculation of PET. Many approaches have been used to calculate PET. The two most popular methods used the Thornthwaite and Penman–Monteith (PM) algorithm (Maidment 1993). Previous studies found that the PM algorithm is more reasonable than Thornthwaite in global desertification study (Dai 2011, Sheffield et al 2012) and in the environment of China (Chen et al 2005). The PM algorithm is derived from physical principles and is superior to empirically based formulations that usually only consider the effect of temperature, which arguably has a more reliable observational record globally (Donohue et al 2010, Dai 2011, Sheffield et al 2012). It is recommended by FAO as the standard method to compute PET (Allen et al 1998) and widely used in China (Gao et al 2006). In this study, we calculated PET using the PM algorithm that includes the effects of surface air temperature, humidity, solar radiation and wind. This algorithm can be written in the form derived by Allen et al (1998) using the combination equation:
where Rn is the net radiation, G is the soil heat flux, (es–ea) is the vapor pressure deficit of the air,  is the mean air density at constant pressure, cp is the specific heat of the air, Δ represents the slope of the saturation vapor pressure temperature relationship,
 ![$\Delta =\frac{4098\left[ 0.6108{\rm EXP}\left( \frac{17.27T}{T+237.3} \right) \right]}{{{\left( T+237.3 \right)}^{2}}},$](https://content.cld.iop.org/journals/1748-9326/10/3/034013/revision1/erl510273ieqn2.gif) γ is the psychrometric constant, rs and ra are the bulk surface and aerodynamic resistances. λ is the latent heat of vaporization. The aerodynamic resistances ra can be written as (Scheff and Frierson 2014):
γ is the psychrometric constant, rs and ra are the bulk surface and aerodynamic resistances. λ is the latent heat of vaporization. The aerodynamic resistances ra can be written as (Scheff and Frierson 2014):  where CH is the bulk transfer coefficient, u is wind speed at 2 m height.
Therefore, the Penman–Monteith method can be derived as (Feng and Fu 2013):
PET and P/PET were calculated based on the historical observations at 83 China Meteorological Administration (CMA) stations in the TP. The period of records for each station is different. For compatibility in the observation data for all stations, a common period 1979–2011 is used for analysis. Station and basin (TP) average dryness and wetness changes in the recent three decades are analyzed in terms of the spatial pattern, interannual fluctuation and seasonal variability. The percentage change in 1998–2011 compared to 1979–1997 is calculated as the aridity changes between the two periods divided by the climatology of 1979–1997. The aridity change could be decomposed into contributions from P change and PET change (please see the details for equation (4) in Feng and Fu 2013). Accordingly, the percentage contributions of P and PET changes in 1998–2011 relative to 1979–1997 are calculated as the ratios of contributions of P and PET changes divided by the P/PET change.
The whole TP can be divided into nine sub-basins: Tarim River basin (TRB), Qilian Mountain (QLB), Qaidam basin (QDB), Chang Tang Plateau (CTB), Yangtze River (YTR), Yellow River (YLR), Mekong River (MKR), Salween River (SWR), Brahmaputra River (BPR), and India River (IDR), as shown in figure 4. Scaling issue is discussed to evaluate the representativeness of the basin average observation at station and grid scales. Gridded surface air temperature and precipitation data sets are provided by the National Climate Center, CMA with a spatial resolution 0.5° × 0.5°, which was generated based on temperature observation from 2472 stations and observed precipitation from 2416 stations in 1961–2012 in China. The 83 stations over the TP in our analysis are part of the stations included by the National Climate Center. An optimal interpolation method is used based on climatological background field to substantially reduce analysis error arising from heterogeneity of precipitation (please see Shen et al 2010 for details).
3. Results and discussions
3.1. Spatial changes in P/PET
Figure 1 presents the P/PET changes and the relevant variables changes at the observation stations in the TP in 1979–2011. We note that 64 out of 83 stations present increased P/PET in the TP in the recent three decades, except for stations in the IDR and the YLR, YZR, MKR and BPR where scattered stations show insignificant decrease (figure 1(a)). The increasing trends in 50% of the stations in the northwestern TP pass the two pair significant t-test at the confidence level of 90%. The P/PET climatology presents a gradient that increases from less than 0.05 in the northwestern TP to larger than 0.65 in the southeastern TP. QDB, CTB, TRB, QLB and the source of the YTR and BPR are located in the arid and semi-arid region but other basins are located in the humid and semi-humid region. The P/PET change pattern infers an observed wetting trend in the arid/semi-arid regions in the northwest and the south, with a drying trend sandwiched in the eastern area, although the number of stations in the western basins is lower compared to the east.
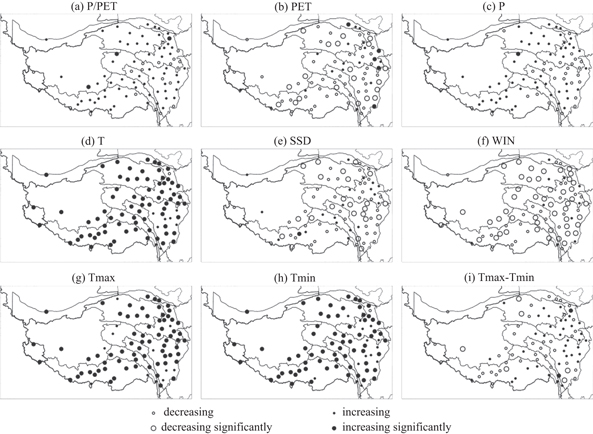
Figure 1. The spatial distribution of the significance in annual variation trend of P/PET, PET, P, T, SSD, WIN, Tmax, Tmin and DTR during 1979–2011 overin the TP in 1979–2011. (T, Tmax and Tmin are at the 99.9% confidence level based on the two-paired Student's t-test and other variables are at the 90% confidence level).
Download figure:
Standard image High-resolution imageTemperature (T), Tmax and Tmin all present a robust significant increase in the TP (figures 1(d), (g), and (h); You et al 2012). In contrast, PET, sunshine duration (SSD), wind speed (WIN) and diurnal temperature range (DTR) show robust and significant decreases in the TP except for scattered stations in the eastern TP for DTR (figures 1(b), (e), (f), and (i)). Precipitation (P) presents a significant increasing trend at 13 stations in the northwestern TP. About 23% and 44% of the stations in the YTR and Yellow River (YLR) basins show decreases in P although they are insignificant at the confidence level of 90% in the two-pair significant t-test. Figures 1(a) and (c) indicate that P changes possess the highest degree of spatial similarity with the P/PET changes among all relevant variables. Spatial pattern correlations of the P/PET changes with relevant observed variables indicate that the P/PET changes are significantly correlated with P, SSD, WIN, DTR and Tmin changes, sequentially in decreasing order (table 1). The pattern correlation between P/PET changes and P changes in the TP is the highest (0.97) among all the observed climate variables used in the P/PET calculation. The highest and positive correlation indicates that P/PET changes are predominantly caused by changes in P.
Table 1. Pattern correlations between P/PET (PET) and climate variables in the TP. Correlations passed the two-paired Student's t-test significantly at the 99.9% confidence level are in bold. The degree of freedom is 83.
| PET | P | T | Tmax | Tmin | SSD | WIN | DTR | |
|---|---|---|---|---|---|---|---|---|
| P/PET | −0.24 | 0.97 | 0.30 | 0.26 | 0.39 | −0.77 | −0.43 | −0.40 |
| PET | −0.11 | 0.43 | 0.38 | 0.40 | 0.10 | 0.45 | −0.12 |
P/PET changes are negatively correlated with PET, SSD, WIN and DTR changes. The latter three correlation coefficients reach −0.77, −0.43 and −0.40, respectively (table 1). Correlations between PET and other variables suggest that T and WIN changes have contributed to the P/PET pattern change through changes in PET. Previous studies found that T, SSD, WIN and DTR all contribute to PET changes in mainland China (Liu et al 2006, Xu et al 2006). Contrary to previous studies (Liu et al 2006, Li et al 2010), SSD and DTR do not significantly contribute to the PET change pattern in the TP; however they contribute to the aridity change. This suggests that SSD and DTR affect aridity in a more complex way than simply increasing the PET. Melting of the cryosphere might play a role as it influences PET by mediating the impacts of SSD and DTR through surface albedo, latent heat, and sublimation.
Pattern correlations between P/PET and PET or T changes are insignificant at the 99.9% confidence level. This is in contrast with Feng and Fu (2013) who showed that T changes dominate the global P/PET changes. This inconsistency might be related to the different spatial scales. Feng and Fu (2013) studied changes in the global averages, but at global scale changes in precipitation are minor and mostly insignificant (Wu et al 2013). Hence, temperature changes dominate the global aridity changes. In this study, we focus on the TP that has experienced higher warming rate than its surroundings and global average in the recent decades. As a consequence of the warming in an elevated region, thermal wind changes may lead to precipitation changes that are enhanced by feedback from circulation changes (Gao et al 2014). Hence regional responses to global change could be very different and region specific.
3.2. Interannual trends in P/PET
Since P, SSD, WIN and DTR are highly spatially correlated with the P/PET changes, figure 2 shows the correlations between the annual P/PET and P, SSD, WIN, DTR as well as T and PET at each station in the TP. Overwhelmingly, annual P is significantly correlated with P/PET at all stations based on a two-pair t test at the confidence level of 99%. Annual T is insignificantly correlated with P/PET in 1979–2011 at all stations. PET significantly and negatively correlated with P/PET changes in the southern TP, highlighting the important of PET for this region. DTR is significantly and negatively correlated with P/PET changes in the TP except for QDM and BPR.
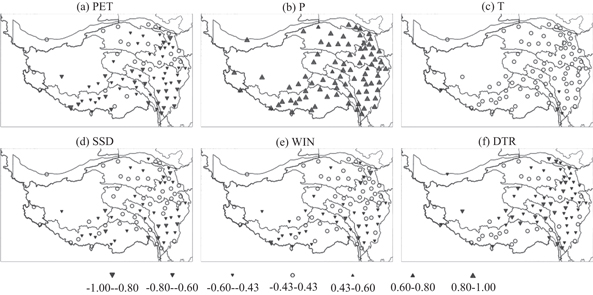
Figure 2. Spatial distribution of temporal correlations between P/PET and other climate variables at the 99% confidence level based on the two-paired Student's t-test (triangles, (a) (PET), (b) (P), (c) (T), (d) (SSD), (e) (WIN) and (f) (DTR)).
Download figure:
Standard image High-resolution imageTemporal correlations between annual P/PET and climate variables in 1979–2011 averaged over the TP and sub-basins are listed in table 2. Annually, TP averaged P/PET is significantly correlated with P, SSD and DTR at the 99.9% confidence level (table 2). Consistent with the highest spatial correlations between P and PET, P/PET is highly temporally correlated with P averaged on all sub-basins. All of the correlation coefficients are above 0.9 except for IDR. Temporal correlations of P/PET with PET, SSD, WIN and DTR on basin average are all negative. The highest correlations next to P are SSD and DTR. Seven basin averages and the TP average pass the two pair significant t-test at the 99.9% confident level for SSD and DTR. High temporal correlations between annual P/PET with WIN only occur at CTB and MKR. Consistent with the spatial correlations, temporal correlations with T, Tmax and Tmin are very low. The high correlation between P/PET with SSD and DTR but not T changes implies that aridity in the TP is highly correlated with incoming energy changes but not temperature changes. This further hints at the role of the cryosphere in environmental changes in the TP under warming. The permafrost and other cryosphere components consume significant incoming energy to melt. Temperature changes reflect the combined effects of the warming and the complex cryosphere changes.
Table 2. Temporal correlation coefficients between annual P/PET and climate variables in 1979–2011 averaged over the TP and sub-basins: Tarim River basin (TRB), Qilian Mountain (QLB), Qaidam basin (QDB), Chang Tang Plateau (CTB), Yangtze River (YTR), Yellow River (YLR), Mekong River (MKR), Salween River (SWR), Brahmaputra River (BPR), and India River (IDR), the same in table 4. Correlations passed the two-paired Student's t-test significantly at the 99.9% confidence level are in bold. The degree of freedom is 33.
| PET | P | T | Tmax | Tmin | SSD | WIN | DTR | |
|---|---|---|---|---|---|---|---|---|
| TP | −0.53 | 0.91 | 0.20 | 0.07 | 0.32 | −0.71 | −0.38 | −0.56 |
| QDB | −0.31 | 0.94 | 0.27 | 0.20 | 0.41 | −0.63 | −0.30 | −0.65 |
| CTB | −0.67 | 0.95 | 0.15 | 0.00 | 0.40 | −0.77 | −0.57 | −0.71 |
| IDR | −0.47 | 0.80 | −0.43 | −0.47 | −0.33 | −0.35 | 0.04 | −0.37 |
| TRB | −0.39 | 0.94 | −0.16 | −0.27 | 0.14 | −0.33 | −0.38 | −0.51 |
| QLB | −0.32 | 0.97 | 0.16 | −0.03 | 0.41 | −0.46 | −0.34 | −0.70 |
| YLR | −0.38 | 0.93 | −0.01 | −0.27 | 0.32 | −0.68 | −0.09 | −0.73 |
| YTR | −0.62 | 0.94 | 0.11 | −0.05 | 0.29 | −0.73 | −0.41 | −0.62 |
| MKR | −0.73 | 0.92 | 0.01 | −0.11 | 0.22 | −0.63 | −0.55 | −0.49 |
| SWR | −0.55 | 0.92 | −0.23 | −0.38 | 0.01 | −0.62 | −0.22 | −0.66 |
| BPR | −0.47 | 0.97 | 0.16 | 0.03 | 0.32 | −0.78 | −0.30 | −0.58 |
Gao et al (2014) indicates an abrupt and significant warming since 1998 in the TP. They divided the whole period of 1979–2011 into two periods before and after 1998 as the pivotal year. Aridity percentage changes after 1998 relative to 1979–1997 and percentage contributions from P changes and PET changes are estimated following Feng and Fu (2013), as shown in figure 3. 60 (23) stations show aridity increase (decrease) after 1998 compared to before. Consistent with the P/PET trend pattern (figure 1(a)), stations in the northwestern TP demonstrate larger increases rather than mixed changes at stations in the southern edge and eastern TP. P (PET) at 56 (27) and 31 (10) stations contribute to over 50% and 75% of the aridity changes (figure 3(b)). Averaged over the 83 stations, P and PET changes contribute to 61.1% and 38.9% of the aridity changes, respectively. Spatially, stations with P changes that contribute to P/PET changes are located throughout the TP, especially over the northwestern TP with larger aridity changes, although the number of stations is less in the west than the east. On contrary, stations with PET changes that contribute to P/PET changes are only located in the southeastern TP where aridity changes are insignificant. The analysis of aridity changes comparing the time periods after and before 1998 further demonstrates that P changes explain the spatial variability of aridity changes the most in the TP.

Figure 3. (a) Percentage aridity changes in 1998–2011 relative to 1979–1997 at the 83 stations and (b) stations with percentage contributions from P (blue) and PET (red) changes that are over 50% and 75% (units: %).
Download figure:
Standard image High-resolution image3.3. Seasonal variation in P/PET
Climate processes have distinct seasonal characteristics in the TP so elucidating the seasonal changes is important to understand the annual changes. Table 3 lists the monthly temporal correlations between P/PET and the observed climate variables in 1979–2011 averaged over the TP. Same as the annual correlations, P, SSD and DTR are significantly correlated with P/PET seasonally except for SSD in December. Seasonal differences apart from annual mean are noted in the PET. Same as the annual correlations, PET are negatively correlated with P/PET, but the monthly correlations from October to March are insignificant at the 99.9% confidence level. However, the correlations between PET and P/PET are significant at the 99.9% confidence level from April to August. Since the PET changes are highly correlated with temperature changes, this suggests that the warming in spring and summer significantly contributes to P/PET changes although the contribution is not significant annually. Cryosphere melting coincidently occurs in spring and summer in the TP. Accompanying the increase in the correlations of SSD/DTR with P/PET from April to August, PET changes begin to correlate with the P/PET changes when the incoming energy starts to melt the cryosphere in April. Hence, it is the long memory of the cryosphere that leads to negligible contributions of T to P/PET changes at annual scale and during the dry season. Warming has an impact on aridity changes in the TP when the cryosphere melts near the surface. From table 2, decreases in annual wind speed also contribute to P/PET increase in QDB and CTB. In table 3, we can see that wind changes only significantly contribute to P/PET changes in May. Tmax changes are significantly correlated with P/PET in April, August, September, and December. The Tmax changes and DTR changes might be related in how they contribute to the aridity changes.
Table 3. Monthly temporal correlation coefficients between P/PET and observed climate variables in 1979–2011 averaged over the TP. Correlations passed the two-paired Student's t-test significantly at the 99.9% confidence level are in bold. The degree of freedom is 33.
| PET | P | T | Tmax | Tmin | SSD | WIN | DTR | |
|---|---|---|---|---|---|---|---|---|
| January | −0.33 | 0.98 | −0.31 | −0.52 | −0.04 | −0.79 | −0.02 | −0.81 |
| February | −0.38 | 0.97 | −0.18 | −0.32 | 0.02 | −0.70 | −0.14 | −0.74 |
| March | −0.30 | 0.99 | −0.08 | −0.23 | 0.18 | −0.74 | −0.03 | −0.69 |
| April | −0.60 | 0.99 | −0.50 | −0.55 | −0.32 | −0.69 | 0.09 | −0.64 |
| May | −0.74 | 0.99 | 0.06 | −0.11 | 0.40 | −0.82 | −0.72 | −0.61 |
| June | −0.72 | 0.96 | −0.24 | −0.46 | 0.14 | −0.84 | −0.37 | −0.78 |
| July | −0.69 | 0.97 | −0.30 | −0.53 | 0.10 | −0.83 | −0.01 | −0.82 |
| August | −0.78 | 0.99 | −0.08 | −0.58 | 0.47 | −0.94 | −0.25 | −0.94 |
| September | −0.51 | 0.97 | −0.43 | −0.61 | −0.17 | −0.83 | 0.07 | −0.84 |
| October | −0.41 | 0.99 | 0.10 | −0.22 | 0.41 | −0.81 | −0.33 | −0.83 |
| November | −0.48 | 0.99 | 0.05 | −0.18 | 0.34 | −0.79 | −0.41 | −0.63 |
| December | −0.32 | 0.98 | −0.53 | −0.66 | −0.31 | −0.43 | 0.09 | −0.57 |
Monthly P/PET changes positively contribute the most to annual P/PET changes in the TP, except for December (table 4). On average, August ranks first in the contribution to annual P/PET changes in the TP with the highest correlations coming from P, PET, SSD and DTR in this month (table 3). On basin average, river basins located in the southeastern TP, including QLB, YLR, YTR, SWB, MKB and BPR, present the highest correlation in August following the TP average. Significant correlations also occur in July and October in the northeastern TP, such as QLB and YLR and in June in the northwestern TP, such as TRB and CTB. Accompanying table 3, contributors to P/PET changes in August in the southeastern TP, July and October in the northeastern TP, and June in the northwestern TP, are all dominated by the P changes. This is consistent with the spatial analysis of P/PET changes that it is the P changes that dominate the P/PET changes in the TP and in the sub-basins. SSD and DTR changes that lead to energy changes in the cryosphere are negligible in the Central TP (table 3).
Table 4. Temporal correlation coefficients between monthly P/PET and annual P/PET in 1979–2011 averaged over the TP and sub-regions. Correlations passed the two-paired Student's t-test significantly at the 99.9% confidence level are in bold. The degree of freedom is 33.
| January | February | March | April | May | June | July | August | September | October | November | December | |
|---|---|---|---|---|---|---|---|---|---|---|---|---|
| TP | 0.32 | 0.24 | 0.05 | 0.03 | 0.37 | 0.32 | 0.36 | 0.74 | 0.24 | 0.48 | 0.05 | −0.17 |
| QDB | 0.40 | 0.04 | 0.07 | 0.18 | 0.52 | 0.46 | 0.49 | 0.07 | 0.49 | 0.49 | 0.24 | 0.16 |
| CTB | 0.05 | 0.00 | 0.13 | 0.16 | 0.47 | 0.57 | 0.46 | 0.37 | 0.45 | 0.28 | −0.07 | −0.31 |
| IDR | 0.20 | 0.17 | 0.11 | 0.00 | 0.15 | 0.11 | 0.35 | 0.25 | 0.11 | 0.32 | 0.36 | 0.36 |
| TRB | 0.33 | 0.42 | 0.44 | 0.19 | 0.32 | 0.56 | 0.30 | 0.32 | 0.59 | 0.52 | −0.18 | 0.10 |
| QLB | 0.26 | 0.08 | 0.25 | 0.33 | 0.14 | 0.24 | 0.59 | 0.61 | 0.48 | 0.65 | 0.36 | −0.10 |
| YLR | 0.06 | 0.17 | 0.29 | 0.31 | 0.05 | 0.18 | 0.57 | 0.51 | 0.43 | 0.60 | 0.20 | 0.08 |
| YTR | 0.24 | 0.17 | −0.11 | 0.23 | 0.26 | 0.47 | 0.32 | 0.77 | 0.16 | 0.53 | 0.12 | 0.14 |
| MKR | 0.24 | 0.18 | 0.00 | 0.36 | 0.41 | 0.27 | 0.48 | 0.56 | 0.43 | 0.31 | 0.17 | −0.17 |
| SWR | 0.32 | 0.17 | 0.19 | 0.29 | 0.32 | 0.22 | 0.45 | 0.56 | 0.41 | 0.25 | −0.11 | −0.09 |
| BPR | 0.09 | −0.13 | −0.02 | 0.14 | 0.30 | 0.43 | 0.60 | 0.63 | 0.42 | 0.35 | 0.05 | −0.05 |
3.4. Scaling
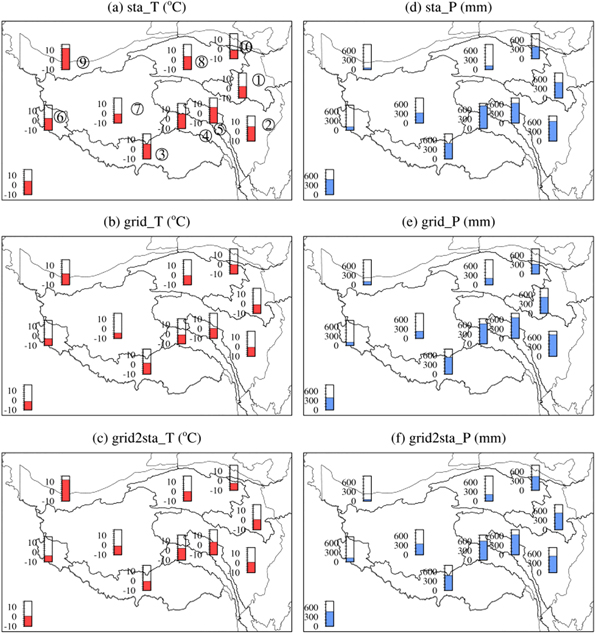
The analyses described above are all based on station observations. One might wonder how representative these stations are for the domain average given the uneven topography and surface cover underlying the TP. T and P are two fundamental variables to be evaluated. Using the gridded T and P released by the National Climate Center, CMA as the references, figure 4 shows the basin average from the station observations (sta), basin average from the gridded data sets (grid), and basin average from the nearest grids to stations (grid2sta) annual mean T and P climatology in 1979–2011. Station average T is highest in TRB and lowest in CTB and QLB (figure 4(a)). It ranges between 0 and 3 °C at stations in YLR and IDR and 3–6 °C in basins of the Central TP. It reaches 4.1 °C on TP average. The grid average exhibits similar pattern in T with the lowest in CTB (figure 4(b)). However, the grid average T is about 5 °C lower than the station average, especially in TRB. Average over the TP, it is −1.2 °C. The landscape in the TP is characterized by extremely varied topography with highland and complex of mountains. Due to the harsh environmental conditions, observation sites are sparely scattered over the part of the TP with relatively easy access. Therefore, the elevation of most stations is low relative to the domain average, which explains the warmer station recorded surface air temperature compared to the grid average shown in figures 4(a) and (b). To reduce the elevation effect, grids nearest to the station sites are averaged and compared to the station average (grid2sta, figure 4(c)). T at the nearest grid is still lower than the station average except for TRB, although it is higher than the domain average. It suggests that station observations could represent the pattern of the surface air temperature climatology but with larger magnitudes compared to the 0.5 degree average or basin average. The difference could be adjusted by the lapse rate correction (Gao et al 2015).
Figure 4. Climatology of the surface air temperature (T) and precipitation (P) in the 10 TP basins in 1979–2011 averaged over three spatial scales, (a), (d) in situ stations (sta), (b), (e) grids (grid) and (c), (f) stations interpolated from grids (grid2sta). The 10 basins are labeled as number 1–10 in (a) as follows: ①Yellow River (YLR), ②Yangtze River (YTR), ③Brahmaputra River (BPR), ④Salween River (SWR), ⑤Mekong River (MKR), ⑥India River (IDR), ⑦Chang Tang Plateau (CTB), ⑧Qaidam basin (QDB),⑨Tarim River basin (TRB), and ⑩Qilian Mountain (QLB).
Download figure:
Standard image High-resolution image
Strikingly, P scaling seems to be less problematic than T. The station average P exhibits a southward gradient with P decreasing from the southeastern TP to the northwestern TP with an average of around 500 mm in the TP (figure 4(d)). Grid average and grid2sta averages present similar patterns with the station averages (figures 4(e) and (f)), so their annual averages are quite close to the station average. The differences between different scales are not related to the station numbers in the basins. YTR has the most stations but the difference between station average and domain average is larger than TRB and IDR with only one station in each basin.
It is worthwhile to note that although systematic differences exist between the stations average and grid average, the linear trends in surface air temperature and precipitation are consistent between different scales in the TP and sub-basins. Specifically, the warming trends are the same at around 0.5 °C 10a−1 in the TP derived either from station average or grid average. It is 0.5 °C 10a−1 in most sub-basins but higher in IDR (0.7C 10a−1) and QDB (0.6C 10a−1) and lower in YLR, SWR, YTR and BPR at 0.4 °C 10a−1. Averaged over the TP, T exhibits a warming trend at a rate about 0.5 °C 10a−1. Just as expected, P possesses larger variability than temperature. Annual precipitation exhibits various positive trends in the TP and a majority of sub-basins. The trends vary from 1.7 mm (10a)−1 in SWR to 23.5 mm (10a)−1 in CTB. These result in 5.1 mm (10a)−1 average in the TP. Sub-basins located in the southeastern TP possess linear trends lower than the TP average. However, the linear trends in the sub-basins over the northeastern TP are above the TP average. Although the consistency in the variability of annual P between scales is lower than T, with the domain average P presenting the larger trends in the northwestern TP and smaller trends in the southeastern TP than the TP average, similar linear trend signals are found in the TP and the sub-basins.
4. Summary and conclusions
Desertification is one of the major environmental issues in the northern TP. Climate aridity is the predominant contributor to desertification. Aridity changes in the TP could be used to indicate the intensification or reversal of desertification. Here aridity changes expressed using the aridity index (P/PET) in the TP is studied using in situ observations with the following findings.
- (1)P/PET changes exhibit an increase in the stations of northwestern TP and mixed changes in the stations of southeastern TP. The P/PET change correlates positively and significantly with the spatial pattern of P and negatively and significantly with SSD, WIN, and TDR changes. Although all stations present significant increase in T, the pattern correlations between the P/PET changes and T changes are insignificant over the TP. Overall, precipitation changes dominate the aridity pattern changes in the TP, as indicated by the much higher pattern correlation with the P/PET changes and higher percentage contributions.
- (2)Temporally, annual P/PET is positively and significantly correlated with P. It is also negatively and significantly correlated with SSD and DTR. Although annual wind speed is not significantly correlated with annual P/PET, the correlation is significant in May. This suggests some contributions from wind changes to P/PET changes in the TP in spring. Seasonal changes implicate the role of cryosphere melting in aridity changes in the TP.
- (3)Surface air temperature and precipitation averages calculated from stations, gridded data, and nearest grid-to-stations exhibit the same climatology patterns and linear trends in the recent three decades average over the TP and in sub-basins, although differences in magnitudes could be found. Surface air temperature exhibits more consistency across scales in the linear trends than precipitation.
Aridity changes are useful indicators of climatic forcing that play a key role in desertification. Using P/PET as an indicator of aridity, the relative influence of different variables to aridity at different temporal and spatial scales can be identified and continuously monitored from station data. However, desertification is a terrestrial phenomenon influenced by a combination of multi-disciplinary factors. Besides climatology, future analyses should evaluate changes in hydrology such as irregular runoff, accelerated soil erosion by wind and water in morphodynamic, desiccation of soils and accumulation of salt in soil dynamics, and decline of vegetation in bioecosystem for a more holistic assessment of desertification in the TP.
Acknowledgments
This work is jointly funded by the Ministry of Science and Technology of the People's Republic of China (2013CB956004), National Natural Science Foundation of China (41322033) and '100-Talent' program granted by the Chinese Academy of Sciences to Yanhong Gao. LRL is supported by the US Department of Energy Office of Science Regional and Global Climate Modeling program. Pacific Northwest National Laboratory is operated for DOE by Battelle Memorial Institute under contract DE-AC05-76RL01830.