

Abstract
Human demand for animal products has risen markedly over the past 50 years with important environmental impacts. Dairy and cattle production have disproportionately contributed to greenhouse gas (GHG) emissions and land use, while crop demands of more intensive systems have increased fertilizer use and competition for available crop calories. At the same time, chicken and pig production has grown more rapidly than for ruminants, indicating a change in the environmental burden per animal calorie (EBC) with time. How EBCs have changed and to what extent resource use efficiency (RUE), the composition of animal production and the trade of feed have played a role in these changes have not been examined to date. We employ a calorie-based perspective, distinguishing animal calorie production between calories produced from feedcrop sources—directly competing with humans for available calories—and those from non-feed sources—plant biomass unavailable for direct human consumption. Combining this information with data on agricultural resource use, we calculate EBCs in terms of land, GHG emissions and nitrogen. We find that EBCs have changed substantially for land (−62%), GHGs (−46%) and nitrogen (+188%). Changes in RUE (e.g., selective breeding, increased grain-feeding) have been the primary contributor to these EBC trends, but shifts in the composition of livestock production were responsible for 12%–41% of the total EBC changes. In addition, the virtual trade of land for feed has more than tripled in the past 25 years with 77% of countries currently relying on virtual land imports to support domestic livestock production. Our findings indicate that important tradeoffs have occurred as a result of livestock intensification, with more efficient land use and emission rates exchanged for greater nitrogen use and increased competition between feed and food. This study provides an integrated evaluation of livestock's impact on food security and the environment.
Export citation and abstract BibTeX RIS
Introduction
Animal production is one of the most extensive and impactful means by which human activities affect the environment [1, 2]. Large amounts of land (3.86 × 10⁹ ha yr−1), water (2091 km3 H2O yr−1), fertilizers (101 Mtonne N yr−1) and greenhouse gas (GHG) emissions (2.45 Gtonne CO2eq yr−1) are needed to support feed production, grazing lands and animal maintenance (circa 2000; [3, 4]). Animal biomass demand (i.e. feed, grasses, and crop residues) has increased 108% over the past half-century while animal calorie production has more than tripled in response to rapid growth in demand for animal products [5]. Thus, intensification of livestock systems has been responsible for much of the growth in animal calorie production [2]. Though whether this intensification has in fact minimized the environmental burden of animal production appears to be a more complicated storyline. The transition of the livestock sector from ruminants towards monogastrics has meant improved efficiency per animal calorie produced, both in terms of land area and methane (CH4) emissions. At the same time, this shift has meant greater reliance on crops for feed and greatly increased the amount of nitrogen fertilizers and non-CH4 GHG emissions associated with livestock production. While the history of livestock's growing environmental costs as well as its future potential impacts have been well studied in recent years [1, 4, 6–9], the efficiency with which a given resource (e.g., land, CO2, nitrogen) can be converted into animal calories, how this has changed over the past 50 years, and to what extent environmental trade-offs have occurred have not been quantified to date.
Changes to the environmental burden of producing an animal calorie are influenced in two main ways. First, at the scale of the individual animal is its resource use efficiency (RUE), namely how much of a resource is required to produce a given amount of that animal. Through selective breeding and higher quality diets [10, 11], a species' ability to incorporate calories and nutrients can improve with time, so that less feed or fodder is required to produce the same amount of animal calories. Such changes are well documented in the animal science literature [1, 12]. Second, at the scale of all livestock production, changing the relative amounts of the various animal products that comprise all of livestock calorie production (e.g., eggs/milk versus meat; pigs/poultry versus ruminants) makes it possible to alter total resource use, even if the RUE of individual animal products remains constant. Recent studies [13, 14] have shown that it is possible to substitute resource-intensive animal products (e.g. beef) with lower impact ones and still meet human dietary demand and nutritional requirements. Yet, it is still unclear to what extent the environmental burden per animal calorie (EBC) has changed through time as well as what the relative contribution of RUE and livestock composition to these changes has been.
Thus, our purpose here is two-fold: (1) to quantify the changing environmental burden of global livestock production in terms of land, reactive nitrogen and GHG emissions over the past 50 years, and (2) to determine what fraction of these changes are attributable to shifts in RUE and livestock composition. We examine historical data for five main animal products—cattle meat, pig meat, poultry meat, eggs and milk—in 173 countries from the year 1961 to 2010. Combined with information on agricultural inputs and emissions, we calculate trends in the animal productivity of land (kcal ha−1), GHG (kcal kg CO2eq−1) and nitrogen (kcal kg N−1) and explore the possibility of environmental trade-offs as the livestock sector has transitioned to more intensive systems of production. We conclude our analysis by determining what percentage of the changes in animal productivity of land, GHG emissions and nitrogen fertilizer application is attributable to changes in RUE and what portion is attributable to changes in livestock composition.
Methods
Data sources
Country-level data on feed supply, animal production (i.e., poultry, beef, pig, eggs and milk), crop yields, pasture area, trade, and synthetic nitrogen fertilizer application came from FAOSTAT [15].
Country-level data on GHG emissions from agriculture also came from FAOSTAT [15]. These emissions included enteric fermentation (CH4), direct and indirect emissions from nitrogen fertilizers (N2O/CO2), energy use for feed production (CO2), rice cultivation for feed (CH4), manure left on pastures (N2O), manure applied to fields (N2O) and manure management and storage (N2O/CH4). GHG emissions for agricultural energy use were multiplied by the ratio of feed production to total crop production, while GHG emissions for rice cultivation were multiplied by the ratio of rice production used for feed to total rice production. Emissions from transport or land use change were not included.
Crop-specific application values of synthetic nitrogen fertilizers for the year 2010 came from a recent study by the International Fertilizer Industry Association (IFA) [16]. These values are reported for 26 countries, the EU-27 and the rest of the world (supplementary tables 2 and 3). Thus, any countries not among the EU-27 or the 26 other countries were all assigned the same crop-specific N application values, as the application of synthetic N in these countries is only 6% of the global total [16]. Annual country-specific estimates of the percentage of total synthetic N consumption used for grassland fertilization for 1961 through 2009 came from Lassaletta et al [17]. In addition, while manure applied to soils continues to be an important source of nitrogen for enhancing crop production (23% of total applied N in 2010 [15]), it was not included in our analysis because: (1) manure can be considered a recycling of reactive N from a nitrogen cascade perspective [18], and (2) information on crop-specific application rates was not available.
Due to a lack of comprehensive historical data, the water demand of livestock—though an important impact—was not included in our analyses.
Animal calorie production from feed and non-feed sources
Animal production was converted into calories using data from FAOSTAT's Food Balance Sheets and Commodity Balances [15]. This animal calorie production was partitioned between feed-fed and non-feed animal calorie production by country for the years 1961 through 2010 following the methodology of Davis and D'Odorico [5]. To define 'feed sources', we considered 40 main crops used for animal feed (see supplementary table 1); these crops were selected because: (1) each contributed at least 100 000 tonnes to global feed use in the year 2009, and (2) together they comprised at least 93% of global feed production for any given year. All other sources of plant biomass for animal diets were considered a 'non-feed source', consistent with the assumption used by Davis and D'Odorico [5]. Under this definition, fodder crops (e.g., alfalfa, clover, green maize), crop residues and permanent grasslands are considered as non-feed products—even though their production may compete with other uses of cultivatable land—because human and animal demands do not directly compete over the consumption of most of these crops. In addition, because some of these crops (e.g. alfalfa) can also be directly consumed by humans, our method of calculation means that, to a limited extent, we underestimate the feed calories available for animal consumption.
The fraction of animal calorie production derived from non-feed sources (i.e., non-feed fraction, NFF) for country x in year t was calculated as:

where ki is calories per tonne of crop i, ci is the tonnes of crop i used for feed, FCRj is the feed conversion ratio (FCR) for animal product j, kj is calories per tonne of animal product j and aj is the tonnes of production of animal product j. FCRs were derived from Herrero et al [4] for 28 geographic regions. Thus, in calculating NFF for country x, we used the FCR for the geographic region in which country x was included. FCR values—along with the countries corresponding to each geographic region—are reported in Davis and D'Odorico [5]. We should note that the calorie-based approach used here limits our findings somewhat, in that it is only possible to determine the fraction of total animal calorie production attributable to feed and non-feed sources but not for an individual animal product.
Animal productivity of land
The non-feed animal productivity of land (kcal ha−1) was estimated as the non-feed animal calorie production divided by the area of 'permanent meadows and pastures', the same definition from FAOSTAT used by Ramankutty et al [19] to map global pastures. Under this definition it is important to note that permanent meadows and pastures are actively used for grazing to varying degrees, thus our estimate of the non-feed animal productivity of land is likely conservative. The feed-fed animal productivity of land was estimated in a similar way—by taking the ratio of feed-fed animal calorie production to the cropland area required to grow feed sources. However, the calculation of feed-fed animal productivity of land also accounted for the trade of feed (and the difference in crop yields between the importing and exporting country). The effect of trade was accounted for by assuming that for country x the percentage of feed from imports was the same as the proportion, px, between its imports and domestic supply (i.e. production minus exports plus imports) (supplementary table 4). The total area required to grow the domestic supply of feed of country x, hx, was determined in two parts. First, the amount of land required for domestically produced feed, hx,dom was calculated as:

where tcg,x is the tonnes of domestic feed supply for a given crop group in country x and rcg,x is the yield of that crop group in country x (crop mass per unit area). Second, the amount of land virtually imported by country x, hx,imp, was found by:

where tcg,y,x is the tonnes of a given crop group exported from country y to country x and rcg,x is the yield of that crop group in country y. Thus

Several countries in the study did not report areas for permanent meadows and pastures (i.e., Egypt, Kiribati, Malta and Netherlands Antilles). In these cases, the feed-fed productivity was assumed to equal the overall productivity. In addition, because Davis and D'Odorico [5] assume global historical changes in FCR, this likely means that, to a certain extent, we overestimate changes in the feed-fed animal productivity of land for Africa and Asia and underestimate for Europe and the Americas (see supplementary table 4 for list of countries included in each region).
Assumptions in partitioning global resource use
To determine the global use of each environmental burden by feed-fed and non-feed animal calorie production, several assumptions were made. First, we assume that all emissions related to energy use arise from intensive systems and are attributable to feed sources [1]. These data on GHG emissions from energy were only available from the year 1970 onwards but initially only contributed ∼5% of total GHG emissions in the first years when the data were available. Second, substantial differences exist in enteric emission rates between animal production systems (especially as a result of feed quality; see [4, 11]). For simplicity, however, we assume that all enteric emissions originate from animal calories derived from non-feed sources, as the lowest quality ruminant diets (i.e., those with low concentrations of protein and calories and derived almost entirely from non-feed sources) have emission rates sometimes two orders of magnitude higher than higher quality diets [4]. To check the sensitivity of this assumption on how enteric emissions are attributed to feed and non-feed sources, we also performed our analysis assuming that enteric emission rates from animal calories derived from feed-fed and non-feed sources were the same and found that, while the calculated GHG emissions per animal calorie were somewhat different, this had no important effect on the temporal behavior of our findings (supplementary figure 1). Third, following Liu et al [20], we assume that any managed manures originated from intensive systems and all manure deposited on grasslands remained on those grasslands. Fourth, the fraction of synthetic N fertilizer consumed for feed production in a given year was assumed equal to the amount of feed production in that year divided by total crop production. To validate this assumption, we divided crop-specific fertilizer application amounts (reported by the IFA [16, 21]) by crop production to determine crop-specific rates of N fertilizer application for crop groups (supplementary table 3). Multiplying these rates by feed production, the amount of N used for feed production in 2006, 2007 and 2010 was calculated and in good agreement with our estimates. Nitrogen consumption to support animal calorie production from non-feed sources was estimated by multiplying country-specific estimates of the percentage of total synthetic N consumption used for grassland fertilization [17] with country-specific data on total N consumption [15]. Because the Lassaletta et al [17] dataset did not report a value for the year 2010, we calculated N application to grasslands for this year as a linear extrapolation of nitrogen consumption for non-feed animal production for 1961 through 2009.
Obtaining current global footprints of animal products
Crop-specific nitrogen efficiency for plant products (i.e. kg of applied N per kg of crop) was calculated as the amount of nitrogen applied in 2010 [16] divided by the amount of crop production. Production-weighted averages were used to combine the nitrogen efficiencies of individual crops into the larger commodity groupings. Because pulses were included with 'other crops' in the IFA data, the nitrogen efficiency value calculated for soybeans was used for pulses, as soybeans were the only N-fixing crop for which a value was reported. Using dry matter intake values and feed rations reported by Herrero et al [4] (supplementary table 5), the current global N efficiency of animal product j, ηj, was calculated as:

where DMIj is the dry matter intake per kilogram of animal product j, rcg,j is the feed ration of a given crop group for animal product j (reported as a percentage of total biomass intake) and ηcg is the N use efficiency of that crop group. Nitrogen applied to pasture land was split between beef and milk production (92% and 8%, respectively) following the methodology of Eshel et al [13]. The same methodology was used to determine current land use efficiency for specific animal products.
Global GHG emission rates (kg CO2eq kg animal−1) for each animal product were calculated based on data reported in two FAO life-cycle assessment (LCA) studies of major animal production systems [10, 11]. These calculations are detailed in supplementary table 6. Because the LCA studies (1 CH4 = 25 CO2eq; 1 N2O = 298 CO2eq) and FAOSTAT (1 CH4 = 21 CO2eq; 1 N2O = 310 CO2eq) employed different global warming potentials (GWPs), emission rates from the LCA studies were corrected using the ratio of the FAOSTAT GWP to the LCA GWP. All RUE values are summarized in supplementary table 7.
Attribution of change to RUE and livestock composition
We considered two modes of change in the EBC: RUE and livestock composition. The overall historical EBC, EBChist, was calculated as the magnitude of the environmental impacts (resource used for animal production, or emissions of GHGs and pollutants) divided by the total animal calorie production. To determine the contribution of changing livestock composition in year t to EBChist,t, we calculated what the EBC would be holding RUE constant at year 2010 values as follows:

where ηj,2010 is the RUE value for animal product j in the year 2010, and pj,t is the amount of that animal good produced in year t. We then calculated the changes in EBChist and EBCconstRUE relative to 1961 values as:

and
where equation (7) keeps all components as dynamic and equation (8) keeps RUE constant but allows all other variables (i.e., livestock composition and animal calorie production) to change with time. With these two scenarios calculated, the relative contribution to EBC when holding livestock composition constant, rEBCconstLS, in year t was then calculated simply as the difference of rEBChist,t minus rEBCconstRUE,t. In this way, we were able to determine the contribution of changing livestock composition and changes in RUE to the overall per calorie environmental burden of livestock. As a point of note, we found that EBChist,2010 ≠ EBCconstRUE,2010. This discrepancy is because the amounts of feed reported by FAOSTAT and the Herrero et al [4] study were different. However, even when correcting for this discrepancy, we found that it had no important effect (Land: ±1.7%; GHG: ±0.0%; N: ±6.4%) on the relative contribution of RUE and livestock composition to overall change in EBC. As a final note, the relative contribution of RUE and livestock composition to overall change in EBC likely varies between regions. However, we were unable to assess this aspect of the present study, as detailed trade data do not exist for the beginning of the study period.
Results
The overall productivity of land for animal calories has increased by 165%, from 87 000 to 231 000 animal kcal per hectare (ha) over the study period (figure 1(a)). During this time, the productivity from feed sources was 2.1–3.7 times greater than from non-feed sources, with Europe having a particularly high feed-fed productivity. On the other hand, Europe is also the only region with no clear positive trend in overall productivity—largely a result of its decreasing production of animal calories using non-feed sources (see [5]). Africa and Oceania have maintained relatively low productivities while Asia has markedly increased the efficiency with which it utilizes land resources to produce animal calories. In addition, we find that those countries with high levels of animal production (e.g., USA, China, Brazil, India) are not necessarily the most efficient users of land for livestock (figure 2).

Figure 1. Trends in animal productivity of land. Regional changes in the animal productivity of land (kcal ha−1) for (a) total animal calorie production and production derived from (b) non-feed and (c) feed sources. Regional data for 'overall' and 'feed-fed' productivities begin in 1986 because this was the first year for which detailed trade information was available. The reader should also note that the y-axis scale for panel (c) is different from that of panels (a) and (b).
Download figure:
Standard image High-resolution imageThe trade of feed has also played an important role in these changing productivities. From 1986 to 2010, the virtual trade of land for feed more than tripled from 110 Mha to 337 Mha and is currently equivalent to 7.6% of the total land required for livestock production (figure 3). While the Americas have been consistent exporters of feed during these 25 years, the majority of inter-regional imports has gradually transitioned from Europe to Asia. We also find that Asia has not been able to achieve self-sufficiency of its animal calorie production (i.e. domestic supply exceeding domestic demand) despite its increased involvement in acquiring feed imports (supplementary figure 2). Looking at the country scale, five nations—Argentina, Brazil, India, Ukraine and the US—exported 238 million ha yr−1 (71% of all virtual land traded internationally for feed), while China alone accounted for 19% of virtual land imports for feed (supplementary table 8). In total, 133 out of 173 countries were net importers of virtual land for feed (figure 3(b)).
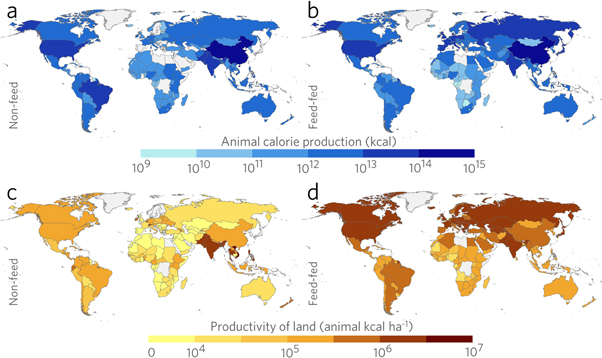
Figure 2. Animal production and productivity of land. (a), (b) Animal calorie production from feed and non-feed sources (year 2000–2009 average). Only feed-fed and non-feed calorie production values above 109 kcal are shown. Non-feed production values are only shown for countries with a pasture area greater than 0.5 × 10⁶ ha. Countries with gray cross-hatching either fell below these thresholds or had no data. (c), (d) Animal productivity of land for feed and non-feed sources (year 2000–2009 average). Values for these maps are presented in supplementary table 10.
Download figure:
Standard image High-resolution imageThis study also examined the trade-offs between some of the main environmental impacts of livestock and how they differ between animal calorie production from feed and non-feed sources. Specifically, we found that animal calories produced from feed sources were more efficient than non-feed sources in terms of land use and GHG emissions, using on average 65% less land and emitting 59% less GHGs per animal calorie, respectively (figures 4(a) and (b)). Conversely, the production of animal calories from non-feed sources was substantially more efficient in terms of fertilizer use—an average of 80% less nitrogen per animal calorie over the time period (figure 4(c)). These results indicate that as animal production has increasingly relied on feed sources, the amount of land and GHG emissions associated with the production of an animal calorie has decreased, while the opposite has occurred for required fertilizer.
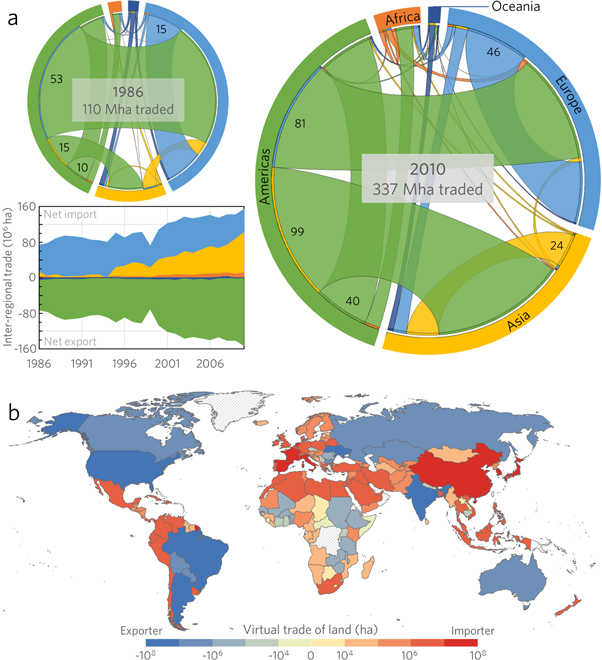
Figure 3. Trends and patterns in virtual land trade. (a) Inter-regional flows of virtual land via feed trade. The color of each band corresponds to the exporting region, while the numbers within major bands represent the magnitude of the virtual flow of land (in Mha) along that link. Circle areas are scaled to the total virtual land traded in 1986 and 2010. Inset plot shows the steady transition of virtual land's destination, from almost entirely Europe in 1986 to roughly equal parts Europe and Asia in 2010. (b) Net virtual trade of land for feed by country (year 2000–2009 average). Values are reported in supplementary table 10.
Download figure:
Standard image High-resolution image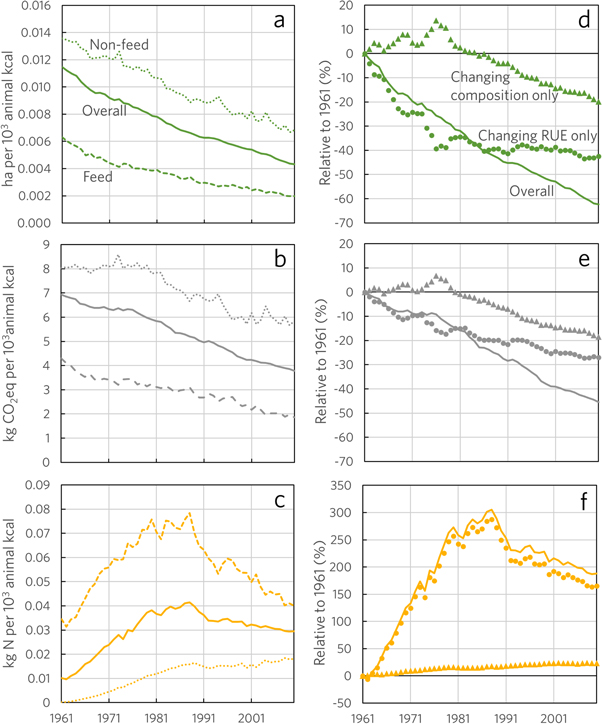
Figure 4. Changing EBC for land, carbon and nitrogen. (a)–(c) Changes in EBCs for feed-fed systems, non-feed systems and total animal calorie production. (d)–(f) Relative change in EBC as contributed by changing RUE of individual animal products and changing composition of livestock production (i.e., greater contribution of monogastrics relative to ruminants). For the 'Changing composition only' scenario, resource use efficiency of each animal product was held constant at year 2010 levels to determine the contribution of changing livestock composition. This relative change was subtracted from the overall relative change in EBC to determine the importance of RUE changes (i.e., 'changing RUE only') in altering EBC.
Download figure:
Standard image High-resolution image
Together, changes in RUE and in the composition of livestock production contributed to change the EBC for GHGs, land and nitrogen by −46%, −62% and +188%, respectively (figures 4(d)–(f)). We found that shifts in the composition of livestock production were responsible for 41% (GHGs), 32% (land) and 12% (N) of these total changes in EBC. Thus the majority of the change in EBC for all three environmental impacts was attributable to RUE.
Discussion
Changing environmental burdens
Livestock production has increased rapidly to meet the demands of population growth and dietary changes [1, 5, 7]. To support this development, resource use, GHG emissions and pollution from synthetic fertilizers have also expanded—by our estimation, 20% for land, 74% for GHG and 820% for N (supplementary table 9)—despite apparent gains in certain EBCs. How these environmental impacts have changed relative to animal production is the result of multiple underlying factors (e.g., feed trade, RUE, livestock composition). This study clearly demonstrates that RUE has played a major role in altering the environmental burden of animal production. Selective breeding, higher quality diets, improved access to vaccinations and reduced exposure to extreme climate (i.e., climate-controlled industrial systems) have combined to enable these substantial improvements [7]. In just the past 30 years, advances in animal science have doubled the grain feed conversion efficiencies of chickens and pigs [1, 2, 12]. Because RUE is in large part dictated by technology, animal physiology and access to feed, affluent regions have been able to produce animals more efficiently [4]. Indeed, this is apparent for animal calories from feed sources where the land productivities of many developed countries were markedly higher than much of the developing world (figure 1). These high productivities in many industrialized countries also highlight a 'livestock yield gap' for many developing countries where there is a large potential to increase livestock yields in the coming decades.
While RUE of animals has been a more important contributor to changing livestock's environmental burden, our analysis shows that the changing composition of livestock production has played a significant role as well. Though changes in livestock composition were modest in influencing nitrogen use intensity, this factor contributed considerably to minimizing the per calorie impact in terms of GHG emissions and land requirements. For both of these environmental metrics, much of this contribution can be explained by declining relative contribution of cattle (supplementary figure 3), whose methane emissions substantially influence the overall GHG emissions from the livestock sector and whose land requirements still currently equal 74% of all area used for animal production. This is not surprising, as the transition towards intensive systems goes hand-in-hand with the shifts in composition from beef to chickens and pigs [22]. Industrialization is responsible for much of this transition, having steadily lowered the prices of monogastric products and, in turn, shifted consumption patterns significantly [12]. Yet, while these shifts have led to certain improvements in EBCs, this switch towards monogastrics has also raised concerns related to disease risks and animal welfare [22].
Environmental trade-offs and impact displacement
The intensification of livestock production has led to important trade-offs in EBCs, with lower land and GHG footprints due to the predominance of monogastrics and increased per calorie demand for nitrogen (and irrigation water [1, 2]) to support rising feed requirements. While the impact of GHG emissions is by and large global, other environmental consequences are more limited to the location where the animal or feed production occurs. A globalizing livestock sector has meant a separation of feed's production and consumption and, combined with increasing global affluence, may have enhanced the displacement of land use and land use change into producer countries [23, 24]. This shifting of impacts is apparent in our quantification of the virtual trade of resources where the countries producing the feed are the ones assuming many of the environmental costs (e.g. [25]) (figure 3(b); supplementary figure 4). In addition to virtually exporting environmental costs through the purchase of feed, importing countries can also conserve their locally available resources for other uses, potentially attain levels of livestock production above the local livestock carrying capacity and minimize the influence of local climatic variability and extremes. Though the trade of feed does not appear to impact domestic calorie provision in the main exporting countries [26], the increased use of feed still does not guarantee the self-sufficiency of animal calorie production (i.e., domestic production of animal calories exceeding domestic demand) for the importing country. This is especially apparent in Asia where—despite rapid increases in both productivity (figure 1) and feedcrop imports (figure 3(a))—large imports of animal goods are still required to meet regional demand (supplementary figure 2; [15]). For places importing animal products, embedded nutrients in those products can also have environmental impacts [17], highlighting the fact that the virtual trade of resources associated with livestock production occurs at two levels: the trade of feed and (to a lesser extent) of the animal production itself [25, 27].
Food security implications
Changes in the livestock sector have also had important implications for global food security and crop availability. While increased grain-feeding has contributed significantly to improving livestock yields, this intensification has required the use of lands of high agricultural value instead of using areas not suitable for crop production (e.g. rangelands). Recent work quantifying the competition for crop use as a result of this intensification found that 4.9 billion people could be fed by the crop calories currently used for animal feed and that eliminating beef from the diet would result in a crop calorie savings of 2.13 × 10¹⁵ kcal [5]. Another recent study demonstrated how global diets link improved human health to environmental sustainability [14]. The authors showed that diets which reduce incidences of cancer, heart disease and diabetes are also the ones composed of foods which are less resource-intensive to produce, translating into significant land sparing and GHG reductions. Thus, a combination of modifying diets while encouraging healthy choices appears to be a promising way to minimize the sector's environmental burden while meeting increasing human demand.
Counter to these recommendations, increasing global affluence is expected to make future diets more meat-demanding [12, 14, 28] while cultural and economic factors leave consumption patterns entrenched. Thus while efforts should be made to reduce a consumer's dietary footprint, utilizing a suite of options is the most realistic for minimizing livestock's impact. As one alternative to modifying diets, Havlík et al [8] showed that closing crop yield gaps can at the same time help to improve livestock efficiency due to higher feed quality. However, this approach used in isolation would likely lead to an increase in the overall resource demands of the livestock sector, as the rates of historical improvement in EBC have yet to realize a decrease in absolute resource use and emissions. Another important avenue for reducing livestock's footprint is through the reduction of waste along the food supply chain [29]. As West et al [30] showed, the waste of animal products can have a much larger impact on available calories because of the inefficient conversion of feed to animal calories. The point along the food supply chain in which waste of animal products occurs differs greatly between regions. For example, in sub-Saharan Africa, approximately 26% of initial meat production is wasted before even reaching the consumer, a consequence of high animal mortality and insufficient storage and transport infrastructure. Conversely, more than half of the waste of meat and dairy products in Europe and North America occurs at the level of the consumer (e.g. retailers, households). Finally, much of the environmental burden of livestock production is due to its heavy reliance on feed and the resources required to produce those crops. Making advanced technologies (e.g., fertilizer banding) more readily available and affordable could thus contribute substantially to avoiding the inefficient application of fertilizers for feed production that continue to occur. Indeed, the gradual but consistent decrease in the EBC of nitrogen is encouraging in this regard and suggests that wasteful application of synthetic fertilizers has been reigned in to a certain extent (figure 4(e)).
Conclusion
The current structure of the global livestock system—a system which has placed greater reliance on feed—appears to be largely unsustainable. Continued growth in human demand is expected to outpace improvements in EBC and, in turn, lead to greater resource demands and environmental impacts of the livestock sector. In addition, that a large number of countries import feed for animal production raises concerns about their long-term food self-sufficiency [31], especially considering that producer countries may be less willing to export crops in the coming decades as a result of demographic growth and climate change [32]. Current knowledge points towards a global food system that has become increasingly homogenized and more susceptible to shocks as a result [33]. Exemplifying this vulnerability for the livestock sector, globalization and the transition to intensive systems have been accompanied by the increasing risk of infectious diseases and antibiotic resistance [22]. It is critical that countries seek to adapt domestic animal production to minimize reliance on trade and improve resilience by maintaining a balance of species. A variety of production systems, plant biomass sources and consumption patterns all offer benefits toward achieving sustainable intensification. This mirrors recent thinking that both addressing supply- and demand-side trends simultaneously [9, 34] as well as better integrating the nutrient and energy cycles of crop and animal production [35, 36] are the most promising pathways to securing livelihoods, food and environmental stewardship. As this study shows, countries can integrate environmental and food security considerations in order to better understand how improvements in one aspect of livestock production and consumption may result in adverse consequences in another. In doing so, each country can ultimately tailor a suite of approaches most appropriate for its unique socio-ecological landscape, aimed at minimizing livestock's environmental burden while maximizing food security.
Acknowledgments
Funding for this study was provided by the NSF Graduate Research Fellowship Program (Grant # DGE-00809128). Circular figures (in figure 3(a)) were made using visualization software from Circos (http://mkweb.bcgsc.ca/tableviewer/visualize/).