

Abstract
The global number of dam constructions has increased dramatically over the past six decades and is forecast to continue to rise, particularly in less industrialized regions. Identifying development pathways that can deliver the benefits of new infrastructure while also maintaining healthy and productive river systems is a great challenge that requires understanding the multifaceted impacts of dams at a range of scales. New approaches and advanced methodologies are needed to improve predictions of how future dam construction will affect biodiversity, ecosystem functioning, and fluvial geomorphology worldwide, helping to frame a global strategy to achieve sustainable dam development. Here, we respond to this need by applying a graph-based river routing model to simultaneously assess flow regulation and fragmentation by dams at multiple scales using data at high spatial resolution. We calculated the cumulative impact of a set of 6374 large existing dams and 3377 planned or proposed dams on river connectivity and river flow at basin and subbasin scales by fusing two novel indicators to create a holistic dam impact matrix for the period 1930–2030. Static network descriptors such as basin area or channel length are of limited use in hierarchically nested and dynamic river systems, so we developed the river fragmentation index and the river regulation index, which are based on river volume. These indicators are less sensitive to the effects of network configuration, offering increased comparability among studies with disparate hydrographies as well as across scales. Our results indicate that, on a global basis, 48% of river volume is moderately to severely impacted by either flow regulation, fragmentation, or both. Assuming completion of all dams planned and under construction in our future scenario, this number would nearly double to 93%, largely due to major dam construction in the Amazon Basin. We provide evidence for the importance of considering small to medium sized dams and for the need to include waterfalls to establish a baseline of natural fragmentation. Our versatile framework can serve as a component of river fragmentation and connectivity assessments; as a standardized, easily replicable monitoring framework at global and basin scales; and as part of regional dam planning and management strategies.
Export citation and abstract BibTeX RIS

Content from this work may be used under the terms of the Creative Commons Attribution 3.0 licence. Any further distribution of this work must maintain attribution to the author(s) and the title of the work, journal citation and DOI.
Corrections were made to this article on 8 January 2014. The e-mail address of the corresponding author was corrected.
1. Introduction
Dams provide an important source of energy, water for irrigation, protection against floods, and help increase water security, but also have substantial impacts on the ecological integrity of aquatic systems and on the productivity of river systems that provide important resources for rural communities and regional economies (Tockner and Stanford 2002, Arthington et al 2010, Poff and Zimmerman 2010, Richter et al 2010). Two of the largest consequences of dam construction are river fragmentation and flow regulation, often considered separately in impact assessments despite their known interactions; or they are merged into aggregated impact categories (e.g., Dynesius and Nilsson 1994, Nilsson et al 2005). Here, we quantify the degree of river regulation and fragmentation as individual indicators, and we present the results in a matrix framework that allows simultaneous examination of both impacts. Our results can serve as a foundation for future assessments of subsequent environmental impacts resulting from these hydrological alterations, including effects on biodiversity, ecosystem functioning, and fluvial geomorphology.
River fragmentation diminishes the natural connectivity within and among river systems (Tischendorf and Fahrig 2000, Moilanen and Hanski 2001). We define connectivity from an ecological viewpoint with a focus on hydrology as 'water-mediated transfer of matter, energy or organisms within or between elements of the hydrologic cycle' (Pringle 2003). Following Ward (1989), connectivity has a longitudinal aspect that connects upstream and downstream ecosystems (Vannote et al 1980), a lateral dimension by linking riverine systems with wetlands and floodplains (Tockner et al 1999), and a vertical component that connects surface water with groundwater flows (Stanford and Ward 1993). Longitudinal connectivity is particularly important for river ecology because of its relation to species migration and dispersal (Fukushima et al 2007, Cote et al 2009, Ziv et al 2012) as well as its role in community structure and biodiversity patterns in river channels (Altermatt 2013) and riparian zones (Jansson et al 2000). Longitudinal and lateral connectivity also function as transport pathways for organic and inorganic matter downstream, into riparian zones and floodplains (Vörösmarty et al 2003, Syvitski et al 2009, Nilsson et al 2010). Our analysis focusses on longitudinal connectivity and is based on the assumption of a direct and reciprocal relationship between fragmentation and connectivity.
Dam operation, particularly water storage, is the main contributor to flow regulation, often with the goal to eliminate peak flows, to stabilize low flows, or to impound or divert river flows. These alterations can disrupt ecological functioning (Ward and Stanford 1995, Pringle et al 2000, Carlisle et al 2011), e.g., by reducing sediment delivery to floodplains and deltas (Syvitski et al 2009), altering thermal regimes (Poole and Berman 2001), or by disrupting life cycles of freshwater species (Poff et al 1997). In turn, this may cause the loss of endemic species or the invasion of exotics (Bunn and Arthington 2002), thereby reducing overall biodiversity (Poff et al 2007, Reidy Liermann et al 2012).
Permanent dam disruption of river systems can have effects from species to ecosystem levels and from local to global scales (Rosenberg et al 1997). Most major global river basins are already impacted by large dams (Nilsson et al 2005). In the future, dam development is expected to continue, with more than 3700 large hydropower dams alone currently planned or under construction worldwide (Zarfl et al 2014). As more than one-sixth of the world's population live in glacier- or snowmelt-fed river basins (Kundzewicz et al 2007), dams are increasingly discussed as an option to buffer against climate-induced fluctuations in water availability (Palmer et al 2008). However, rapid proliferation of new dams may pose serious impacts on rivers, including those that support high levels of biodiversity or provide important sources of food from fisheries or flood-recession agriculture. Thus, it is of paramount importance to minimize the social and environmental impacts of new dams.
Recently, advanced strategies to improve the development, distribution and operation of dams by 'optimizing' their geospatial location have emerged. These new approaches take into account network structure (Bunn et al 2000, Erős et al 2011) and utilize newly developed hydrographical data (Lehner and Grill 2013). In this paper, we expand on these proposals and integrate recent methodological approaches to holistically describe the current and future state of dam impacts globally. We address three principal challenges when assessing dam impacts at large scales, which are related to spatial scale, cumulative effects, and impact indicators.
Connectivity has been shown to be scale dependent (Kunin 1998, Tischendorf and Fahrig 2000, Fagan et al 2005), for example, due to different dispersal abilities of species (Wiens 2002). However, the majority of dam impact studies consider the river basin scale as the fundamental unit of study and may overlook effects at smaller spatial scales (Nilsson et al 2005, Anderson et al 2008, Lassalle et al 2009). Since dispersal ability is highly variable or often unknown, multiple scales should be examined (Calabrese and Fagan 2004). River networks have a strong hierarchical nesting structure (Fullerton et al 2010), so advanced dam assessment frameworks should be capable of accommodating nested spatial scales within larger basins. As a step towards addressing this issue, Reidy Liermann et al (2012) measured the length of the longest undammed stretch of the five largest rivers in each 'freshwater ecoregion' (as defined by Abell et al 2008) to derive the percentage of free-flowing rivers.
Dams can have cumulative effects many hundred kilometers downstream and upstream of the barrier. Approaches that also take into account adjacent dams within the river system are therefore necessary but rarely performed (Fagan et al 2005, ICPDR 2009, Finer and Jenkins 2012). An emerging method to assess cumulative effects in rivers is provided by graph-theoretic approaches that assess river systems as a network of links and nodes (representing river reaches and confluences, respectively). Network theory, a branch of graph theory focusing on the asymmetrical relations between network objects, can be used to study river networks (Bunn et al 2000) and to address multiple habitats and hydrological barriers. For example, Schick and Lindley (2007) used graph theory to examine changing patterns in connectivity and the isolation of salmon populations due to dam construction in California's Central Valley. Although such approaches are commonly used in landscape ecology to quantify connectivity, their application has been limited to smaller river systems as computational requirements increase exponentially with the number of network reaches. New concepts such as the dendritic connectivity index (DCI, Cote et al 2009) and the river connectivity index (RCI, Grill et al 2014) are graph-based models that avoid intense computations through simplified connectivity indices.
The third challenge for dam impact assessments on large scales is that a river constitutes a continuum of habitat types with distinct ecohydrological properties from headwater to lowland rivers (Vannote et al 1980, Thorp and Delong 1994, Thorp et al 2006). Anthropogenic perturbations generally have different impacts depending on the position along a longitudinal gradient (Ward and Stanford 1983), yet it is difficult to make a definitive statement on where along the gradient perturbations have the most impact. In the absence of such information, current assessments often treat river reaches as equally important, irrespective of their stream order or habitat suitability. For example, the DCI (Cote et al 2009) measures the proportion of the length of the disconnected network fragments in relation to the entire network, independent of river size. Hence, the same fragmentation value may be obtained if a barrier is placed very high upstream in the network or very low, as long as the disconnected network fragments have the same length. Spatially indiscriminate metrics such as river length or river basin area may therefore be incomplete proxies for habitat in river ecology studies. To address this issue, we here propose using 'river volume' (i.e. reach length x width x depth at average flow conditions) as the basis for impact calculations in aquatic systems. In freshwater ecology, 'habitat area' and 'habitat volume' are used to consider river channel width and depth as important determinants of species composition (Schlosser 1982). Habitat volume predict species richness better than habitat area (Angermeier and Schlosser 1989, Magalhaes et al 2002) and certain fish species are particularly sensitive to variations of habitat volume as a result of reduced dam releases that diminished habitat availability (Shea and Peterson 2007).
In the following, we present a novel framework to address these challenges and to evaluate dam impact metrics by emphasizing network structure, spatial scale, and incorporation of newly available hydrographical and hydrological information in a holistic connectivity assessment (sensu Fullerton et al 2010). Our framework combines global high resolution hydrographic data (Lehner et al 2008) with a graph-based river routing model (HydroROUT, Lehner and Grill 2013, Grill et al 2014). Our approach is multi-impact, multi-scale, and indicator-based—intended to compliment, not replace, more traditional local scale impact assessments. Using this framework, we address three questions: (a) what are the historical trends and current spatial patterns of dam impacts on river systems resulting from flow regulation and fragmentation?; (b) what differences are observed in flow regulation and fragmentation moving from subbasin to global scales?; and (c) how will future hydropower dam building impact flow regulation and river fragmentation worldwide?
2. Methods
We develop and calculate two new indicators to assess fragmentation and flow regulation at both the basin and subbasin scale based on river volume. We then create a combined matrix of impact scores from our quantitative indicators and apply it to all river basins and subbasins globally. We first examine historic trends in dam impacts on river connectivity and flow regulation and then project future impacts due to planned or proposed dams (additional details are provided in the supplemental information (SI), available at stacks.iop.org/ERL/10/015001/mmedia).
2.1. Data and models
2.1.1. River routing model (HydroROUT)
HydroROUT is a river routing model used to conduct tracing, routing and statistical operations in river networks (Lehner and Grill 2013, Grill et al 2014) based on a graph-theoretical approach (Bunn et al 2000). HydroROUT is built on the vector river network of the HydroSHEDS database at 15 arc second resolution (Lehner et al 2008). In total, 17.8 million river reaches with an average length of 2.7 km are modeled in HydroROUT, representing a cumulative river length of 48.3 million km. This network includes all global streams and rivers with more than 0.1 m3 s−1 flow (long-term average discharge) or with an upstream area of more than 10 km2. Discharge values from the global hydrological model WaterGAP (Alcamo et al 2003, Döll et al 2003) were downscaled to HydroROUT's river network using spatial interpolation methods. Estimates of river volume were derived from mean annual discharge (reflecting the average amount of water available to fish and fauna). According to these simulations, the global river network contains a total of 566.6 km3 of river water.
2.1.2. Dam and reservoir database
We considered 6374 current dams from the GRanD database (Lehner et al 2011) and 3377 future hydropower dams compiled by Zarfl et al (2014) in our analysis (figure 1). In the dataset of future dams, 17% are attributed as 'under construction' and the rest are 'planned'. These data do not include dams at a pre-feasibility stage and dams below 1 MW capacity were excluded since information on these is sporadic and often lacks detail due to less onerous licensing requirements (Zarfl et al 2014). Reservoir storage volumes are available for current dams from the GRanD database, and we added estimates for the future hydropower dams based on a linear regression model.
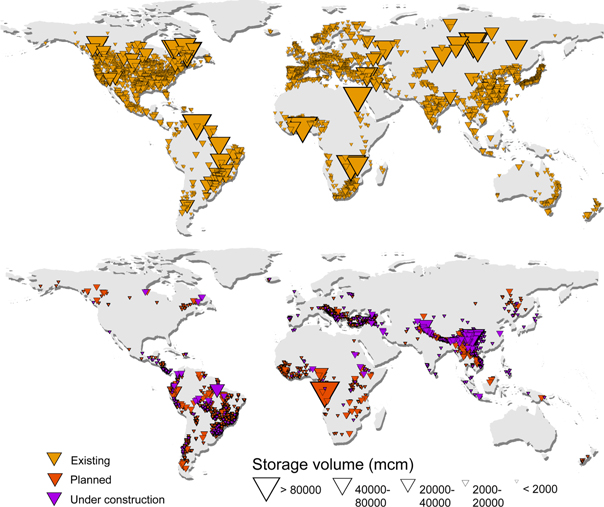
Figure 1. Overview of existing dams (GRanD, Lehner et al 2011) and planned and under construction future dams (Zarfl et al 2014) by storage volume class (volumes in million cubic meters from Lehner et al 2011 and own estimates).
Download figure:
Standard image High-resolution imageIn the absence of better information, we defined a two-step 'future scenario' which assumes that all 'under construction' dams are built by 2020, and that all 'planned' dams are completed by 2030. More information on this scenario and its plausibility is provided in the discussion section and in the SI (S1.2). For simplicity, the expression 'future scenario' will refer to the 2030 horizon from here on, unless stated otherwise.
2.1.3. Uniform spatial units
In addition to river basins, we used a set of subbasin units termed HydroBASINS (Lehner and Grill 2013) to assess the sensitivity of our index calculations to spatial scale. HydroBASINS is a delineation of global watersheds and was developed to provide nested subdivisions of large river basins to conduct disaggregated spatial analyses in river systems.
2.2. River fragmentation index (RFI)
The RFI (see definition in SI) is a measure of river fragmentation by barriers on structural connectivity per basin or subbasin and is conceptually equivalent to the River Connectivity Index as defined in Grill et al (2014). The RFI is based on the DCI by Cote et al (2009) but substitutes river volume for river length. The RFI of an unfragmented river network is 0%, with each subsequent dam increasing the value to a maximum of 100%. A single dam in a previously undisturbed network leads to greatest fragmentation if it splits the network into two equal volume fragments, in which case the RFI increases to 50%.
2.3. River regulation index (RRI)
The RRI ( Grill et al 2014) is an extension of the degree of regulation (DOR) as calculated globally in Lehner et al (2011) and provides a quantitative proxy of how strongly a river may be affected by alterations to its natural flow regime due to upstream dam operations. The DOR is the proportion of a river's annual flow volume that can be withheld by a reservoir or a cluster of reservoirs upstream of the reach and is calculated for each reach of the network. The DOR has in one form or another been a key component of seminal studies on flow regulation (e.g., Nilsson et al 2005) or has been analyzed in terms of the hydrologically equivalent 'change in residence time' or 'water aging' (e.g., Vörösmarty et al 1997). A high DOR indicates an increased probability that substantial discharge volumes can be stored upstream in a given year for future release. We calculate RRI (%) by first weighting the DOR value of each individual reach with its corresponding river volume, and then averaging the results for the entire basin to quantify full-basin impacts in a single index.
2.4. Dam impact matrix (DIM)
Building upon previous concepts by Dynesius and Nilsson (1994), we assessed fragmentation and regulation effects simultaneously by creating an impact matrix. We first classify each index into four categories based on quartile ranges of occurrence (weak: 0–25th; moderate: 25–50th; heavy: 50–75th; and severe: 75–100th percentiles) and then combine the categories from each index to create an integrated four by four matrix. This matrix, based on relative rankings (from low to high), allows comparison across basins worldwide in order to illustrate the large spectrum of possible combinations while identifying four primary groups of impacts at each corner of the matrix (see figure 2). It is not a goal of this study to interpret or compare absolute impact scores or to define ecological thresholds; as such, the assigned class names only represent a statistical ranking and should not be judged as expressing the level of ecological impact (e.g., even the 'weak' impact class may include river basins that experience substantial ecological perturbations).
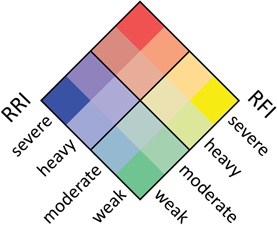
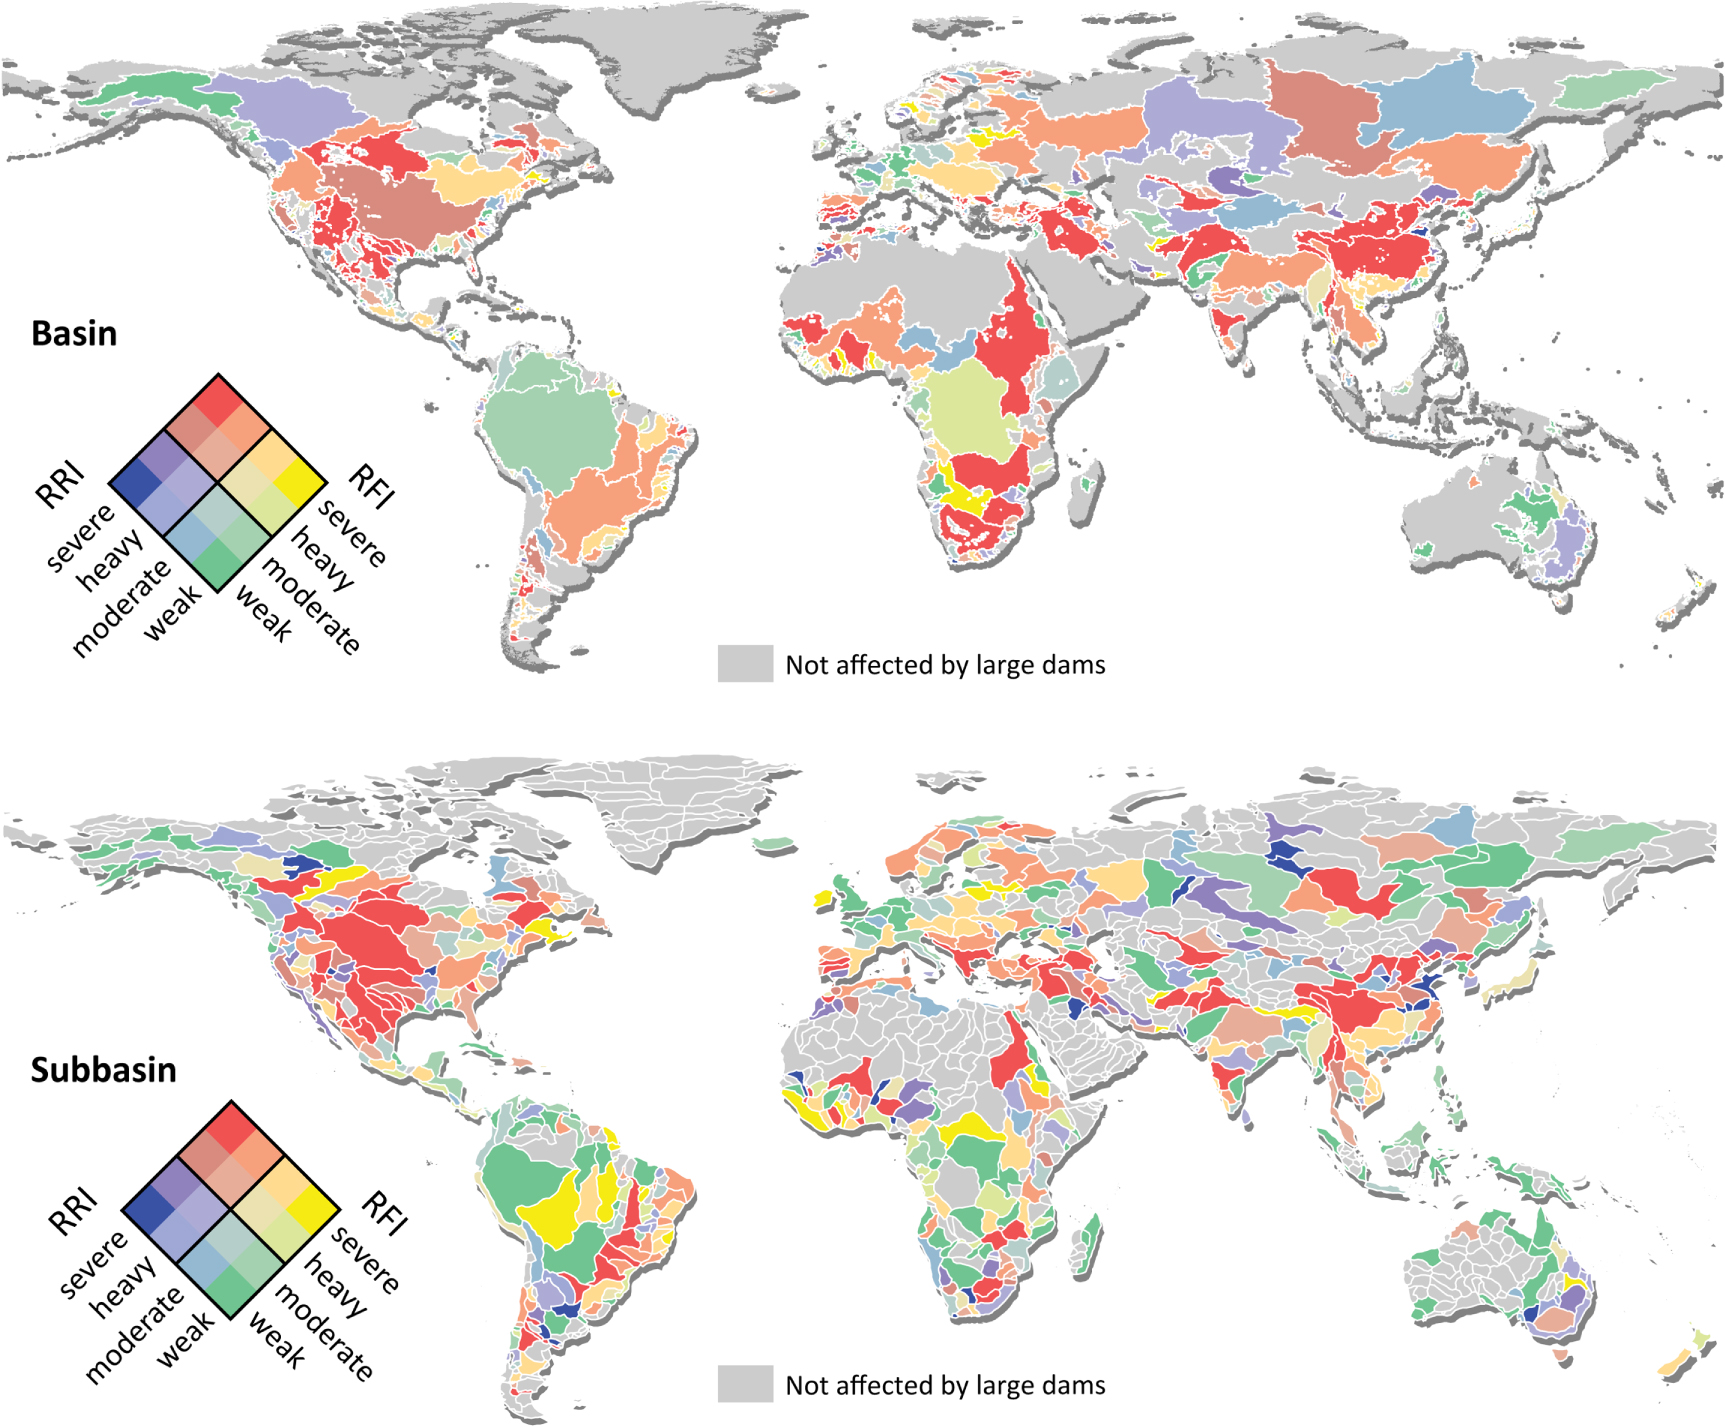
Figure 2. Legend for dam impact matrix (DIM) showing qualitative impact categories for the river fragmentation index (RFI) and the river regulation index (RRI). The 16 possible combinations can be grouped into four broader categories representing types of impact: (1) basins with both low fragmentation and low flow regulation (lower quadrant, green colors); (2) basins with high fragmentation but low flow regulation (right quadrant, yellow colors); (3) basins with low fragmentation but high flow regulation (left quadrant, blue colors); and (4) basins with both high fragmentation and high flow regulation (top quadrant, red colors).
Download figure:
Standard image High-resolution image3. Results
3.1. Global trends in fragmentation and flow regulation
Averaged over all basins, both fragmentation (+32%) and flow regulation indices (+43%) deteriorated substantially, with the greatest change between 1950 and 1980 (figure 3). After 1980, the trajectory of both curves indicates that the rate of deterioration due to dam building has slowed considerably, especially after the year 2000. The construction of all future dams by 2030 would further increase fragmentation (+12%) and flow regulation (+10%) at rates similar to the maximum changes of the last century.
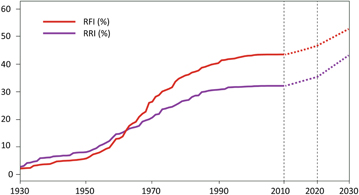
Figure 3. Graph showing the trajectory of RFI and RRI indices averaged over all global basins between 1930 and 2010 (based on GRanD) and for a future hydropower scenario (dotted lines) based on Zarfl et al (2014). Values reflect area-weighted means of indices across all global basins.
Download figure:
Standard image High-resolution imageGlobally, a total of 1293 main (i.e. not subdivided) river basins contain large dams today. These basins represent 59% of global rivers with 28.6 million km of combined length (figure 4 and table S2). An additional 209 basins are affected by at least one future large dam in the 2030 scenario, an increase of 16% in the number of affected basins; an additional 1.6 million km of rivers would be affected (6% increase). The total reservoir storage volume would increase by 39% from 5759 km3 in 2010 to an estimated 8007 km3 in 2030.
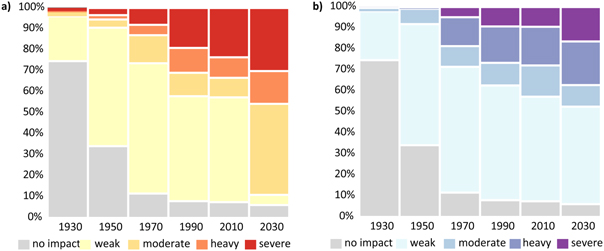
Figure 4. Proportion of global river volume impacted by fragmentation (a) and flow regulation (b) for each impact category (see figure 6 for classification criteria). See table S2 for impact values summarized by affected length (km) instead of volume.
Download figure:
Standard image High-resolution imageThe total river length in basins unaffected by large dams today amounts to 41%; however, many of these river reaches are in arid or semi-arid regions. If river volume is substituted for river length, we find that basins not impacted by any large dams in our analysis contain just 7% of global river volume, meaning that 93% of the world's river volume lies in basins with at least one large dam (figure 4 and table S2). However, this result is highly influenced by the Amazon River which drains roughly one sixth of global discharge. For a more conservative estimate, we only assessed basins that fall within the fragmentation classes of moderate to severe (i.e. 25th percentile and up). With this alternative estimate, the total river volume of all moderately to severely fragmented basins today amounts to 43% of the global river volume; in the 2030 future scenario, this more than doubles to 89%, suggesting that new large dams will add major pressure to global river basins.
Regarding flow regulation, the total river volume of all moderately to severely regulated basins today also amounts to 43% of global river volume, the same value as for fragmentation; yet the individual impact classes have a very different distribution: for example, 9% of river volume is severely affected by flow regulation while 24% of river volume is severely affected by fragmentation (figure 4 and table S2). In the 2030 future scenario, the total percentage of moderately to severely impacted rivers for flow regulation increases only slightly to 48%, but many rivers experience shifts from lower to higher impact classes.
In combination, today a total of 48% of river volume is moderately to severely impacted by either flow regulation, fragmentation, or both. In the 2030 future scenario, assuming completion of all dams planned and under construction, this number would rise to 93%, mostly due to large dam construction in the Amazon basin.
In order to compare our volumetric results to Lehner et al (2011) who focussed on river length, we calculated the volume of all reaches with DOR values ≥2%, a threshold previously used to distinguish 'affected' rivers (Dynesius and Nilsson 1994, Nilsson et al 2005, Lehner et al 2011). The volume of these regulated downstream rivers currently amounts to 34% of global river volume, rising to 65% in the 2030 scenario mostly due to large dam construction along the Amazon. The volume affected is substantially greater than for length (estimated by Lehner et al 2011 to be ∼8% of global river length). The effects of flow regulation are therefore skewed towards high volume rivers, while large dams less directly affect smaller rivers.
While global trends illustrate the general trajectory of worldwide dam developments and their impacts, there is significant regional heterogeneity in both temporal and spatial patterns. For example, some river basins show relatively low impacts by large dams until recently, including the Amazon, Mekong and Salween Rivers (figure 5). On the other hand, river basins such as the Nile, Mississippi, Nelson and Indus were already heavily impacted early in the 20th century. While some river basins have deteriorated in both RFI and RRI in the past, others show impacts only in one of the indicators. For example, the Murray–Darling is only weakly affected by fragmentation, but is heavily impacted by flow regulation (due to large reservoir volumes coinciding with low flow volumes). In contrast, the Danube is severely impacted by fragmentation effects, but only weakly affected by flow regulation. In the future scenario, some basins may not experience much additional change, such as the Yenisei or the Nelson, while others have substantial increases in RFI alone (Yangtze, Danube, Parana), RRI alone (Irrawaddy, Indus), or for both indices (Mekong, Nile, Orange).

Figure 5. Changes in fragmentation and flow regulation for 12 selected large basins.
Download figure:
Standard image High-resolution image3.2. Past and current impacts at basin and subbasin scales
3.2.1. River fragmentation
Our fragmentation analysis based on RFI reveals that 43% of the global river volume is moderately to severely impacted today, and that severe impacts affect 24% of the global river volume (table S2). A total of 96 large river basins (defined as >350 m3 s−1 discharge) are heavily to severely impacted by fragmentation from dams (figure 6(a) and table S3). However, rivers can appear heavily or severely impacted at the overall basin scale, while the subbasin scale may reveal many less impacted areas, e.g., if most dams are clustered only in certain tributaries. Examples are the Mississippi River in North America, the Parana River in South America, or the Niger, Zambezi and Nile Rivers in Africa, which all appear heavily or severely affected at the basin scale but at the subbasin scale larger proportions or even the majority of reaches are only weakly to moderately affected. In particular, dams at central locations relative to the full basin fragment the entire network resulting in severe degradation at the basin scale; the same dams can result in lower fragmentation scores at the subbasin scale, particularly if they are located at subbasin boundaries.

Download figure:
Standard image High-resolution image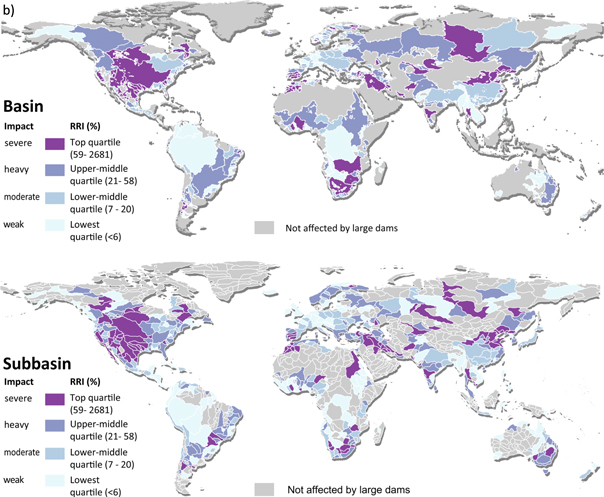
Figure 6. (a) River Fragmentation Index (RFI) at the basin and subbasin scale (circa 2010). The RFI values are classified according to quartiles (0–25th, 25–50th, 50–75th, and 75–100th percentiles).
Download figure:
Standard image High-resolution image3.2.2. Flow regulation
Our analysis shows that 9% of global river volume is severely affected by flow regulation from dams (less than by fragmentation) and 18% and 15% are heavily and moderately affected, respectively (more than by fragmentation; table S2). A total of 103 large river basins are heavily and severely affected by flow regulation, in particular extensive regions of North America, Africa, the Iberian Peninsula, Eastern Europe, Eastern Asia, and South-Central Asia (figure 6(b) and table S3). As with fragmentation, there are noteworthy differences of impact classifications at smaller scales. For example, most flow regulation impacts of the Mackenzie River in Northern Canada result from dams in higher tributaries with propagating effects downstream, whereas other parts of the basin are less affected. The Amazon and Congo Rivers have been relatively unaffected by flow regulation, and some of their tributaries show no signs of direct impact by large dams today. Rivers of the Greater Mekong Region (including the Mekong itself) as well as smaller rivers such as the Rhine and Po in Europe have been relatively unaffected by flow regulation from dams as well, due to either fewer dams or lower reservoir capacities.
3.2.3. DIM of fragmentation and flow regulation
Although many dams have comparable impacts on river flow and fragmentation, some dams cause a bigger impact on one or the other. This translates into numerous basins being more affected in only one of the two impact categories (figure 7).
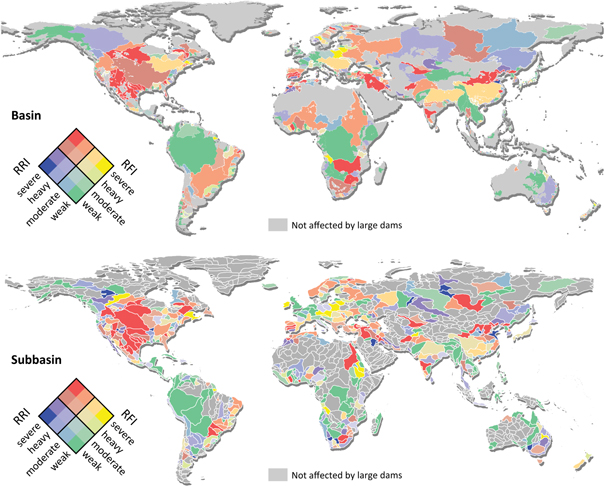
Figure 7. Combining fragmentation and flow regulation indices for the basin (top) and subbasin scale (bottom) for the current situation (circa 2010). The class breaks correspond to the percentiles classification in figure 6. This approach allows identification of four primary groups of impacts (see caption of figure 2 for more details on classification scheme).
Download figure:
Standard image High-resolution imageThe top quadrant of the DIM (red colors), i.e. basins heavily to severely affected by both flow regulation and fragmentation, includes a total of 407 basins (21% of global river volume). This category highlights basins that have both dams on mainstem rivers and large reservoir volumes high upstream in the network. These are typically basins with a long history of dam building (e.g., the Nile, Mississippi, or Yangtze).
A total of 221 river basins (right quadrant, yellow colors) are heavily to severely affected by fragmentation, yet only weakly to moderately impacted by flow regulation (12% of global river volume). This category represents basins with a majority of run-of-the-river dams that have high impacts on fragmentation but relatively low storage capacities (e.g., the Danube).
The left quadrant of the DIM (blue colors) combines 234 river basins that are heavily or severely impacted by flow regulation but only show weak to moderate impact from fragmentation (7% of global river volume). Examples in this category include the Nelson, Ob, or Murray–Darling, with large reservoirs located in their headwaters.
River basins remaining only weakly to moderately affected by large dams in terms of both fragmentation and flow regulation (bottom quadrant, green colors) amount to 431 (53% of global river volume). Examples of these least impacted basins include certain parts of the Greater Mekong Region, several basins in South-Central Asia, the Amazon, Orinoco, Tocantins, as well as large proportions of Western and Eastern Europe.
3.3. Future impacts at basin and subbasin scales
3.3.1. River fragmentation
New dams in our 2030 future scenario stress many currently less-affected basins, encompassing a large proportion of global river volume. For example, in the currently weakly affected basins of the Greater Mekong Region, rivers such as the Salween, Irrawaddy and Mekong undergo significant changes, with substantial deterioration of connectivity (see figure S2). These basins are classified in the 2030 scenario as heavily or severely impacted in both RRI and RFI. The Yangtze River shows a similar deterioration, particularly in upstream portions of the basin where a large number of new dams reduce connectivity at the basin scale.
Substantial losses in connectivity are also predicted in the Amazon Basin (RFI +24%). The subbasin scale reveals which reaches contribute to this decline: numerous dams in the middle and lower portions of the Madeira, Tapajos, and Xingu subbasins cause vast increases in fragmentation (RFI +73%, +79%, and +50%; figure S2). A large number of dam projects concentrated in the higher Andes region of the Amazon Basin lead to smaller connectivity losses (RFI +4%) in the subbasin upstream of the Madeira tributary, but these are still considered a substantial change (see Finer and Jenkins 2012). The Tocantins basin is also highly affected by fragmentation, losing 56% of its connectivity.
A number of planned dams in the upper Nile Basin (Lake Victoria catchment) cause additional impact (+18%) to an already severely affected basin. In North America and Europe, changes in fragmentation are less extreme (e.g., Mackenzie: +12%; Danube: +23%), in part because river systems in these regions are already quite highly fragmented. In Siberia, changes in fragmentation are projected to be mostly smaller, yet with stronger impacts in some subbasins. The Amur in East Asia shows very substantial increases in fragmentation (+46%) due to a new central mainstem dam and numerous large tributary dams.
3.3.2. Flow regulation
Our model results for the 2030 future scenario suggest that an additional 209 currently unaffected river basins will be affected by flow regulation. There are 46 additional basins severely affected as a result of 1156 future dams. This causes the amount of 'severely affected' river volume to rise from 9% to 16%. Smaller increases occur in the 'heavily affected' category (1351 dams), with a total increase of 2% in an additional 28 basins.
A number of hot spots with more drastic changes are shown in figure S2. For example, hundreds of dams are planned along the southern slopes of the Himalaya and Pamir Mountains, which would lead to substantial downstream impacts, particularly dominant in the Indus (113 dams; RRI +153%) and across almost all Brahmaputra River subbasins (392 dams; +15%). The Salween River would experience a 132% increase in flow regulation due to 25 planned dams. Another hot spot is the upper Yangtze River where 133 large dams are planned, many of them on the mainstem (+71%).
3.3.3. DIM of fragmentation and flow regulation
Future dam development will occur mostly in basins that are already affected by dams, so only an additional 2% of river volume from previously unimpacted basins is newly affected by future dam construction in 2030. However, substantial impacts and shifts are found within the individual groups of the DIM (figure 8). The number of basins that become heavily to severely affected by both regulation and fragmentation (top quadrant of DIM, red colors) increases by 71 (an additional 11% of global river volume). Basins in the lower (green) quadrant also increase by number as formerly unimpacted (and mostly small) basins become impacted. But this group now aggregates less total river volume (−9%) because larger basins have shifted towards the higher impact groups.

Figure 8. Combined impacts for the future scenario of 2030 in which all large hydropower dams currently planned or under construction are built (see caption of figure 2 for more details on classification scheme).
Download figure:
Standard image High-resolution image4. Discussion
Several studies have reported widespread global effects of dams (e.g., Nilsson et al 2005, Vörösmarty et al 2010, Lehner et al 2011, Reidy Liermann et al 2012), but mostly at coarse spatial or temporal resolutions. Using the best currently available hydrographic data, our study is the first global analysis where a graph-based river routing model was applied to model past and future impacts of dams at multiple scales and at high spatial resolution. While most frameworks include river length or surface area as an indicator of dam impacts, we developed an indicator based on river volume. River volume may more adequately represent freshwater habitat space and aquatic biodiversity, assuming that larger rivers generally have a greater opportunity for more heterogeneous habitats that fosters greater overall biodiversity (Xenopoulos and Lodge 2006). In particular, volume, rather than length alone, may be a better proxy for lateral connectivity and its implications for riparian systems (assuming that larger rivers tend to have more extensive floodplains). Nevertheless, as a relatively new measure, more research is needed to determine the strengths and weaknesses of river volume for specific ecohydrological applications.
We also found that river volume improves assessment of cross-scale impacts as it inherently incorporates the concept of stream orders. If river length is used, low level stream orders (first- and second-order streams) can add disproportionately large amounts of river length to the network (>70% of rivers are headwater streams; Lowe and Likens 2005), yet their contribution to volume is small. By using river volume, network configuration and the range of included (smaller) stream orders becomes less important, enabling greater comparability of indicators between studies with differently detailed river networks.
Our study confirms that examining dam impacts at different scales is critical. Indicators on the basin and subbasin scale can target different applications, each with specific advantages and disadvantages. For example, calculations at the basin scale integrate impacts across the entire river system, allowing for inter-basin comparison. This is particularly useful in cases where connectivity or flow regulation need consideration at the scale of a single basin (e.g., movement patterns of long distance migrating fish, such as large catfish in the Mekong River). However, the wide range of basin sizes—spanning several orders of magnitude globally—confounds comparisons between small and large basins. Our subbasin results reveal higher intra-basin detail and better differentiation among river systems. Nonetheless, achieving a homogenous hierarchical nesting is more difficult in river systems compared to terrestrial systems (see Kunin 1998). There are several valid ways to partition basins into subbasins, typically based on the size or stream-order of tributaries, each triggering different results. Selecting a useful and homogeneous subbasin breakdown, such as provided by HydroBASINS, is thus a critical task.
Small and medium sized dams (not included in our assessment) can have a significant cumulative effect on flow regulation (Lehner et al 2011), but similar effects for fragmentation have not been systematically analyzed to date at the global scale. We conducted a sensitivity analysis using the Mississippi Basin and compared the resulting effect of all 25 857 dams included in the National Anthropogenic Barrier Dataset (Ostroff et al 2013) to the effect of the set of 704 large dams provided in GRanD. We found substantial changes for both RFI and RRI indicators, with increases in basin-wide flow regulation from 65% to 90% and increases in fragmentation from 45% to 65% (table S1). At the subbasin scale (figure S1), changes vary throughout the basin, with the Arkansas and the Missouri Rivers being most affected by river regulation, and the Upper Mississippi and the Red River showing the greatest fragmentation changes. These findings suggest that global impacts of all dams—large and small—are likely far more severe than illustrated by our results.
Natural barriers, such as waterfalls, could have similar consequences for river network connectivity as dams (Torrente-Vilara et al 2011, Dias et al 2013); although they also have unique characteristics such as typically allowing for greater permeability for species in the downstream direction. We conducted an exploratory assessment with a new global dataset of waterfalls (figures 9 and S3). When incorporating waterfalls, the natural connectivity of many watersheds is reduced, which provides a different baseline for our fragmentation assessment. The fragmentation values of dams built in the vicinity of waterfalls may therefore be smaller than in a fully connected network; on the other hand, a dam built in the middle of a subbasin upstream of a waterfall may have more significant impacts for this already isolated subbasin than if its downstream part were still connected to the larger system. The inclusion of waterfalls thus has implications for impact assessments of individual dams or groups. Similarly to waterfalls, intermittent rivers lead to seasonally diminished hydrological connectivity and may have comparable effects on natural river connectivity patterns. To include a more differentiated view of natural discontinuities, more data on their location as well as a better understanding of their effect on passage of species up- and downstream is required.
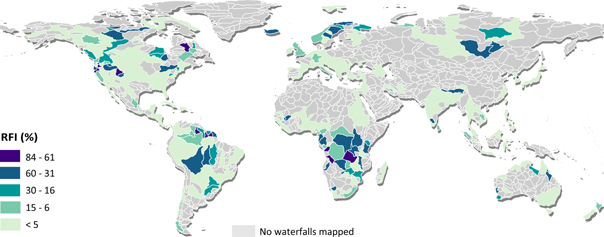
Figure 9. Effect of waterfalls on connectivity illustrated as a shift in the baseline river fragmentation index: RFI values calculated by using a set of 2435 waterfalls assumed to be barriers with zero permeability (HydroFALLS, Lehner et al unpublished data).
Download figure:
Standard image High-resolution image
Our future dam scenario is designed to provide an illustration of the potential impacts of plausible new hydropower developments, yet it should not be misinterpreted as a prediction of the 'most likely' future situation. There are typically more dams planned than are actually built, related to funding and other political and economic factors that are difficult to predict, thus determining the likelihood of planned dams being commissioned is afflicted by high uncertainties. In contrast, we consider the completion of dams already under construction rather likely. Our scenario shows that if only the dams that are under construction today (representing 17% of the 3700 dams in Zarfl et al 2014) were built, fragmentation and regulation indices would increase by 4% each, which constitutes 31% and 38% of the total future increases by 2030 for RFI and RRI, respectively. This confirms that a large proportion of the anticipated impacts will already be caused by rather likely developments in the near future, and a similar trend would then continue if all planned dams were built by 2030 (see figure 3).
However, important shortcomings of our scenario assessment remain. The geographic coverage and completeness of the applied database of future dams is difficult to verify, warranting extra caution when drawing conclusions based on differences between regions. Also, the focus here on hydropower dams may lead to a bias towards fragmentation (rather than flow regulation), yet this may adequately reflect the recent tendency towards building multi-purpose dams while storage-only dams become less common globally. Finally, we acknowledge that our simplified estimation of reservoir volume for future dams based on hydropower capacity has considerable uncertainties. Nevertheless, since our future scenario is based on large hydropower dams only, we likely underestimate the total impacts of other dam types, particularly those related to climate change mitigation and water storage (e.g. irrigation and flood control), as well as small future dams.
An important research challenge remains unaddressed in our study, namely to relate these indicators to actual changes in habitat structure, biotic composition, or biodiversity. As a step towards addressing this challenge, our framework is capable of providing spatially disaggregated changes of impact scores over time and can therefore be used to monitor the fragmentation history of a basin. Such information could be related to past changes in biological indicators to determine if the construction of a specific dam was associated with ecohydrological changes in the river basin.
Given the current capabilities and insights that our framework provides, our approach can also help to identify individual dams or sets of 'hot spot' dams to guide researchers and water resources managers in determining where to conduct more detailed local environmental impact assessments. With an increasing number of dams becoming dysfunctional due to sedimentation, our framework could also inform regional dam removal strategies by prioritizing which dams would potentially provide the biggest benefit if removed (O'Hanley 2011, Hoenke et al 2014).
Finally, the framework can be applied in support of conservation planning efforts (Hermoso et al 2011). Although many basins are currently impacted, we have identified basins that are relatively pristine in terms of dam effects, but under pressure from possible future dam construction. As a large-scale framework, our methodology could be used to minimize further exposure, for example, by identifying free-flowing river sections as part of a strategy to derive conservation targets or to design protected areas (Pringle 2001, Abell et al 2007, Thieme et al 2007).
5. Conclusion
We developed a versatile framework to assess river fragmentation and flow regulation by dams based on state-of-the-art global hydrographic data and novel approaches using discharge-based indicators. Almost half of the global river volume is moderately to severely impacted by either flow regulation, fragmentation, or both. Assuming completion of all hydropower dams planned and under construction in our future scenario, this number would increase dramatically.
Assessing the effects of dams on river networks is a complex endeavor due to the need to account for interacting and cumulative effects of multiple types of flow regulation and fragmentation perturbations. We suggest that multiple indicators should be assessed simultaneously, and that naturally reduced connectivity by waterfalls and intermittent rivers is included. River volume proved to be a more representative and robust metric for assessing river systems across scales compared to commonly used metrics such as river length or basin area. We identified substantial intra-basin heterogeneity of impacts which was previously difficult to assess, suggesting that studies should be conducted at multiple scales.
We found that prolonged and prolific dam building has resulted in large-scale deterioration of the majority of global river basins, with at times heavy to severe impacts. This result is in good agreement with previous studies (Nilsson et al 2005, Lehner et al 2011). Yet our new indicators reveal an even higher impact when river volume (rather than length) is used as the basis of assessment. A sensitivity analysis for the Mississippi River in which we added small and medium dams to our global database of large dams suggests that our results are conservative, and that global dam impacts are likely of much greater concern than illustrated here when small dams are considered as well.
Our research offers a consistent framework for assessing large-scale dam impacts over space and time in a world with increasing pressures on water resources. We believe that the proposed method and indicators can be applied in multiple ways: as a standardized, easily replicable monitoring tool that provides comparable global and basin-scale indicators of changes and trends in support of international initiatives such as the Millennium Development Goals, the Global Biodiversity Outlook or the Biodiversity Indicator Partnership; as a complementary set of indicators to support existing methods such as the Indicators of Hydrological Alteration (Richter et al 1996) or the Ecological Limits of Hydrologic Alteration (Poff et al 2010); or as a contribution to more comprehensive assessment strategies that evaluate existing and planned hydropower projects such as the Hydropower Sustainability Assessment Protocol (www.hydrosustainability.org). We strongly encourage practitioners and relevant agencies to systematically compile the required information (foremost dam locations, reservoir purpose, and storage volumes) to support these kinds of assessments.
The results of our research emphasize the need for water managers and planners to consider cumulative, large-scale impacts of multiple dams as part of an integrated 'river systems' mindset. In this regard, our framework can be implemented in strategic dam planning efforts and regional scenario developments to help identify the most critical sets of dams or alternative options in efforts to minimize social and environmental tradeoffs associated with dam development while maintaining their socio-economic benefits.
Acknowledgments
This work was supported in part by the Natural Sciences and Engineering Research Council of Canada; World Wildlife Fund (WWF Greater Mekong and WWF US); the EU FP7 BioFresh Project, Berlin, Germany; the Global Environmental and Climate Change Centre (GEC3), Quebec, Canada; and McGill University, Montreal, Canada. G K MacDonald received additional research support from the Gordon and Betty Moore Foundation. The authors wish to thank Peter Meier, International Centre for Environmental Management (ICEM) for advice on calculating reservoir storage volume, and Jeff Opperman of The Nature Conservancy (TNC) for contributions to improve the manuscript. We are grateful to three reviewers who provided valuable comments and constructive criticism and to many other colleagues who contributed to this research and the manuscript.