


Abstract
Plug-in electric vehicle (PEV) use in the United States (US) has doubled in recent years and is projected to continue increasing rapidly. This is especially true in California, which makes up nearly one-third of the current US PEV market. Planning and constructing the necessary infrastructure to support this projected increase requires insight into the optimal strategies for PEV battery recycling. Utilizing life-cycle perspectives in evaluating these supply chain networks is essential in fully understanding the environmental consequences of this infrastructure expansion. This study combined life-cycle assessment and geographic information systems (GIS) to analyze the energy, greenhouse gas (GHG), water use, and criteria air pollutant implications of end-of-life infrastructure networks for lithium-ion batteries (LIBs) in California. Multiple end-of-life scenarios were assessed, including hydrometallurgical and pyrometallurgical recycling processes. Using economic and environmental criteria, GIS modeling revealed optimal locations for battery dismantling and recycling facilities for in-state and out-of-state recycling scenarios. Results show that economic return on investment is likely to diminish if more than two in-state dismantling facilities are constructed. Using rail as well as truck transportation can substantially reduce transportation-related GHG emissions (23–45%) for both in-state and out-of-state recycling scenarios. The results revealed that material recovery from pyrometallurgy can offset environmental burdens associated with LIB production, namely a 6–56% reduction in primary energy demand and 23% reduction in GHG emissions, when compared to virgin production. Incorporating human health damages from air emissions into the model indicated that Los Angeles and Kern Counties are most at risk in the infrastructure scale-up for in-state recycling due to their population density and proximity to the optimal location.
Export citation and abstract BibTeX RIS

Content from this work may be used under the terms of the Creative Commons Attribution 3.0 licence. Any further distribution of this work must maintain attribution to the author(s) and the title of the work, journal citation and DOI.
Introduction
Plug-in electric vehicle (PEV) use in the United States (US) has increased substantially in recent years. After doubling between 2012 and 2013, PEV sales were projected to increase another 30% in 2014 [1]. One report projects that PEVs will compose 80% of new car sales by 2050 [2]. PEVs provide a promising option for reducing the transportation sector's reliance on petroleum and greenhouse gas (GHG) emissions, provided the carbon-intensity of electricity generation is reduced over time [3]. Lithium-ion batteries (LIBs) have become the common choice for PEV manufacturers due to their relative affordability and high energy density. In California, the rise of PEV use has been dramatic; the state accounts for nearly one-third of US PEV sales [4]. However, increasing PEV adoption presents solid waste challenges. In California alone, where vehicle ownership averages 0.83 per capita, a fully electrified fleet with 200 kg batteries that last 7–10 years would result in a waste flow of 620 000–890 000 metric tons/year [5].
LIB recycling technologies have the potential to minimize the environmental impacts of these waste flows by recovering materials for reuse. However, LIBs are an evolving technology that presents difficulties for developing recycling methods that maximize process efficiency through specialization. The upfront costs of LIBs have improved by transitioning to more cost-effective materials, which in turn reduces the economic incentives to recover those materials at their end-of-life. Despite this fact, current recycling technologies offer environmental benefits of reduced air pollution and energy demands by offsetting virgin material production [6]. The European Union has already mandated target LIB collection and recycling rates, regardless of current economic inefficiencies [7]. California is likely to require LIB recycling in the future given the state's affinity for 'zero waste' goals in cities [8].
California so far lacks the infrastructure to manage LIBs at their end-of-life, and the supporting supply chain growth must comply with GHG emission restrictions [9]. The state also presents unique environmental challenges, as the impact of water use and criteria air pollutant emissions can vary significantly across the region. To fully understand the implications of scaling up PEV recycling in California, decision makers must be equipped with models that provide likely infrastructure build-out scenarios for battery collection, dismantling, and recycling, accounting for complete life-cycle environmental implications.
To accomplish this, we assessed the available recycling technologies and supporting infrastructure on the basis of environmental and economic criteria. Using state-specific data, we employed geospatial modeling to create scenarios for projected LIB waste streams and determine optimal dismantling and recycling facility locations for both in-state and multi-state systems. Life-cycle assessment (LCA) was used to assess hydrometallurgy and pyrometallurgy recycling systems, resulting in new factors for life-cycle GHG emissions, primary and secondary energy demand, water use, and criteria air pollutant emissions. Hydrometallurgy represents a more specialized, chemistry-specific process capable of recovering lithium and aluminum in addition to higher-value metals. Pyrometallurgy is a flexible process, capable of accepting a wide variety of LIB chemistries in a single facility, as well as nickel metal hydride batteries, that focuses on recovering only high-value materials including nickel, cobalt, and copper; unrecovered materials are incorporated into slag that can be sold as a cement supplement [10, 11]. We incorporated the LCA criteria air pollutant emissions results into our geospatial model to calculate regional human health damages for each recycling scenario. By integrating LCA with geospatial modeling, our study created a unique approach to capture the expected infrastructure needs for LIB end-of-life management and quantify the environmental risks and benefits associated with PEV battery recycling systems.
Scope and methodology
This study used LCA and geographic information systems (GIS) supply chain modeling to analyze LIB production and all aspects of battery end-of-life management for PEVs in California. Because the impacts of vehicle operation are assumed to be identical across end-of-life scenarios and battery chemistries, the use phase was excluded from the scope, but has been analyzed in several previous studies [11–16]. Figure 1 shows the scope of the study and where the different modeling techniques were employed.
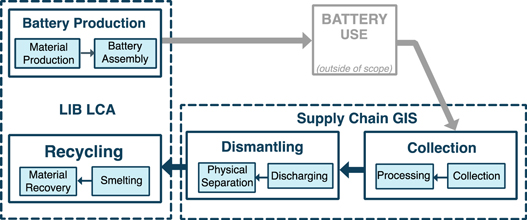
Figure 1. Study scope for battery production and recycling processes.
Download figure:
Standard image High-resolution imageBattery production LCA
Performance characteristics of the Nissan Leaf battery (24 kWh capacity) were used as a general industry proxy in determining the full theoretical battery design for three LIB chemistries (LiMn2O4 (LMO), LiFePO4 (LFP), LiNi0.4Mn0.4Co0.2O2 (NMC)) [17]. Argonne National Laboratory's Battery Performance and Cost tool, which generates LIB material needs based on real world data, was used to model anode and cathode materials requirements [18]. The mass distribution for the remaining battery components were taken from standard values in Argonne's Greenhouse gases, Regulated Emissions, and Energy use in Transportation (GREET2) tool, which estimates environmental outputs and resource requirements for electric vehicles [19]. The total masses for the three different electrode chemistries analyzed in this study were found to be 191 (LMO), 183 (LFP), and 167 (NMC) kg. Full details for the battery design can be found in the supplementary data (SD).
We used LCA to determine the inputs and emissions associated with LIB production. The method has been previously employed in the related literature; existing studies have presented detailed life-cycle inventories for PEV LIB cradle-to-gate environmental outputs [11, 13–16, 20, 21]. Full descriptions of related studies can be found in the SD. Only two prior studies contain detailed life-cycle outputs from PEV battery recycling [11, 20]. Dunn et al studied hydrometallurgy, intermediate physical, and direct physical processes [20]. The US EPA calculated outputs from hydrometallurgy, pyrometallurgy, and direct physical processes, but averaged the three results together making the individual processes indistinguishable [11].
For LIB production, we expanded on the related LCA literature by including new environmental criteria results for battery production in primary and secondary energy sources, water consumption, and water withdrawals for LMO, LFP, and NMC chemistries. The specific contributions to recycling technologies are detailed later in the text. GREET2 was used to determine the primary energy demands and GHG emissions, and was customized to determine electricity demands. Criteria air pollutant emissions were limited to the LMO battery chemistry due to data limitations in GREET2 [19]. Water consumption and withdrawals for battery production were calculated based on a separate study [22]. Individual LCA material production data sources are documented in the SD.
Geospatial supply-chain modeling
The GIS modeling methodology was designed to estimate the economic costs, GHG emissions, and human health impacts associated with the supply chain of the PEV batteries during their end-of-life. The scope of this project was to create a centralized recycling scenario for California and optimize the facility locations to minimize the economic and environmental impacts of the supply chain. The centralized scenario assumed one recycling facility with the capacity to satisfy the annual disposed battery flows. This assumption was based on the use of pyrometallurgy for recycling, a capital-intensive technology that can accept many variations of LIBs. An optimization analysis was used to estimate the optimal number of dismantling facilities in the system based on the minimization of capital and transportation costs. An algorithm was developed for geospatial optimization of dismantling and recycling facility sites using a location-allocation methodology that integrates the economic and environmental metrics into the segments of a GIS network [23]. The optimization process was based on the minimization of the total ton-kilometers transported between the collection points and the final recycling destination. This is the appropriate objective function to minimize as the economic and environmental costs correspond to the total distance traveled by applying specific metrics and emission factors.
GIS tools have been implemented in various applications in the past; for example, previous work has been done in the areas of resource assessment and facility location choice for analyzing bioenergy systems [23–25]. Location-allocation models have also been used as a tool for public facilities planning with the goal of minimizing transportation distances [26]. Corbett et al prepared a Geospatial Intermodal Freight Transportation model for the California Air Resources Board and the California Environmental Protection Agency that describes the energy and environmental impacts of goods movement through California's intermodal transportation systems [23]. Our analysis builds on the previous GIS optimization work by adding the capability to estimate the corresponding economic costs, energy use and GHG emissions, and county-level human health damages.
Two alternative scenarios were developed to illustrate the end-of-life options in which batteries are recycled in-state and out-of-state. In-state recycling with a centralized facility could offer state-level management to the system and decrease the distance the batteries would need to travel. However, out-of state recycling allows for larger centralized facilities that would benefit from economies of scale and easier access to batteries and markets for recovered materials beyond California.
To model the supply chain, a network dataset was created in an ArcGIS software environment to calculate the transportation distances and corresponding costs. Data on California's highway network, railway network, and other required data such as locations of major cities and train stations, and borders of counties and census tracts, were sourced from federal sources including the US Department of Commerce and the US Census Bureau [27]. Geographically explicit car dealership locations were acquired from the Data Lists website [28].
The collection points of the batteries were assumed to be car dealerships based on industry feedback, as these locations are currently used for battery testing and take-back for both recycling and second-life applications [29]. The model excludes transportation of consumers between home and the dealerships/collection points, which is a common practice in the literature [30]. The disposed battery mass was assumed to be equally distributed among the in-state car dealerships because the spatial distribution of dealerships is correlated with the county-level population. From the collection points, the batteries are transported to dismantling facilities for the second stage of the recycling process, where the separation of the non-hazardous materials (plastics, copper, and metals) for traditional recycling takes place. Recycling and recovery of these materials are included in the LCA model. At this stage, approximately 50% of the battery mass is diverted to traditional recycling facilities, since only the battery cells are shipped to a centralized battery recycling facility [29, 31]. Second life applications would potentially alter the distribution of the batteries before recycling and this would have implications on the facility optimization process described in this paper. However, this is outside of the scope of the current project and will be implemented in future work.
The final destination of the battery cells is the centralized recycling facility. For the facility optimization process, all California county centroids were considered as candidate locations, serving as a useful approximation for the purposes of this paper [32]. An important feature of the model is that it allows the user to set the preferred distance of the recycling facility from big city centers; placing facilities far away can minimize the health impacts from on-site emissions, while placing facilities within big cities may improve access to a qualified labor force and critical infrastructure.
Battery recycling LCA
This study characterizes the material flows and emissions for LIB recycling, with a focus on hydrometallurgical and pyrometallurgical recycling. Hydrometallurgy is a chemical leaching intensive process used to separate and refine materials with the capability of capturing both valuable metals and lithium. This process is currently under development for commercial use [20]. Pyrometallurgy uses a kiln firing process followed by leaching to recover slag and valuable metals. As discussed previously, existing literature has analyzed hydrometallurgy, but this study expanded on those results by including separate energy sources, water use, and criteria air pollutants for LMO batteries using life-cycle emission factors from GREET2 and Scown, including recycling materials production, process demands, and recovered material benefits [19, 22].
Pyrometallurgy offers an economical method for material recovery in reducing solid waste flows from PEV LIB use, provided enough high-value materials can be recovered. Industry practitioners of pyrometallurgy maintain that this process has the potential for economical material recovery for a large array of electrode chemistries without significant alterations to the method [33]. This characteristic is crucial for LIB recycling processes that must adapt to evolving technologies. The single-stack method offers economic advantages over hydrometallurgy in avoiding high operational costs and complexities [34]. However, challenges exist for pyrometallurgy with chemistries such as LMO, where the active materials are relatively cheap and recycling for reuse is not currently economical [36].
The pyrometallurgy inputs and emissions were calculated based on Umicore's patented one-stack technique, where alloy outputs are refined using leaching [34, 36]. Previous work has analyzed pyrometallurgy, but used general industry averages in applying values to LIB recycling [36]. In this study, life-cycle emission and consumption factors were calculated based on the material inputs, recycling processes, slag outputs for cement use, and materials recovered. Life-cycle pyrometallurgy emission factors were quantified for primary and secondary energy consumption, GHG emissions, water use, and criteria air pollutants. Full calculations and pyrometallurgy details can be found in the SD.
Human health impacts
The LCA and GIS model results were combined to determine the human health impacts from LIB end-of-life management by applying impact factors from the Air Pollution Emission Experiments and Policy (APEEP) model [37]. The APEEP model estimates the health damages that occur from the emissions of SO2, NOx, particulate matter (PM) and volatile organic compounds (VOCs). The air pollutant emissions that were taken into consideration were associated with the trucking and rail transportation from the GIS model, and the electricity consumption and on-site emissions of the pyrometallurgy facilities from the LCA model. Air pollutant emission factors for rail and truck transportation were taken from Carnegie Mellon's economic input-output LCA tool (EIO-LCA) [38]. For the on-site electricity use of the facilities, the corresponding emissions were allocated to the location of the power plants in California that were responsible for its production, based on the capacity of each plant, assigning appropriate emission factors according to the type of fuel used to produce electricity. Ground-level emission sources were assumed for the calculations. The results of using the APEEP model to calculate the corresponding health implications are discussed in the next section.
Results
Geospatial modeling results
Using California-specific data, we calculated the optimal facility locations and the corresponding total ton-kilometers traveled for both in-state and out-of-state recycling scenarios. Figure 2 shows the candidate and chosen locations for dismantling and recycling facilities for in-state recycling using only truck transportation. Our optimization model sited the facilities in close proximity to the clusters of the collection points, as the objective function of the optimization was the minimization of total ton-kilometers transported from all collection points. The sensitivity analysis indicated that the economics are most favorable for two dismantling facilities and as expected intuitively, the model optimally located them close to San Francisco and Los Angeles, the state's two largest population centers. If a third dismantling facility is added, the model recalculates the transportation distances and divides the collection points into three clusters (San Francisco, Los Angeles, Central Valley) in order to satisfy the new system optimal facility locations. The algorithms take into account the battery mass allocation at the collection points, which is why the optimal recycling facility is located closer to the cluster with the greatest number of dealerships and is not equidistant from both dismantling facilities. The allocation of battery mass at the collection points, the system-wide travel time minimization, and the siting criteria are some of the most important parameters that define the optimal locations of the facilities and allow for the calculation of the emissions and economic costs of the transportation system.

Figure 2. Candidate and chosen locations for in-state dismantling and recycling facilities, using truck transportation.
Download figure:
Standard image High-resolution imageIntuitively, more collection and recycling points in a system would yield greater transportation cost savings as the total ton-kilometers traveled are minimized. However, an increased number of facilities lead to greater capital costs. Considering such a tradeoff, it is important to examine the connections between capital and transportation costs.
Sensitivity analysis can provide insights into the tradeoffs between transportation cost savings and capital expenditures, yielding an optimal number of facilities [39]. The relationship between transportation costs and the number of dismantling facilities is highlighted in figure 3. There is a drop-off in the total ton-kilometers traveled when two dismantling facilities exist in the system and beyond that point, the curve reflects a flatter relationship with the transportation distances. Similar curves were found for out-of-state recycling scenarios as well. A sensitivity analysis was also used to determine the effect of the battery mass transported in relation to the marginal cost for the industry (figure 3). That analysis gave an exponential curve with the optimal recycling facility size of 7000 tons/year, which translated to a marginal cost of $34/ton (includes capital and transportation cost). The battery mass used in this study (7000 tons/year) was validated by the industry as it is the capacity of Umicore's facility [33] and it was used in the rest of the analysis to calculate the corresponding costs and emissions.
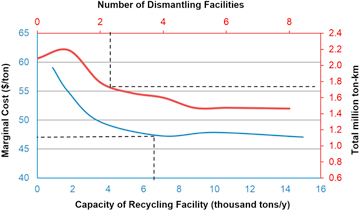
Figure 3. Sensitivity analysis of the relations between number of dismantling facilities and total ton-kilometers traveled (red curve), and between capacity of recycling facility and marginal cost (blue curve), for in-state recycling using truck transportation.
Download figure:
Standard image High-resolution imageThe capital cost of the facilities was calculated based on a facility's original cost and capacity by applying an appropriate scaling factor to vary the cost by size. This factor approximates the effects of economies of scale [40]. In this case a scaling factor of 0.6 was used reflecting the use of the facilities; the full equation and documentation can be found in the SD. This general method, widely used in the literature, allows for a quick estimation of the capital cost, but contributes a degree of uncertainty to the results because it is not tailored specifically to the investments required for battery recycling [41]. Two other cost components were taken into consideration: a loading/unloading cost and a distance-dependent travel cost. The effect of rail transportation was significant as the overall economic costs and GHG emissions for in-state transportation decreased by 12% and 45% respectively when rail was considered. The results for the different scenarios are shown in the SD.
Because the capital cost of the infrastructure is uncertain, a sensitivity analysis was run to determine the optimal number of dismantling facilities in the system for different capital costs. Assuming a capital cost of $1 million in figure 4, which we used in this study as indicated by industry feedback [33], there is a threshold in the number of facilities in the system and the most cost effective option is using two dismantling facilities.

Figure 4. Sensitivity analysis of the relations between the capital cost of infrastructure and number of dismantling facilities for in-state recycling using truck transportation.
Download figure:
Standard image High-resolution imageWhen capital costs are significantly higher ($5 million), minimizing the number of dismantling facilities is the most cost-effective option as facility capital costs are the driver of total costs. The opposite stands for a very low capital cost where it can be neglected in comparison to the transportation costs.
LCA results
Figure 5 shows the LCA production and recycling results for the LMO battery.
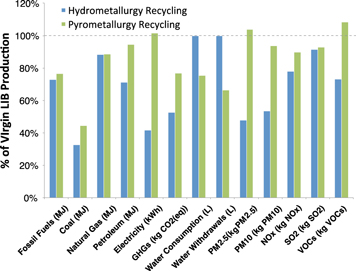
Figure 5. Resource use and environmental emissions of battery production and recycling (using hydrometallurgy and pyrometallurgy), compared to virgin battery production, for the LMO battery design.
Download figure:
Standard image High-resolution imageThe hydrometallurgy results reflect the recycling process emissions and consumption factors from customizing GREET2 to separate primary and secondary energy sources. Based on the potential material recovery, pyrometallurgy can offer advantages in water use due to recovered steel and copper. Water use in recycling processes was not captured in the modeling. Hydrometallurgy recovers copper and aluminum, but GREET2 does not account for hydrometallurgy specific values for recycling these materials [19, 20]. We assumed hydrometallurgy recycling values were similar to the industrial processes available in GREET2, and accounted for recovered steel and aluminum in LIB recycling. Hydrometallurgy achieves greater energy savings, especially in electricity consumption whereas pyrometallurgy has a high electricity demand due to recovered slag processing for use as a supplement for cement. Air pollutant and GHG emissions are also higher in pyrometallurgy due to coke production and combustion. On-site SO2 emissions from pyrometallurgy are controlled using a limestone sulfur scrubbing system.
We benchmarked our LCA results against the existing literature in table 1. The significant variation of results in these studies is due to differences in battery design, assessment scopes, and supply-chain processes (i.e., transportation and battery assembly). Recent studies have focused on nanotechnologies in anode production, which offer higher energy densities for battery operation but require greater inputs for production [13, 14]. This study shows similar results to Dunn et al whose authors also developed the GREET2 model [20, 36]. This study utilized a fully optimized battery design that minimized economic costs in production, driving the lower energy consumption in table 1 [19].
Table 1. Comparison of this study's energy results with existing literature.
| Embodied energy (MJ kg−1) | ||||||
|---|---|---|---|---|---|---|
| LMO battery | LFP battery | NMC battery | ||||
| Study | Virgin LIB production | Recycling | Virgin LIB production | Recycling | Virgin LIB production | Recycling |
| Dunn et al (2012)a [20] | 74 | −5 | — | — | — | — |
| Notter et al (2010) [14] | 104 | — | — | — | — | — |
| EPA (2013)b [11] | 220 | −31.9 | 541 | −70.5 | 435 | −64.7 |
| Majeau-Bettez et al (2011) [15] | — | — | 165.9 | — | 169.5 | — |
| Li et al (2014) [16] | — | — | — | — | 290.2 | — |
| Dunn et al (2015) [6] | 74 | — | 80 | — | 110 | — |
| This studyc | 54.1 | −6.5 | 64.4 | −6.5 | 70.4 | −12.2 |
aHydrometallurgy recycling values. bAverage of hydrometallurgy, pyrometallurgy and direct physical recycling values. cPyrometallurgy recycling values.
The recycling results of three studies are shown in table 1. Full results for LMO, LFP, and NMC production and recycling can be viewed in the SD. The greater recovered energy in the EPA study is due to the direct physical recycling process that was included, where electrode materials can be recovered and reused without any further processing. NMC energy recovery in this study was greater than the other two chemistries because cobalt was recovered in the pyrometallurgy recycling process [34].
Human health impact results
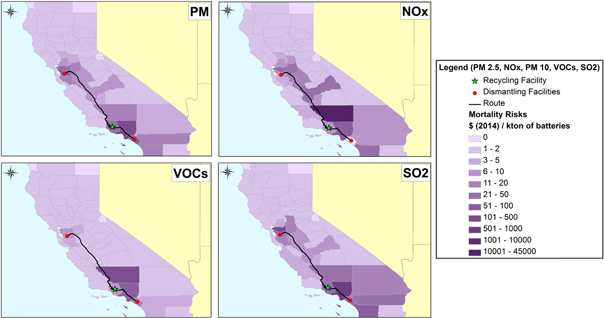
By combining the transportation distances from the GIS model with the air pollutant on-site emissions and electricity use from the LCA modeling, the health impacts can be calculated using the APEEP model. The APEEP model estimates the mortality risk, which is referred to as the value of statistical life, and assigns an economic value to each county to represent that effect [37]. The results shown in figure 5 are based on the optimal facilities locations and truck transportation routes for the in-state recycling scenario. In our scenario, freight trucks were the main source of PM, SO2 and VOCs, which were consequently highest in counties along the shipping routes for used LIBs. NOx emissions, which were mainly attributable to the pyrometallurgy facility, peaked in counties around the location of the facility. Air pollutants from the electricity generation were assigned to the existing power plant locations distributed throughout the state and their effect is based on each county's mortality risk parameters. Currently truck transportation is the primary mode for used batteries, so the corresponding health impacts were estimated assuming a business as usual case [31]. As illustrated in figure 6, most health impacts occur in Kern and Los Angeles counties because of their higher population density, topography, and large share of total distance traveled. Aside from NOx health damages, which were mostly attributable to the pyrometallurgy facility (96% of total), truck transportation was responsible for the majority of criteria air pollutants: 99% of PM damages, 54% of SO2 damages, and 62% of total VOC damages. The pyrometallurgy facility was responsible for 37% of the total VOC health damages and the electricity generated for pyrometallurgy processing accounted for the bulk of remaining SO2 health damages (45%). The pyrometallurgy recycling process emitted a negligible amount of SO2 on-site as a lime-scrubbing process controls these emissions.
Figure 6. Spatial distribution of human health impacts of in-state recycling for trucking transportation.
Download figure:
Standard image High-resolution image
Discussion
Battery recycling processes will be crucial to diverting PEV batteries from waste streams, but the full impacts of collecting, dismantling, and recycling these batteries must be accounted for. The collection and transportation of batteries contributes significantly to environmental and economic burdens, highlighting the need for improved optimization of end-of-life logistics. Moreover, the specific location of these activities has a strong effect on the overall human health impacts of recycling supply chains. This study demonstrates the feasibility and effectiveness of integrated models as an analytical and planning tool for decision makers. The model presented here provides a framework for integrating geospatial scenario analysis and LCA to support infrastructure decision-making.
PEV LIBs are an evolving technology, and as usage increases, recycling processes will continually adapt and change, driven by economic efficiency, environmental concerns, and changing battery chemistries. Pyrometallurgy recycling offers potential benefits, as it is flexible in accepting several battery designs and is cost-effective if enough valuable materials can be recovered. However, if a battery with relatively inexpensive active materials emerges as the dominant chemistry, pyrometallurgy could prove to be an economically inefficient option. Hydrometallurgy offers recovery of valuable metals and lithium, but is uncertain as a long-term solution as commercial processes are still being developed, hindered by significant operational complexities and economic costs [20, 34].
Newer recycling technologies, such as intermediate and direct physical processes, offer lower waste, higher quality recycling options that significantly reduce overall energy demand, but these systems are still being developed and few are available commercially [20]. Pyrometallurgical recycling uses coal products in processing and can lead to harmful human health impacts if SO2 emissions from coke combustion for smelting are not controlled with lime scrubbing. If this recycling technology is implemented and scaled up in areas with little environmental restrictions, the surrounding regions will experience increased health risks. Quantifying toxic substance releases and the subsequent impacts will be important to better understand these risks. Hydrometallurgy has few operational environmental burdens, but including supply chain effects in chemical production reduces those advantages [20]. If more data becomes available, water requirements in hydrometallurgy processing could be significant, a concern for water scarce regions such as California.
In assessing projections for substantial infrastructure scale up, uncertainties are inherent in the model assumptions. There are temporal uncertainties associated with the electricity mix and fuel efficiency assumptions; waste stream assumptions will change with PEV market share projections, evolving battery chemistries, and used battery imports from other states. Using different PEV adoption assumptions could alter the total battery mass generated and the spatial distribution, thus affecting the optimal facility locations, transportation distances, and overall environmental impacts. In determining optimal recycling facility locations, our scope was limited to a single centralized facility. This was based on the decision to assess pyrometallurgy as the primary recycling technology, where facility costs are capital-intensive but the recycling of many LIB chemistries is possible within a single facility. A decentralized recycling approach, with several smaller facilities, would generate different optimal locations, and would be a valuable extension of this study in the future.
This study presents a modeling framework to quantify the environmental and economic implications of the expansion of the supporting infrastructure network for PEV LIB end-of-life management, based on integration of LCA, supply chain optimization, and transportation logistics. We find that incorporating recycling technologies and utilizing multimodal transportation in the supporting supply chain is crucial in reducing virgin LIB production burdens. The potential for LIB use in second life applications, after retirement from vehicles but before recycling, could further reduce this burden while adding the opportunity for full energy and emission payback in offsetting fossil fuel use. This use will only increase the value of LIBs and subsequently the need for end-of-life efficiency and an optimized supply chain network.
Acknowledgments
We would also like to thank Jeffery Greenblatt, Arpad Horvath, Tom McKone, Venkat Srinivasan, Mark Caffarey, Brad Smith, and Dirk Spiers for their advice and guidance. The Lawrence Berkeley National Laboratory, 1 Cyclotron Road, Berkeley, California 94720 is a national laboratory of the DOE managed by Lawrence Berkeley National Laboratory for the US Department of Energy under Contract Number DE-AC02-05CH11231. This report was prepared as an account of work sponsored by the California Energy Commission (CEC) and pursuant to an M&O Contract with the United States Department of Energy (DOE). Neither Lawrence Berkeley National Laboratory nor the DOE, nor the CEC, nor any of their employees, contractors, or subcontractors, makes any warranty, express or implied, or assumes any legal liability or responsibility for the accuracy, completeness, or usefulness of any information, apparatus, product, or process disclosed or represents that its use would not infringe on privately owned rights. Reference herein to any specific commercial product, process, or service by trade name, trademark, manufacturer, or otherwise, does not necessarily constitute or imply its endorsement, recommendation, or favoring by Lawrence Berkeley National Laboratory or the DOE, or the CEC. The views and opinions of authors expressed herein do not necessarily state or reflect those of Lawrence Berkeley National Laboratory, the DOE, or the CEC, or any of their employees, or the Government, or any agency thereof, or the State of California. This report has not been approved or disapproved by Lawrence Berkeley National Laboratory, the DOE, or the CEC, nor has Lawrence Berkeley National Laboratory, the DOE, or the Sponsor passed upon the accuracy or adequacy of the information in this report.