
Abstract
Natural substrates like sand, soil, leaf litter and snow vary widely in penetration resistance. To search for principles of appendage design in robots and animals that permit high performance on such flowable ground, we developed a ground control technique by which the penetration resistance of a dry granular substrate could be widely and rapidly varied. The approach was embodied in a device consisting of an air fluidized bed trackway in which a gentle upward flow of air through the granular material resulted in a decreased penetration resistance. As the volumetric air flow,  , increased to the fluidization transition, the penetration resistance decreased to zero. Using a bio-inspired hexapedal robot as a physical model, we systematically studied how locomotor performance (average forward speed,
  ) varied with ground penetration resistance and robot leg frequency. Average robot speed decreased with increasing
  , and decreased more rapidly for increasing leg frequency,
  . A universal scaling model revealed that the leg penetration ratio (foot pressure relative to penetration force per unit area per depth and leg length) determined
  for all ground penetration resistances and robot leg frequencies. To extend our result to include continuous variation of locomotor foot pressure, we used a resistive force theory based terradynamic approach to perform numerical simulations. The terradynamic model successfully predicted locomotor performance for low resistance granular states. Despite variation in morphology and gait, the performance of running lizards, geckos and crabs on flowable ground was also influenced by the leg penetration ratio. In summary, appendage designs which reduce foot pressure can passively maintain minimal leg penetration ratio as the ground weakens, and consequently permits maintenance of effective locomotion over a range of terradynamically challenging surfaces.
Export citation and abstract BibTeX RIS

Content from this work may be used under the terms of the Creative Commons Attribution 3.0 licence. Any further distribution of this work must maintain attribution to the author(s) and the title of the work, journal citation and DOI.
List of symbols
| q | superficial air flow speed |

|
volumetric air flow rate |
| Q0 | onset of fluidization |
| vx | average forward speed |

|
dimensionless average forward speed |
| ϕ | volume fraction |
| ω | angular leg frequency |
| Fz | vertical penetration force |
| d | penetration depth |

|
dimensionless penetration depth |
| k | penetration resistance |
| α | penetration resistance per unit area |

|
penetration resistance per unit area without air flow |
| R | SandBot leg radius |
| w | SandBot leg width |
| h | SandBot hip height |
| s | stride length |
| P | foot pressure |
| A | projected area of an intruder or a locomotor foot/leg |
| n | number of legs used per alternating gait |
| a | acceleration |
| m | mass |
| g | acceleration due to gravity |
| l | effective locomotor leg length |

|
critical leg penetration resistance |
| γ | performance loss rate |
| β | stretching parameter |

|
normalized critical flow rate |
1. Introduction
Legged locomotor performance depends sensitively on substrate properties, locomotor morphology and gait. Deformable substrates like loose sand, new snow, mud, and leaf litter can be particularly challenging due to their low penetration resistance, which we define here as the vertical ground resistance force per depth during intrusion. During interaction, such substrates can yield and flow, producing complex and dynamic interactions that can result in poor locomotor performance. Despite the ubiquity of such interactions, general biological principles linking appendage morphology and performance are unknown.
However, there have been a number of studies in recent years which demonstrate the importance of limb-substrate interaction on such surfaces. For example, Lejeune et al concluded that humans use  more energy running on deformable and dissipative substrates like sand compared to rigid ground due to an increase in the work done on the ground and a decrease in muscle-tendon efficiency [1]. Pandolf et al investigated the metabolic energy expenditure for human walking on snow, and found that energy expenditure increased linearly with increasing depth of the footprint depression [2]. For non-human locomotors, Li et al found that the elongated hind foot of the zebra-tailed lizard, Callisaurus draconoides, functioned as an energy-saving spring on solid ground, but on yielding sand, the foot acted as a force-generating paddle [3]. It was also suggested in [3] that for a given animal, larger foot area reduces energy loss to yielding granular substrates. Irschick and Jayne [4] tested two sand lizards species, Uma Scoparia and C. draconoides, on a sand-covered trackway, and examined how body posture, hindlimb kinematics related to their sprinting performance for different surface inclinations. Korff et al [5] further compared the sprinting performance of U. Scoparia and C. draconoides in their natural habitat substrates, dune and wash sand, and investigated whether habitat distribution and the presence of toe fringes contributed to performance differences. These studies provide a better understanding of how morphology and kinematics can contribute to locomotor performance on flowable ground, but the substrate resistances were not systematically varied. Further, locomotor responses to low resistance flowable substrates were not explored.
Studying how biological and robotic locomotors respond to low penetration resistance substrates can provide insights into the function of morphological features of animal feet, facilitate robot appendage design and improve the terradynamic performance of robots on challenging terrains. We suspect that foot penetration depth, foot size and limb length play important roles in determining locomotor performance on flowable ground, and we investigate these parameters here by studying the locomotion of a bio-inspired robot as a simplified model locomotor. Robots are increasingly used as physical models to systematically vary morphological and kinematic parameters and to test biological hypotheses on granular media. For example, Li et al used a bio-inspired hexapedal robot as a model legged locomotor on granular media, and found that the robot exploited the solid-like response of granular media and advanced via a kinematic form of walking [6]. Using an undulating sandfish-inspired robot, Maladen et al demonstrated that the desert-dwelling sandfish lizard (Scincus scincus) swam within sand with optimal wave efficiency [7]. With a turtle-inspired robot named FlipperBot, Mazouchova et al [8] discovered that a free wrist joint kept the stress applied by the flipper below the substrate yield stress and allowed FlipperBot to advance its body kinematically with minimal appendage slip. Using an undulatory snake inspired robot, Marvi et al [9] revealed that sidewinding snakes control ground contact length to reduce ground shear stress and avoid slipping when ascending granular inclines.
There are many challenges associated with studying locomotion on flowable ground and discovering the principles by which effective movement is achieved. One challenge is that deformable terrain comes in a staggering variety of forms, making exhaustive locomotion testing on each substrate impossible. Single-wheel testbeds with granular material such as Mojave Martian Simulant [10], quartz sand, and Ottawa sand [11] have been used for robotic vehicle motion testing studies. Most of these studies measured ground properties to analyze wheel-ground interaction, but few systematically controlled and varied the ground properties, especially for low penetration resistance ground. In a previous study [6] of locomotion on dry granular media, we used air pulses to control granular media compaction from closely to loosely packed. The associated volume fractions  (the ratio of solid grain volume to occupied volume) varied from 0.62 to 0.58 respectively, with corresponding average penetration resistances per unit area of 1.6 to
  (note that air flow was off during locomotion tests in these studies). However, ground penetration resistance varies more widely in terrestrial environments, and terrain like leaf litter or snow can exhibit even lower penetration resistances than can be achieved in loose packing of model laboratory materials. For example, snowpacks can have a minimum penetration resistance per unit area of
  [12], which is below the limit of the loose compaction state in dry granular media like sand. New ground control techniques are needed to achieve such low resistance states.
Another challenge in the study of locomotion on flowable ground is the difficulty in modelling ground interactions that occur when locomotors move on yielding substrates. Researchers have traditionally used terramechanics [14, 15] approaches to understand the interactions between robot/vehicle wheels and deformable ground. The classical terramechanics method is based on flat-plate pressure-sinkage relations, which works well for large wheeled and tracked vehicles. However, for small scale locomotors and especially for locomotor appendages of complex geometry like robot/animal legs, classical terramechanics models are not sufficient to accurately describe leg-ground interactions [11]. Recently, a resistive force theory (RFT) based 'terradynamic' approach was developed to capture the performance of robots and animals on dry granular media. RFT was originally applied to motion in low Reynolds number viscous fluids [16] and was adapted in [7] to calculate granular reaction forces on objects moving in the horizontal plane. In [17] the RFT was extended to describe intrusion in the vertical plane, which is relevant for surface locomotion where the granular force on robot/animal limbs is calculated as a linear superposition of independent surface element forces.
In this paper, we apply a new approach that allows precise control and broad variation of ground penetration resistance using continuous upward air flow through a fluidized bed [13]. Using this technique, we systematically investigate the effects of ground strength on robot and animal locomotion performance over a range of penetration resistances, and find good agreement between the RFT-based terradynamic simulation and the robot experiment. To gain deeper insight, we develop a universal scaling model that successfully captures the kinematics of legged robot locomotion performance for low resistance granular states, and we show that our model can be further extended to explain locomotor performance of animals with more complex morphologies and gaits. Our ground control technique opens a new avenue for systematic study of the limits of animal and robot locomotor performance over a wide range of granular substrates, and the use of the RFT method allows us to achieve continuous variation of locomotor scaling parameters (mass, foot size, etc). Our approach facilitates extension of granular terradynamics to loose substrates of arbitrary ground stiffness, and advances our understanding of legged animal and robot locomotion on low resistance ground.
2. Materials and methods
Locomotor performance can be sensitive to the mechanical properties of the ground, which vary widely among different terrestrial environments. To systematically reproduce this wide range of ground properties for robot and animal testing, we utilized an air-fluidized granular trackway to precisely control the ground penetration resistance via continuous upward air flow. For different substrate properties, we performed robot and animal locomotion experiments, investigating the effects of morphology and kinematics on locomotor performance. We also conducted force measurements and modelling to analyze in detail the deformable substrate response during leg intrusion.
2.1. Fluidized bed trackway
To emulate natural terrains with low penetration resistance, we used a  long,
long,  wide fluidized bed trackway [6]. The trackway was filled with
  diameter poppy seeds, a model granular substrate, to a depth of
  (figure 1(A)). Four leaf blowers (Toro, Model No.
 , 300 liters per minute (LPM)) connected below the trackway forced a continuous flow of air through a porous flow distributer to evenly fluidize the granular substrate inside the trackway. The superficial speed of the air,
  , was measured by an anemometer (Omega Engineering, FMA-900) mounted
  above the granular surface and was controlled by varying the blower voltage.
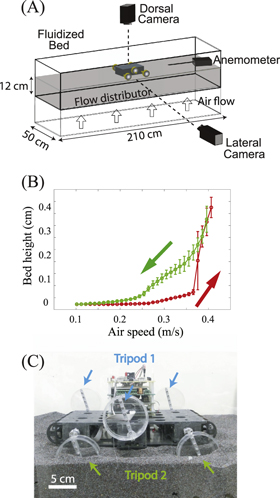
Figure 1. Apparatus to test principles of locomotion on flowable ground of different penetration resistance. (A) Diagram of the air-fluidized bed trackway for SandBot locomotion testing. (B) Bed height versus air flow speed,  . Red/green arrows indicate increasing/decreasing air flow. (C) SandBot, a small RHex-class hexapedal robot that uses a bio-inspired alternating tripod gait. Each tripod consists of three legs (the front and rear leg from one side and the middle leg from the other side) that move synchronously and π out of phase with the other tripod.
Download figure:
Standard image High-resolution imageUsing a camera that monitored the bed from the side through transparent walls, we characterized the height of the granular media as  varied from 0 to
  in increments of
  . A hysteresis curve (figure 1(B)) was observed during the fluidization and de-fluidization process, similar to other studies [13, 38, 39]. When the air flow initially increased (from 0 to the onset of fluidization), the normal forces between the granular particles were reduced, but the air pressure drop through the grains was smaller than the weight of the bed and thus the grains remained immobile. When the air speed exceeded the threshold of fluidization, the pressure drop reached the weight per unit area of the bed, and the granular medium exhibited fluid-like properties [18]. Due to the large horizontal extent of our fluidized bed, the flow distribution varied across the trackway: the 'onset' of fluidization from the bed height measurement ranged from
  to
to  . We also measured the onset of fluidization from penetration force measurements; this approach gave a more accurate value of
  . The hysteresis loop closed at
  , which coincided with the onset of bubbling [39]. During de-fluidization, the height of the granular media was greater than during fluidization (increasing air speed) at the same air speed.
We prepared the bed to the same initial packing state (the same initial height of granular media) before each test. To do so, we increased the air flow from 0 to  to fully fluidize the bed, and then decreased the air flow to zero at approximately
  , which left the material jammed [38] with the desired volume fraction of
  . Then we increased the air flow to the desired rate and maintained this fixed flow for the duration of the test. Using this method, we varied the ground penetration resistance from the loosely packed value (zero air flow) to zero (air flow at or above fluidization onset). The upward air flow through the granular media reduced the ground stiffness, but did not cause a significant lift force on the locomotors. Additionally, an air flow in the direction of gravity can produce penetration resistances greater than for the close packed compaction states reported previously [6]; we did not apply this technique in the current paper, but it could be of use for future studies which require stiffened substrates. In this study, we operated at flow rates below the bed fluidization transition so that the packing state remained constant (
 0.58).
2.2. Physical model—a legged robot
Interactions between locomotor appendages and flowable terrains are challenging to model. We used a bio-inspired hexapedal robot, SandBot (a small RHex class robot [19]) as a simplified physical model to study such interactions and to develop and test hypotheses. SandBot is a  , cockroach-inspired robot with six cylindrical legs (figure 1(C)). Each
  diameter cylindrical leg was attached to an axle at its circumference. Inspired by the alternating gaits of insects, SandBot's six legs function as two alternating tripods with the legs in each tripod rotating synchronously and with a half-cycle lag between the two tripods.
'Rotary walking' is a kinematic form of locomotion that can occur on granular media [6]. In rotary walking, robot legs penetrate the granular medium until the vertical ground reaction force matches the robot body weight plus the inertial forces required to accelerate the body. At this point the ground nearly solidifies and the legs rotate in place about their centers to propel the body forward. When ground penetration is large (weak ground or large inertial forces due to large stride frequency), SandBot's stride length decreases, its legs continuously encounter previously disturbed granular media, and it can no longer effectively perform rotary walking via ground solidification. In contrast, lightweight legged locomotors [20] can utilize the inertial response of the granular substrate to achieve high performance despite sustained ground fluidization during foot contact.
The locomotor performance of the SandBot can be optimized for different ground conditions by adjusting gait frequency and intra-cycle timing parameters [21]. To analyze the effects of robot foot size and leg frequency on locomotor performance, we set the robot's intra-cycle timing parameters to the soft ground kinematics (SGK) values; these parameters produced effective legged locomotion on granular media [21]. In SandBot limb kinematics control, each leg rotation is composed of a fast phase and a slow phase. In SGK, the angular extent of the slow phase was set to be at 1.5 rad with its center at −0.5 rad (leg angles are measured clockwise about the axle and between the downward vertical and a diameter through the axle), and the duty cycle of the slow phase (i.e. fraction of the period spent in the slow phase) was set to 50% [21]. Two different widths of cylindrical legs ( and
and  ) were tested, and we varied cycle-averaged leg,
  , frequencies between
  and
and  . We chose cylindrical legs because their geometric symmetry facilitated theoretical modelling of leg-ground interaction. Also, compared to the robot with
  wide C-shaped legs (C-legs) used in our previous study [21], the wider cylindrical legs enabled the robot to move effectively over an extended range of air speed, up to
  , making it possible to test the general trend of robot performance across a wider range of substrate penetration resistances.
Robot kinematics were captured by two high speed video cameras (AOS X-PRI) mounted on the side and above the trackway, respectively. We recorded robot movement at 100 or 200 frames per second (FPS) for the  wide leg and at 80 FPS for the
  wide leg.
2.3. Penetration test apparatus
To quantify the penetration resistance of the granular states generated by the air-fluidized bed trackway, we performed vertical penetration force measurements [22] (figure 2(A)) in a  long, and
  wide fluidized bed. The depth of the bed was
  , sufficiently deep compared to the robot leg diameter (
 ) to avoid bottom boundary effects [23]. During each penetration test, a single SandBot cylindrical leg (
 radius,
  ) was pushed into the poppy seeds by a linear motor actuator (Dunkermotoren ServoTube STA11), and the intrusion force was obtained from the motor current, whose linear relationship to the force was calibrated using a dynamic compression load cell (OMEGA DLC101-50).
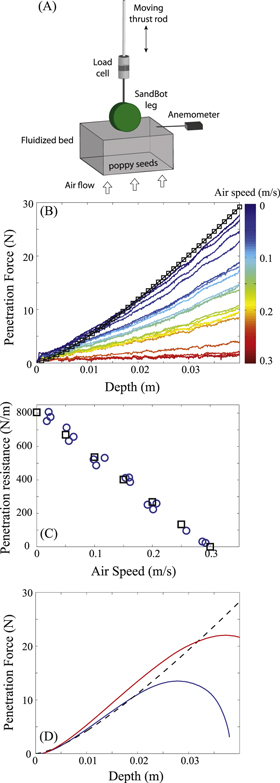
Figure 2. Experiment setup and force measurement for the penetration experiment. (A) Diagram of penetration experiment. (B) Vertical force on a  ,
,  SandBot cylindrical leg versus depth during penetration of
  diameter poppy seeds at various air fluidization speeds from 0 to
  . Colors represent air speeds. (C) Vertical penetration resistance, k, versus air flow speed,
  . Blue circles and black squares represent the slope of vertical force per unit depth from experiment and RFT simulation, respectively. (D) RFT simulated rotational penetration force,
  , versus depth. Red curve: axle height
  ; blue curve: axle height
  ; black curve is the force from vertical intrusion, for comparison.
Download figure:
Standard image High-resolution imageAs the cylindrical leg was pushed into the granular medium, forces acting on it were recorded as a function of its depth. Since lateral forces were negligible during vertical penetration, only the vertical force was analyzed. In our robot locomotion study, the leg penetration speed during most of the stride (slow cycle) was small enough ( ) that the effect of grain inertia was small and ground resistance force was insensitive to intrusion speed [24]. At low intrusion speed, the granular force exerted on the intruder is dominated by friction, and depends linearly on the penetration resistance of the granular media, k, the projected area of the intruder, A, and the penetration depth,
  [25]. Therefore, we performed ground penetration resistance measurements at a constant intrusion speed of
  .
.
2.4. Animals and locomotion protocol
We measured the average straight line running speed and limb kinematics of five different animals (figure 3(A)) for varying ground penetration resistance achieved using the same air-fluidized bed technique, which was parameterized by the volumetric flow rate,  . The volumetric flow rate was measured using a flowmeter connected in series between the compressed air source and the fluidized bed, and
  is proportional to the superficial air speed through the fluidized bed. All five animals contend with low-resistance ground in their natural habitats: a desert dwelling generalist lizard, C. draconoides (N = 5, mass =
  grams, figure 3(A) blue label); a sand-specialist Mojave fringe-toed lizard, U. scoparia (N = 5, mass =
  grams, red label); an arboreal and ground dwelling gecko, Pachydactylus bibroni (N = 5, mass =
  grams, purple label); a generalist lizard, Sceloporus olivaceus (N = 4, mass =
  grams, green label); and the fastest land invertebrate, the sand-specialist ghost crab, Ocypode quadrata (N = 3, mass =
  grams, black label).
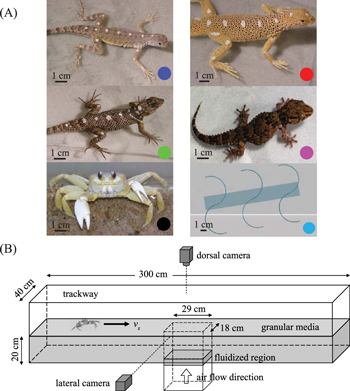
Figure 3. Small locomotors tested on granular media of different penetration resistance. (A) Five organisms studied in experiment (colored circles indicate corresponding symbols in figures 8–11)—Callisaurus draconoides (blue), Uma scoparia (red), Sceloporus olivaceus (green), Pachydactylus bibroni (purple), Ocypode quadrata (black), and the Xplorer robot (cyan) studied in simulation. (B) The trackway for the animal experiments contained a fluidized bed in the center, which was used to vary the penetration resistance of the granular medium ( diameter glass particles).
Download figure:
Standard image High-resolution imageWe tested all animals in a longer  by
by  wide trackway (figure 3(B)) filled with small glass spheres (mean ± s.d. diameter =
  ) to a depth of
  . We maintained the temperature of the trackway between 35 and
  . The center section of the trackway (
 long ×
 wide) was a fluidized bed which allowed local control of the ground penetration resistance by application of upward air flow like in the robot trackway. The onset of fluidization for
  diameter glass beads occurred at
  LPM. We also measured locomotor performance on a rigid substrate (labeled 'hard' and made of a rigid board covered by fine grit sandpaper) and a closely packed granular bed (labeled 'CP' and with
  ) as controls.
For all animal tests, we recorded synchronized videos using two cameras positioned for dorsal and lateral views. The lateral camera recorded the foot kinematics, and from the dorsal video we tracked circular reference markers placed on the dorsal surface of the animal to obtain the velocity of the estimated center of mass (CoM) as the animal crossed the fluidized section. To enhance accuracy in performance comparison of average speed, we accepted trials that met the following criteria. Animals had masses between 5 and 40 grams and ran across the trackway without contacting sidewalls or stopping in the fluidized section. With these criteria, we collected 334 trials with at least three runs per individual per granular state.
We used analysis of variance (ANOVA) and analysis of co-variance (ANCOVA) for statistical analysis. We used  honestly significant difference (HSD) test for post hoc testing as needed. All statistical tests were performed using JMP (SAS Institute, Cary, NC, USA).
2.5. Numerical simulation
We used an experimentally validated terradynamics model of the granular medium [17] to study the penetration resistance and the locomotor performance of SandBot. The terradynamic simulation model is based on the RFT. By assuming that the frictional granular force on intruders is a linear superposition of independent surface element forces (figure 4(B)), we can compute the net intruding force for complex geometries like limbs. We did not attempt to simulate the complex morphologies and gaits of all organisms, but instead searched for general principles that governed legged locomotion on flowable substrates. To facilitate comparison among small-scale runners, we also simulated the locomotor performance of a small ( long), lightweight (
 g in simulation) robot, Xplorer (equipped with
  radius,
  wide C-legs [17], figure 3(A)). The simulated Xplorer robot used the same alternating tripod gait as SandBot, but is similar in size to the animals tested in this study. Since the dynamics of Xplorer were successfully modelled using RFT in [17], only simulations ('virtual' experiments) of its performance were performed here.
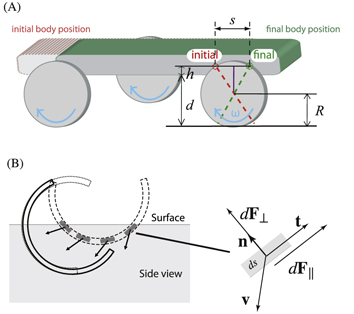
Figure 4. Diagrams of models discussed in the text. (A) Rotary-walking model [6].  is the radius of the cylindrical legs,
  is the stride length (forward displacement per cycle),
  is the penetration depth and
  is the hip height. The red circle indicates the axle position at the onset of rotary walking, the green circle indicates axle positions at the end of rotary walking. (B) Resistive force theory (RFT) 'terradynamics' [17] schematic for legged locomotion in the vertical plane. The leading surface of the leg is decomposed into small flat-plate segments. The forces
  on each infinitesimal segment ds is determined from its normal direction
  (or tangential direction
  ) and velocity
  .
.
Download figure:
Standard image High-resolution image3. Results and discussion
Using continuous air flow, we varied the ground resistance per unit area from 0 to  , and systematically tested SandBot and animal locomotor performance as a function of ground penetration resistance. We characterize the effect of leg frequency and foot size on locomotor performance, and develop a theoretical model that captures normalized locomotor speed on low resistance ground regardless of variation in morphology and gait.
3.1. Ground penetration resistance
The measured vertical penetration force,  , as a function of the penetration depth, d, (defined as the vertical distance from the granular surface to the lowest point on the cylinder) is plotted for various air flow speeds (figure 2(B)). For all
  ,
,  increased superlinearly for small depth (
 ) in part due to the increasing projected area of the cylinder in contact with the substrate. For
  ,
,  increased linearly with
  . Therefore, linear regressions were performed for
  to obtain the penetration resistance, k, which is defined as the slope of the linear fit
  . The penetration resistance measured in experiment (figure 2(C), circles) decreased linearly with increased air flow speed, and this dependence was repeatable. At
  the air speed reached the onset of fluidization, and ground resistance was zero for larger flow rates.
We also characterized the penetration resistance in simulation. We first validated the RFT using the vertical penetration force as the SandBot leg was vertically pushed into the granular media at  . Since the ground resistance decreased linearly with the air speed in our experiments, we modeled the air flow effect with a single scaling factor:
where  is the slope from the linear regression of the experimental penetration resistance versus air speed data. The vertical penetration force from the RFT calculation (figure 2(C), squares) agreed well with the results from experiment.
Since the ground penetration resistance displays sensitive angular dependence [17] and SandBot's legs rotate into the granular media (instead of penetrating vertically) during locomotion, we also calculated the rotational penetration force, and used the effective penetration resistance (defined as  , where
  is the depth at which
  is maximum) in our theoretical model to predict robot locomotion performance. The rotational penetration force is defined as the granular resistance force exerted on the robot leg when it rotates in the granular medium about a fixed, horizontal axle. We calculated the rotational penetration force exerted on a cylindrical leg rotated about an axle at various fixed heights above the surface. Figure 2(D) shows the rotational penetration force for two different axle heights,
  (red curve) and
  (blue curve). The effective penetration resistance calculated from the rotational penetration was
  , significantly smaller compared to
  obtained from the vertical penetration measurements.
3.2. SandBot locomotion kinematics and performance
When moving on granular media, SandBot kinematics can be approximated by a rotary walking model [6] (figure 4(A)). The model assumes that each leg of a tripod equally supports one-third of SandBot's weight ( ) and interacts with the granular substrate as an isolated vertical intruder. The vertical penetration force in the model is assumed to be hydrostatic-like so that it increases proportionally with depth (i.e.,
  ). During locomotion, the tripod penetration depth is determined from the force balance
  , where
  is the contribution from the robot's inertia. The cylindrical leg stops translating at this depth and begins to rotate about its geometric center. The body is then propelled kinematically.
Our experiments revealed that SandBot's forward speed was sensitive to ground penetration resistance. At a fixed leg angular frequency,  , SandBot's average forward speed,
  , decreased with increased air flow (i.e., reduced ground resistance). At
  , when the air speed was low (
 , figure 5(A) top blue curve), SandBot's locomotor performance was relatively high with
  . Leg penetration depth
  (averaged over a tripod) was small (
 of the leg length/diameter), and the robot's ventral surface was above the granular surface during the entire stance. As
  increased and
  decreased, SandBot's locomotor performance decreased. At
  (figure 5(A), bottom purple curve),
  decreased by nearly a factor of
  to
to  . We observed that
  also increased to
  of the leg length
  , and the robot's ventral surface experienced drag during the entire locomotion trial. SandBot's acceleration became significantly smaller, indicating that leg generated thrust was only slightly greater than drag on SandBot's ventral surface.

Figure 5. Kinematics of SandBot locomotion on flowable ground with different  . (A) Speed versus time for different
  (blue:
  ; purple:
  ) at
) at  . (B) Average forward speed versus gait frequency for various
  (purple:
  ; yellow:
  ; green:
  ; red:
  ; black:
  ; blue:
  ; cyan:
  ).
).
Download figure:
Standard image High-resolution imageWe also noticed that when the penetration resistance was relatively high (figure 5(B), cyan and blue curves), SandBot's forward speed increased with increasing leg frequency, and the highest performance corresponded to the maximum leg frequency, similar to the rigid ground case. As the ground weakened with increased  (figure 5(B), black, red, green and yellow curves), average speed increased monotonically with leg frequency, but exhibited a sub-linear trend, and was significantly lower than for
  . For highly weakened ground (figure 5(B), purple curve), we observed a slight decrease in forward speed at the highest frequency (
 ).
).
To predict SandBot's speed on substrates with different penetration resistances, we used the RFT model [17], an approach that, when combined with the multibody dynamic solver MBDyn [26], predicted well the performance of the Xplorer robot [17]. We simulated SandBot using the parameters from the experiments (i.e., mass, leg geometry, SGK) and compared its performance directly with the experiments (figure 6). The model predictions for SandBot speed (curves) also agreed well with the experiments (symbols) for all tested leg frequencies and ground properties, even when the media was near the onset of fluidization ( ). The RFT predicts that when air speeds are low (
 )
)  does not vary significantly with increased
  . However, for
  the increased wheel sinkage reduced the step length, and the ventral surface of SandBot contacted the ground which caused increased frictional drag, resulting in significantly decreased
  .
.

Figure 6. SandBot average speed versus air speed (leg width  ). Symbols represent experimental data and curves represent RFT model prediction [17]. Colors indicate different angular leg frequencies.
Download figure:
Standard image High-resolution image3.3. Universal scaling
To generalize the locomotion model derived from SandBot to a larger variety of legged locomotors (e.g., different foot size, body weight, gait, etc), we plotted the dimensionless average forward speed measured in experiment( ) against the dimensionless leg penetration depth (
 , where
  is SandBot's effective leg length, i.e., the leg penetration depth when the ventral surface contacts the ground). All experimentally measured robot speeds for a wide range of ground penetration resistances, leg frequencies, and two foot widths collapsed to a single curve (figure 7, filled markers), suggesting a universal scaling of locomotor performance that primarily depends on the locomotor leg penetration depth (we will refer to this as the 'universal scaling model').

Figure 7. Universal scaling of SandBot performance. Dimensionless average forward speed versus dimensionless leg penetration depth. Filled markers are data from experiments for 4 gait frequencies, 2 foot sizes and 7 ground stiffnesses, and unfilled markers are from terradynamic simulations for 10 gait frequencies, 7 masses and 20 ground stiffnesses. Marker shape indicates gait frequency (square:  ; circle:
  ; pentagram:
  ; diamond:
  ; cross:
  ; plus sign:
  ; upward-pointing triangle:
  ; asterisk:
  ; left-pointing triangle:
  ; right-pointing triangle:
  ). Color indicates the ratio of body weight to foot size as shown in the colorbar. The body weight, foot size and ground stiffness are also implied through different leg penetration ratios. The rotary walking model prediction is the black dashed curve.
Download figure:
Standard image High-resolution imageThe experimentally validated terradynamics simulation, which facilitates rapid parameter variation, follows the same trend when plotted on the universal scaling curve (figure 7, unfilled markers). We further tested a wide range of masses (m = 0.5–4.7 kg) and leg angular frequencies (ω = 2–20 rad s−1) in simulation, and found that for a given leg frequency,  for all robot masses also collapsed to a single curve, indicating that the locomotion is primarily kinematic. For all leg frequencies, the locomotor performance of SandBot did not decrease significantly for
  (the 'insensitive region'). For
  the robot's performance decreased substantially with increased leg penetration depth (the 'sensitive region') due to drag of the ventral surface.
In the rotary walking model [6], the SandBot average speed is:

where  is the radius of the cylindrical leg, and
  is the hip height (the distance between the axle and the ventral surface). Although the rotary walking model prediction (figure 7 black dashed curve) did not quantitatively follow the experiment and simulation data—as expected due to its assumptions of vertical leg intrusion and hydrostatic ground response—the model did capture the same qualitative behavior. We also noticed that at large leg penetration ratios (
 ), the speed in the experimental data decreased more slowly compared to the RFT simulation which assumes a frictional resistive force. This is an indication of the effect of hydrodynamic ground response from leg-fluidized granular media [20].
The fact that  decreased more slowly for small
  and more rapidly for large
  for all data in figure 7 suggested that despite different body weights, foot sizes and gait frequencies, the robot speed decrease rate can be significantly reduced if the robot maintains a low leg penetration ratio to stay within the 'insensitive region'. In other words, with sufficiently large foot area or small body weight, the robot can be passively buffered to changes in substrate properties and maintain effective performance as the substrate weakens.
3.4. Testing principles of foot and leg function in biological systems
Given the ability of the universal scaling model to rationalize SandBot performance over a wide range of substrate conditions and the idea that small leg penetration ratio buffers the locomotor against changes in substrates, we hypothesized that this same kinematic locomotion principle could be extended to help understand the performance of biological locomotors that walk in a non-rotary manner.
3.4.1. Kinematics and locomotor performance of animals
As mentioned in section 2.4, we measured the average speed of C. draconoides, U. scoparia, P. bibroni, S. olivaceus, and O. quadrata as they crossed the fluidized section of the trackway. The measured speeds of the five animals are plotted in figure 8 for hard ground (sandpaper), closely packed granular medium (CP, volume fraction  ), loosely packed granular media (LP,
  = 0, volume fraction
  ), and granular states created by varying continuous air flow (0 to 200 LPM, normalized by the onset of fluidization at
  LPM) to the fluidized section of the trackway. We performed a two-factor ANOVA on velocity, with species and substrate state as fixed factors, and found both to be significant (Species:
  ,
,  0.0001; Substrate:
  ,
,  0.0001). Consequently, we explored the intricacies of the dataset with a series of ANOVAs and Tukey's HSD.

Figure 8. Average speed versus air flow rate for the organisms and Xplorer shown in figure 3(A) with the same color convention. The abscissa states are hard board (hard), glass beads closely packed (CP) to a high volume fraction ( ), glass beads in a loosely packed state (
 ) with an increasing flow rate Q from Q = 0 to
  LPM. The volume fraction remains fixed from Q = 0 to
  above which the system becomes fluidized. The plotted flow rate is normalized by the onset of fluidization
  LPM. At least three runs were taken per individual and granular state. Error bars indicate one standard deviation. Inset: normalized average speed versus normalized flow rate for five organisms (filled circles) and the slope for each curve (dashed lines).
Download figure:
Standard image High-resolution imageTukey's HSD post hoc test indicated that the generalists C. draconoides (ANOVA,  ), P. bibroni (ANOVA,
  ), and S. olivaceus (ANOVA,
  ) were all significantly faster on hard ground than on closely packed (
 ) granular media, while both sand specialists, U. scoparia (ANOVA,
  ) and O. quadrata (ANOVA,
  ) were not statistically different in speed on hard ground than on closely packed granular media. For air-fluidized granular media, we found that animal speed decreased with flow rate (ANCOVA,
  ), and the slope of speed decrease depended on the species (ANCOVA,
  ). Whereas C. draconoides showed no decrease in speed as the material weakened (ANOVA,
  ), all other animals showed a decrease in average speed as the substrate strength was reduced to the point where the ventral area of many of the animals contacted the surface. The speed decrease was significant for O. quadrata (ANOVA,
  ) and P. bibroni (ANOVA,
  ).
).
On hard ground, animals can store and return energy gravitationally (walking) or elastically (running). Pendulous energy exchange can save energy during walking, while, during running, loading and unloading of elastic elements can store and return energy, thus aiding speed and stability. On rigid substrates, limits to performance are entirely dictated by physiological limits, including the maximal force that can be applied by muscles to accelerate the body at each step, the operating speeds of muscle (leg frequency and swing and stance duration), and morphological features like leg and toe lengths [27, 28]. In our study, the speed of C. draconoides was nearly twice that of P. bibroni. This is in part due to the length of the leg and toes that contact the ground in a digitigrade posture and extend the stride length considerably. These effects appear most significant in C. draconoides which seems to 'spring' over curled toes [27, 28]. We observed that U. scoparia has difficulty running on hard ground, with frequent slips of its hind legs.
The situation is quite different during walking and running on deformable ground. When the ground becomes deformable and dissipative, energy [29] can be transferred to the movement of the ground and this can affect locomotor style and performance. Weyand [30] proposed that ground stiffness could account for running speed. Farley et al [31] systematically varied the stiffness of a rubber track and found that locomotors adjusted leg stiffness to maintain running performance for different substrate stiffness. Spence et al [32] investigated the kinematics of rapidly running insects on elastic surfaces, and found that they maintained forward speed by lowering the CoM towards the compliant surface and thereby increasing the period of double support. However, in these experiments the deformation of the substrate was relatively small compared to the leg length.
When moving on flowable granular substrates, small animals can penetrate a large fraction of their limbs and feet into the material at each step. After analyzing the C. draconoides foot kinematics, we observed that upon impact the hind foot vertically penetrated a small distance into the granular surface, then quickly stopped during the stance, at which point the animal began to rotate its ankle as the toes dug in the material, until the granular media reached a jammed state underneath the foot. The foot then withdrew from the granular substrate while the initially spread toes collapsed upon exit. This observation was consistent with a previous study on C. draconoides [3], which suggested that the larger hind foot of the C. draconoides reduced energy loss to the granular substrate. Consequently, we hypothesized that animals might actively modulate their gait frequencies to adapt to ground penetration resistance variation. However, the stride frequency on hard ground was  for all the lizards and
  for the crab O. quadrata. On the granular substrate, gait frequency of P. bibroni, U. scoparia and O. quadrata decreased as the ground strength decreased (i.e., increased
  ), whereas C. draconoides and S. olivaceus's frequency remained nearly constant. All animals had stance duty factors of approximately 0.5 on the granular substrate below onset of fluidization.
Therefore, although the active modulation of gait frequency could help the animals maintain effective locomotion on weakened granular ground, the kinematic data suggests that the variation in gait frequency is not sufficient to explain the measured changes in speed. In particular, C. draconoides maintained nearly constant speed for the full range of flowable ground ( from 0 to 1) without significant reduction in gait frequency. We speculate that in addition to the strategy of actively modulating their leg frequencies to achieve higher performance, there must also exist other mechanisms, like within-stride kinematics variation [21] or a 'passive control' mechanism that enables effective locomotion on weakened substrates with minimal active control. We focus on the latter here based on the results from our robot model—we hypothesize that animals with large feet can maintain a small leg penetration ratio and stay within the range where their performance is buffered to substrate stiffness changes, and therefore passively maintain effective locomotion as the ground weakens.
3.4.2. Performance loss
To test the passive control and buffering hypothesis, we normalized the speed for the five animals by their speed on loosely packed granular media ( ), and plotted the normalized speeds as a function of the normalized flow rate (flow rate normalized by the onset of fluidization). As seen in the inset of figure 8, there was a significant difference in the magnitude of speed decrease among different animals. To gain an intuitive sense of this difference, we compared the slope of the normalized speed versus normalized flow rate for the five animals and the SandBot of two different foot size, as a measure of performance loss (figure 9(A)).
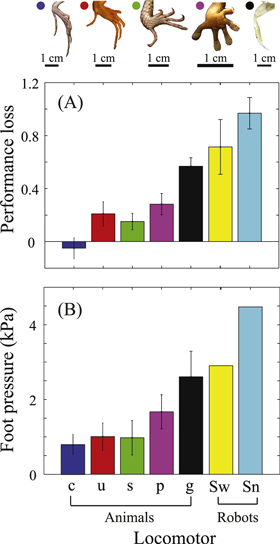
Figure 9. (A) Performance loss (i.e. the slope of normalized speed versus normalized flow rate from figure 8 inset) for the five animals: C. draconoides ('c'), U. scoparia ('u'), S. olivaceus ('s'), P. bibroni ('p'), O. quadrata ('g'), and the SandBot of two different foot size:  ('Sw') and
  ('Sn'). Color convention for animals is the same as in figure 3(A). For all locomotors, error bars of performance loss characterized standard deviation among different individuals and different trials, as well as standard deviation of the linear regression. For both SandBot foot sizes, error bars also include deviation of 4 different leg frequencies (
 to
to  ). (B) Foot pressure for the five animals and robots. The foot pressure of each locomotor was estimated using
  , where
  is the projected animal foot size determined by tracing around the perimeter of the foot and toes, and
  is the number of legs used per alternating gait (
 for C. draconoides, U. scoparia, S. olivaceus and P. bibroni,
  or 4 for O. quadrata (included in the error bars), and
  for SandBot). For all animals, error bars of foot pressure characterized deviation between individuals. Additional factors influenced the error bar size for some animals: for C. draconoides size difference between front foot and hind foot was considered; for P. bibroni changes in foot area between curled (
 ) and spread (
 ) were considered; for O. quadrata the deviation of mass distribution on the number of legs (3 and 4) used per alternating tripod was considered.
Download figure:
Standard image High-resolution imageLocomotor performance loss was strongly correlated with the foot pressure (figure 9(B)). C. draconoides had the smallest foot pressure and exhibited approximately zero loss of performance on the weakened ground. U. scoparia and S. olivaceus, with approximately twice the foot pressure compared to C. draconoides, had an  of performance when the ground was weakened from LP to the onset of fluidization. P. bibroni had more than a three-fold larger foot pressure relative to C. draconoides and exhibited a more pronounced performance loss of
  , whereas O. quadrata, with the greatest foot pressure, exhibited the highest performance loss of more than
  , which approached the performance loss of the robots. The SandBot with the larger foot size had a performance loss of
  , relatively lower compared to its smaller foot-size counterpart, which approached a total performance loss of
  before the onset of fluidization.
To test our hypothesis that larger foot size and light body weight could help locomotors reduce their performance loss rates by passively maintaining a small leg penetration ratio, we analyzed the relationship between normalized speed and leg penetration ratio for the five animals and the simulated Xplorer robot. The normalization factors for non-dimensional speed and leg penetration ratio were slightly different from figure 7 since the morphology and gaits of animals were more complicated and did not have explicit forms for parameters like  and
and  . Here the speed
  for all locomotors was normalized by their speed on loosely packed granular media (
 ), and the leg penetration ratio
  was calculated as the ratio of the leg penetration depth,
  , to the total leg length,
  . The leg penetration depth was obtained through vertical force balance
  , and the limb length
  was obtained from direct measurements (hip to ankle length for the lizards, and knee to dactyl tip length for the crab).
The plot of speed versus leg penetration ratio (figure 10) shows that, despite differences in gaits and foot morphologies, the speeds of all tested animals were also correlated with the leg penetration ratio, as predicted by the universal model derived from the SandBot data. Figure 10 also reveals that for all locomotors tested, performance was minimally affected when the leg penetration ratio  was small, but became sensitive to leg penetration ratio at larger
  . The performance decay rate increased for larger leg penetration ratio.
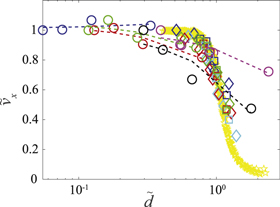
Figure 10. Normalized average speed versus leg penetration ratio for five organisms (circles); SandBot of 2 leg widths (diamonds:  ; squares: w =
  ), 4 different gait frequencies (blue:
  ; green:
  ; red:
  ; cyan:
  ) and 7 different air flow rates (
 between 0 and 0.64); and RFT terradynamic simulated Xplorer (yellow pentagrams) of 5 different masses between 40 and 90 g, 4 different gait frequencies between 2 and 8 Hz, and 20 different air flow rates (
 between 0 and 0.95). Dashed lines represent trend lines for each animal. Color convention for the five animals is the same as in figure 3(A).
Download figure:
Standard image High-resolution imageThis dependence of dimensionless speed on leg penetration ratio provide an explanation for the different speed decreases among the animals (figure 8 inset). As the figure 8 inset shows, the normalized speed of C. draconoides remained nearly constant as air flow rate increased. This is because with its large foot size and small body weight, the leg penetration ratio of C. draconoides was low for all ground stiffness tested ( ). Therefore, all C. draconoides' performance data (figure 10, blue circles and blue dashed trend line) were located within the insensitive region where performance was minimally affected by leg penetration ratio. S. olivaceus and U. scoparia, as seen from figure 8 inset, maintained a nearly constant normalized speed for small air flow (
 ) where the performance was insensitive to leg penetration ratio (figure 10, two leftmost green and red circles), but became significantly slower as the ground was further weakened and the leg penetration ratio increased beyond the critical value (figure 10, two rightmost green and red circles). Similarly, due to the large foot pressure, leg penetration ratios of P. bibroni, and O. quadrata were already relatively large (figure 10, purple and black circles and trend lines) and located within the sensitive region even without air flow; thus these two species exhibited significant performance loss as soon as the ground resistance began to decrease, and the average decay rates of performance loss were significantly higher compared to C. draconoides, S. olivaceus and U. Scoparia.
It is worth noting that although animals with larger foot pressures like the P. bibroni and the O. quadrata also exhibited significant performance drops for large leg penetration ratios (figure 10,  ), the rate of their performance loss at large penetration ratio was significantly smaller compared to the robots (i.e., SandBot and Xplorer). As seen from the inset of figure 8 and figure 10, animals can still maintain
  of their speed on fully fluidized ground, suggesting that they likely combine passive and active control to help maintain their locomotion performance on low stiffness substrates.
3.4.3. Critical flow rate analysis
To predict the effect of ground stiffness on locomotor performance, we now derive an expression for the critical flow rate (defined as the point at which the locomotor speed begins to be affected significantly by leg penetration ratio) from the universal scaling principle, and compare this flow rate to the measured values from the experiment and the RFT simulation.
Based on the rotary walking model, the leg penetration depth is given by force balance in the vertical direction:

where  is the flow dependent limb penetration resistance and nk is the total resistance for planted limbs in one step of an alternating gait. From the universal scaling shown in figure 7, non-dimensional SandBot speed began to decrease significantly with increasing leg penetration ratio at
  . In the
  limit, this gives the critical penetration resistance:

Since the penetration resistance is a linear function of the flow (figure 2):

where  is the normalized critical flow rate, from equations (4) and (5) we obtain:

For homogeneous granular media,  , and the ground resistance per unit area
  is independent of the geometry of the intruder. For loosely packed granular media with no air flow, k(0) = α0 A, and equation (6) can therefore be written as:

where  is the foot pressure (
 )
)
Equation (7) gives the theoretical prediction of the critical flow rate, which we compare to our experiment and simulation results. To obtain the critical flow rate from experiment and simulation, we fit the normalized locomotor speed versus normalized flow rate data (figure 10) using stretched exponentials:

where  is the normalized flow rate,
  the normalized CoM average speed, and
  the stretching parameter. The fitting parameter
  is between 2 and 3 for almost all trials and will not be discussed here.
  is the performance loss rate under the effect of air flow, and its inverse has a direct physical meaning:
  gives a normalized flow rate at which the speed has decreased significantly (to
  ). If our hypothesis is correct, the value of
  obtained from the data should be close to the critical flow predicted by equation (7).
Figure 11 is a plot of the critical flow as a function of foot pressure for all locomotors studied. The model-predicted critical flow rate for Xplorer (orange dashed curve) and SandBot (blue dashed curve) with negligible body inertia agree well with the  value obtained from both terradynamic calculation (top unfilled squares) and experimental data (top unfilled circles). Robots with increasing leg frequency and body inertia suffered significant performance loss at a smaller flow based on our model (top to bottom light blue dashed curves), which is consistent with the trend observed in our simulation (top to bottom markers).

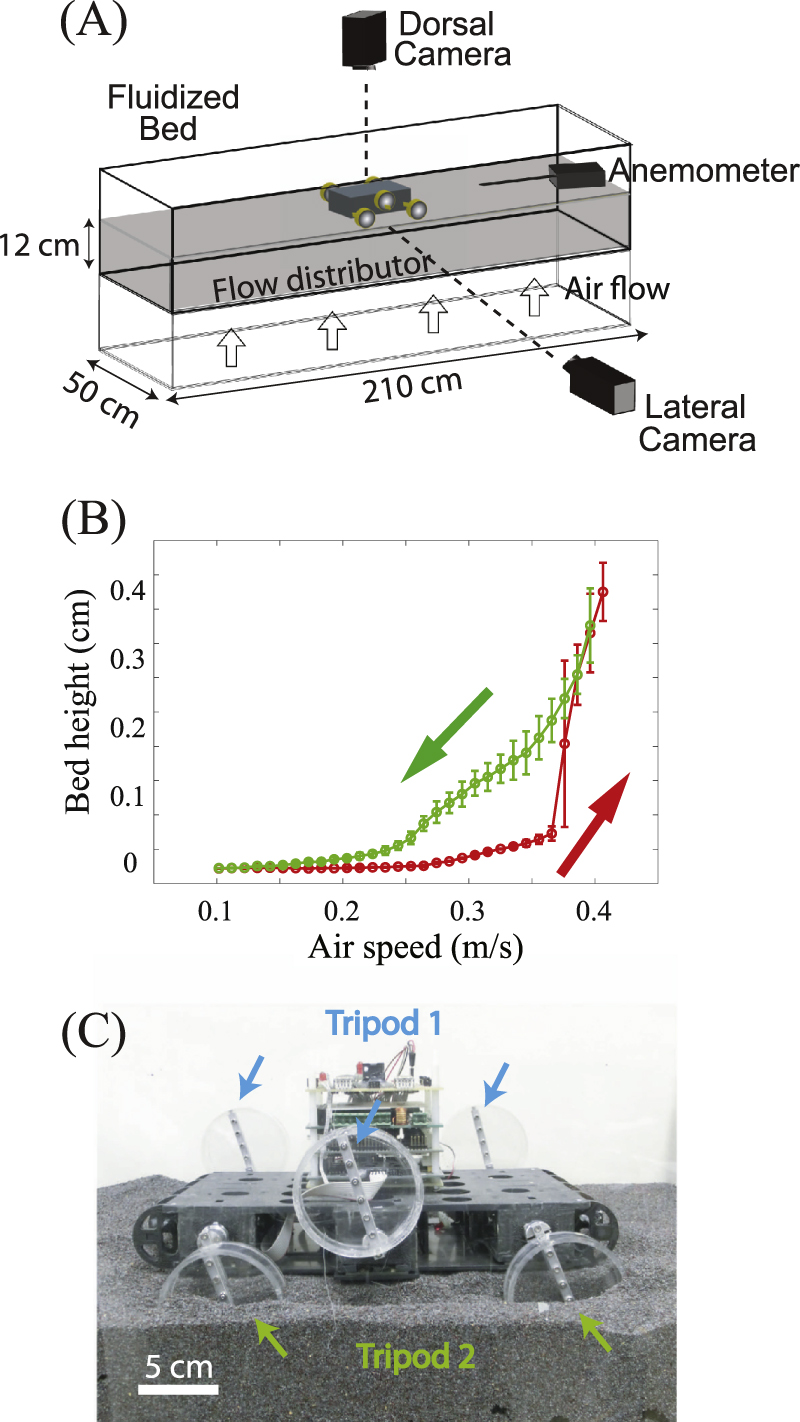
Figure 11. Normalized critical flow rate  versus foot pressure. Filled circles represent five animals (color convention is the same as in figure 3(A)). Yellow and cyan unfilled circles represent data from SandBot experiment for two foot sizes (yellow: SandBot wide leg,
  , 'Sw' in figure 9; cyan: SandBot narrow leg, w =
  , 'Sn' in figure 9; leg frequencies are 2, 4, 6 and
  from top to bottom markers for both foot sizes). Blue unfilled squares represent SandBot simulation (leg frequencies between 2 and
  ); Orange unfilled squares represent Xplorer simulation (leg frequencies between 2 and
  ). Top to bottom markers represent increasing body inertia. Blue and orange dashed curves represent model calculations for SandBot and Xplorer simulations with negligible body inertia, respectively. Top to bottom light-blue dashed curves represent model predictions for increasing SandBot body inertia.
Download figure:
Standard image High-resolution image
For animals, our critical flow model qualitatively captured the trend of their performance on low stiffness ground as well as how this trend was affected by foot pressure. Like the robot model, animal performance also depends sensitively on ground stiffness, and having a large foot and a light body (i.e., smaller foot pressure) can help a locomotor passively minimize leg penetration ratio and stay insensitive to ground stiffness change. Figure 11 reveals that animals with larger foot pressure also suffered significant performance loss at a smaller flow due to the increased sensitivity to ground stiffness change. However, our model did not capture the slower decay rate of animal performance at large leg penetration ratio (also noticeable in figure 10). According to our model, the normalized critical flow should always be less than 1, because at  (the onset of fluidization) the hydrostatic resistance of the ground decreases to zero, and locomotors would be unable to move forward if the ground reaction force was entirely due to the hydrostatic resistance [33] as the model assumes. However, the critical flow rates obtained from animal experiment were always greater than 1, which means animals can still manage to maintain relatively effective movement even on fully fluidized granular substrates with zero frictional resistance. Therefore, additional forces such as hydrodynamic granular response [20], or an added mass effect [34, 35], must enable the animals to maintain their locomotor performance in the 'granular fluid'.
4. Conclusion
We developed a technique to control ground penetration resistance over a wide range using a continuous upward air flow through a granular bed trackway. A penetration test verified that the granular substrate resistance created using this method was repeatable, and could be reduced below the loose compaction limit and reach zero frictional resistance upon the onset of fluidization. This new ground control technique makes it possible to emulate a wide variety of natural complex terrains for locomotion studies and is especially useful in testing robot and animal locomotor limits and preparing robots for challenging environments.
Using a legged robot, SandBot, as a physical model, we systematically studied how substrate properties, limb kinematics and foot size affected locomotor performance on low resistance granular ground. A RFT based terradynamics simulation previously developed for GM with zero air flow successfully captured locomotor performance for all low resistance granular states with  . From experiment and simulation, we developed a universal scaling model which suggested that robot speed was primarily determined by the leg penetration ratio. Further locomotion experiments in five animals indicated that this principle, derived from SandBot, can be generalized to locomotors with different leg morphology and kinematics. Analysis of animal foot pressure pointed to surprising similarities in the mechanisms used by a diversity of biological locomotors to maintain performance as the substrate property varies. Comparison of the biological data with the scaling model further revealed that locomotors with small foot pressure can passively minimize their leg penetration ratio as ground was weakened, and therefore maintain relatively effective performance on low resistance ground. Quantitative characterization of the critical flow rate for both robots and animals also suggests that animals likely combine passive and active control to achieve greater effectiveness on flowable substrates.
There are at least two important immediate avenues which could yield benefits to help generalize and explain our results. The first is that (as noted) there are certain aspects of the animal performance that cannot be explained using our model. We expect these are related to the vastly more complicated morphological and control elements employed by animals. As a first step toward understanding how these play a role, future studies should examine muscle activity in the limbs [36] to look for neuro-mechanical control principles and how they can help animals take advantage of the frictional and hydrodynamic [20, 35] aspects of material response. The second avenue involves changes in particle shape and heterogeneity. Our study used model granular substrates, which were more regular in shape compared to natural substrates, to facilitate comparison between experimental results and numerical simulations. But as previously measured in intrusion tests, these model granular substrates behaved similarly to natural sand (with greater polydispersity and angularity of grains) [17]. We therefore expect that the results obtained using model granular substrates can be applied to more complex flowable terrains. Regarding substrate heterogeneity, we expect our recent robotic studies of locomotion in granular 'boulder fields' [37] can provide hypotheses for templates for locomotion control when feet encounter large asperities, which are common in natural environments.
Acknowledgments
We thank Madalyn Berns, Michael Wehner, Loretta K Lau and Jeffrey Shen for help with data collection. We thank Andrei Savu and Nick Gravish for help with the apparatus setup. We thank Daniel E Koditschek and Haldun Komsuoglu for their support in the SandBot experiments. We thank Jeffery Aguilar for help with penetration force measurements. We thank Chen Li for helpful discussion. Lizards used in this study were collected under National Park Service permit no. MOJA-2002-SCI-0017 and CA Fish and Game permit no.801100-01. W L K was supported by the NSF DDIG (IBN-0309307). This research was supported by the Burroughs Wellcome Fund (DIG) and by the Army Research Laboratory (ARL) Micro Autonomous Systems and Technology (MAST) Collaborative Technology Alliance (CTA) under cooperative agreement number W911NF-08-2-0004 (DIG and RJF). DIG thanks NSF Physics of Living Systems CAREER and Student Research Network and ARO Grant No. W911NF-11-1-0514.