

Abstract
Fishes are found in a great variety of body forms with tail shapes that vary from forked tuna-like tails to the square-shaped tails found in some deep-bodied species. Hydrodynamic theory suggests that a fish's body and tail shape affects undulatory swimming performance. For example, a narrow caudal peduncle is believed to reduce drag, and a tuna-like tail to increase thrust. Despite the prevalence of these assertions, there is no experimental verification of the hydrodynamic mechanisms that may confer advantages on specific forms. Here, we use a mechanically-actuated flapping foil model to study how two aspects of shape, caudal peduncle depth and presence or absence of a forked caudal fin, may affect different aspects of swimming performance. Four different foil shapes were each made of plastics of three different flexural stiffnesses, permitting us to study how shape might interact with stiffness to produce swimming performance. For each foil, we measured the self-propelling swimming speed. In addition, we measured the forces, torques, cost of transport and power coefficient of each foil swimming at its self-propelling speed. There was no single 'optimal' foil exhibiting the highest performance in all metrics, and for almost all measures of swimming performance, foil shape and flexural stiffness interacted in complicated ways. Particle image velocimetry of several foils suggested that stiffness might affect the relative phasing of the body trailing edge and the caudal fin leading edge, changing the flow incident to the tail, and affecting hydrodynamics of the entire foil. The results of this study of a simplified model of fish body and tail morphology suggest that considerable caution should be used when inferring a swimming performance advantage from body and tail shape alone.
Export citation and abstract BibTeX RIS
1. Introduction
Fishes are remarkably versatile swimmers, exhibiting high performance in many different aspects of aquatic locomotion. Some species can migrate long distances, crossing oceans with limited fuel reserves, while others use rapid acceleration to catch prey. Still other species are able to maneuver through spatially complex habitats such as mangroves or coral reefs. Given this remarkable diversity of swimming behavior, it is hardly surprising that fish morphology is also highly varied. Body and tail shape are thought to be among the chief determinants of swimming performance, and particular shapes are thought to be advantageous for different swimming behaviors. Yet, surprisingly, controlled experimental investigations of the effects of body and tail shape on swimming performance are scarce.
Convergence of many distantly-related fishes on a small set of distinct body shapes raises the question of whether those shapes are advantageous for specific aspects of swimming performance—either by having the lowest cost of transport (CoT), the highest self-propelling speed, or the best maneuverability. For instance, several species of pelagic, highly-active cruising fishes have converged on a body plan with a narrow caudal peduncle (the region just in front of the tail where the body narrows) and a forked or semi-lunate tail. This suggests that such a body shape provides enhanced swimming economy, either by increasing thrust or reducing drag (Webb 1984, 1988, Wolfgang et al 1999, Blake et al 2009).
The proximate physical mechanisms by which body shape might confer a hydrodynamic advantage, however, remain uncertain. There are many covarying features of biological propulsors, such as their differing evolutionary history and physiology, that make it difficult to determine the specific effect of shape (as an isolated single factor) on performance using studies of living biological systems. Simple mechanical models, while not a replacement for direct study of biological phenomena, facilitate the reduction of such sources of unexplained variance, thereby allowing the researcher to draw more direct inferences about the effects of the variable in question on specific parameters of performance.
Several hydrodynamic theories suggest mechanisms by which narrow caudal peduncles and swept-back tails could enhance swimming performance. Most of these are motivated by slender-body theory (Lighthill 1975), which implies that undulating bodies exhibit an inherent tradeoff between thrust and drag: bodies and tails with large surface area have a greater ability to generate thrust, but in doing so, the large surface area incurs an energetic cost due to increased drag. Fusiform bodies reduce this drag cost, but stouter fishes typically have more muscle and surface area available for thrust production (Webb 1984). These theories remain limited by the extent of our knowledge of the hydrodynamics of bodies of varying stiffness, activation, and kinematics. Basic knowledge of these body-fluid interactions continues to grow, and computational fluid dynamic studies are beginning to fill this gap in knowledge (see, for example, Borazjani and Daghooghi 2013). While promising, these simulations must be tested and replicated in the real world (e.g. Borazjani et al 2012).
Tail structure and kinematics may also mitigate a fusiform body's theoretical low thrust production. Fish with fusiform bodies have long, narrow peduncles to separate the tail from the body. This narrowing means that, if all else were equal, a fusiform body could not shed as much energy into the wake as a stout body. However, the separation between the tail and body allows the tail to oscillate without resulting in energetically costly inertial recoil that would arise from high amplitude side-to-side oscillation of the body (Lighthill 1975, Lindsey 1978, Magnuson 1978, Webb 1992, Wolfgang et al 1999). A semi-lunate or forked tail may allow a fusiform body to produce high thrust by via the generation of leading edge suction (Chopra and Kambe 1977, Magnuson 1978, Karpouzian et al 1990). This mechanism has not yet been observed in live fishes, but is predicted by computational models of caudal fin kinematics (Borazjani and Daghooghi 2013) where a leading edge vortex (LEV) on the fish tail has been proposed to increase thrust.
Differences in fish body and tail shape also appear to be coupled with differences in body stiffness (Webb 1984). Thunniform and carangiform swimmers with their deep bodies, narrow caudal peduncles and semilunate tails appear to have stiffer bodies and tails than fishes with more generalized body shapes such as trout or bluegill sunfish (Webb 1984). The co-occurrence of particular shapes with particular stiffnesses will complicate attempts to determine experimentally in live fishes how shape and stiffness may interact during locomotion.
Recently, controlled studies using simple mechanical and robotic 'flapping foil' models have provided for the removal of these confounding factors, allowing the study of how fundamental physical traits affect swimming performance. The non-linear effects of traits such as stiffness and length on swimming of flexible foils or strip-like panels have been measured, as have resonant phenomena resulting from the foil-fluid interaction, and the effect of near-wall swimming and center of mass oscillations (Lauder et al 2011, 2012, Alben et al 2012, Dewey et al 2013, Wen and Lauder 2013, Shelton et al 2014, Quinn et al 2014a, 2014b).
These flapping-foil models may appear somewhat distant from the biological systems they attempt to emulate, but the ease of their control and manipulation makes it possible to address comparative and complex biological questions with targeted experiments (Lauder et al 2012, Shelton et al 2014). We use this framework here to focus on the specific question of how fish-like peduncle and tail shape may affect swimming performance in a simplified system. While the results of studies using this model system may not be directly applicable to biological fish swimming, they can shed light on causal hydrodynamic phenomena that would make particular shapes effective, suggesting further avenues for investigation in live fish systems. Using flexible flapping foils designed to span a range of observed fish peduncle and tail shapes and stiffnesses, and using foil materials that match the range of known fish body stiffnesses, we measured how differences in body and caudal fin shape affect swimming speed, hydrodynamics, and CoT. Using a mechanical controller, we were able to precisely control the leading edge motion of these flexible foil shapes, and to quantify the self-propelled swimming speeds of each shape and stiffness.
Following the hypotheses outlined by Webb and others (Lighthill 1975, Lindsey 1978, Magnuson 1978, Webb 1984, Borazjani and Sotiropoulos 2010), we hypothesized that foils with narrow caudal peduncles would be the most economical swimmers, while foils with deep peduncles might produce more thrust at greater energetic cost. In addition, we suspected that the presence of a forked tail in conjunction with a narrow peduncle might further increase thrust, without adding an offsetting economic cost. Stiffness was expected to interact with these effects by modulating the timing of interactions between the body trailing edge and the tail leading edge, and we expected that an intermediate stiffness would provide the most effective phasing of the body and tail and hence enhance thrust.
2. Materials and methods
2.1. Foil design and experimental setup
To model the effects of caudal peduncle depth and tail shape on swimming performance, we created four foil shapes each with either a narrow or a deep caudal peduncle, and a forked or unforked tail shape (figure 1). Foils were laser cut from three thicknesses/stiffnesses of plastic shim stock, and for ease of identification we refer to these by the color of the shim stock used as in our previous paper (Shelton et al 2014). Foil identification conventions and the flexural stiffness ranges of each foil are given in table 1. The flexural stiffness of the foils used here encompasses a wide range of the stiffnesses observed in real fishes (Lauder et al 2012, Shelton et al 2014). Long et al (2002) measured the stiffness of hagfish (Myxine glutinosa) bodies at a value of 3 × 10⁻⁴ N m2. McHenry et al (1995) derived flexural stiffness values for sunfish bodies of ∼1 × 10⁻³ N m2 near the head to 1 × 10⁻⁶ N m2 near the tail. Hereafter, specific foils are named by combining the first letter of the color of the material with the number of the foil shape as in table 1, e.g. C1 is the relatively inflexible coral-colored foil with a narrow peduncle and forked tail (figure 1, table 1).

Figure 1. Foil shapes and descriptive shape metrics. Units are as follows: area (cm2), aspect ratio (AR, unitless), shape-descriptor second moment of area (S, cm4). Identifying shape number is in large print on the foil 'tail'. Also see table 1 for details of foil properties, and for color codes that identify the material stiffnesses studied.
Download figure:
Standard image High-resolution imageTable 1. Foil name abbreviations, shapes, flexural stiffnesses, and color code used in this paper. See figure 1 for images of foil shapes. W indicates the white foil color, Y yellow, and C coral color. Color version is available online.
| Foil | Shape | Min EI (Pa*m4) | Max EI (Pa*m4) | Mass (g) | Color |
|---|---|---|---|---|---|
| W1 | 1 | 7.0*10−5 | 2.9*10−4 | 2.26 |

|
| W2 | 2 | 7.0*10−5 | 3.1*10−4 | 2.56 |

|
| W3 | 3 | 2.0*10−4 | 3.0*10−4 | 3.19 |

|
| W4 | 4 | 1.9*10−4 | 3.1*10−4 | 3.52 |

|
| Y1 | 1 | 5.0*10−4 | 2.1*10−3 | 5.72 |

|
| Y2 | 2 | 5.0*10−4 | 2.2*10−3 | 6.6 |

|
| Y3 | 3 | 1.4*10−3 | 2.2*10−3 | 8.02 |

|
| Y4 | 4 | 1.4*10−3 | 2.2*10−3 | 8.89 |

|
| C1 | 1 | 1.5*10−3 | 6.3*10−3 | 8.32 |

|
| C2 | 2 | 1.5*10−3 | 6.6*10−3 | 9.35 |

|
| C3 | 3 | 4.3*10−3 | 6.5*10−3 | 11.75 |

|
| C4 | 4 | 4.1*10−3 | 6.6*10−3 | 12.79 |

|
Foil body aspect ratio was calculated as follows:

where l is foil body length (18.5 cm), and A is the foil area.
We used a Riemann sum to approximate the second moment of area for each foil shape, as a shape metric, to describe the distribution of area along the foil. Briefly, each foil shape was divided into 37–0.5 cm thick trapezoidal segments from the anterior edge to the end of the foil (18.5 cm from the leading edge). For each foil segment, j, the average height was calculated. Each segment was then assumed to be a rectangle having width of 0.5 cm, and height equal to the average segment height. Using this approach, the shape-descriptor second moment of area of the foil with respect to the leading edge axis (S) was approximated as follows,

where rj is the distance from the centroid of foil segment j to the leading edge.
Foil flexural stiffness was calculated for the deepest and the narrowest point of the 'body' portion of the foil, the leading edge and the peduncle, respectively. Young's modulus (E) values for each of the three foil materials, white, yellow, and coral, were available from collaborators' earlier work (Quinn, personal communication; Quinn et al 2014a, 2014b). The second moment of area of the foil about the axis of foil bending (I) was calculated at each of the two locations as follows:

for a rectangular cross-section with neutral axis vertical through the centroid, where b is the foil thickness and h is the height of the foil at the location of interest. Note that this is an entirely separate calculation from that of S, which was used to describe the foil shape over the long axis. Flexural stiffness (EI) was calculated the product of E and I.
Foils were moved using a computer-controlled mechanical actuator designed to flap flexible foils in oncoming flow. This device is the same one used in our earlier research on aquatic propulsion (see Lauder et al 2011, 2012, Quinn et al 2014a, 2014b, Wen et al 2013, 2014). Each foil was clamped by a round shaft fitted with an ATI-Nano17 six-axis force–torque transducer (ATI Industrial Automation, Apex, NC, USA) at the leading edge, and attached to a carriage placed on a recirculating swimming flume. A custom LabVIEW program (National Instruments Corp., Austin, TX, USA) controlled a heave motor on the carriage, moving the shaft with ±1 cm sinusoidal heave at 2 Hz and 0° pitch. These parameters approximate the kinematics of the posterior body region of swimming fishes (Lauder and Madden 2006, Shelton et al 2014).
A second custom LabVIEW program monitored fore-aft forces as the foil was flapping. Flow speed was changed manually until the observed fore-aft forces were within 0.005 N of 0 N. The flow speed at which this occurred was recorded. This procedure was repeated seven times, the highest and lowest recorded speeds were removed, and the self-propelling speed was calculated as the mean average of the remaining five speeds recorded for each foil.
2.2. Force analysis
Ten flapping trials for each foil were performed at that foil's self-propelling speed. For each trial, heave-position, forces and torques were recorded continuously for ten seconds (e.g. figure 2). Fore-aft forces were filtered in IgorPro (Wavemetrics, Inc., Portland, OR, USA) using a custom narrow band-pass to remove 2 Hz noise that resulted from the imposed heave motion. The force in the fore-aft direction (Fx) was expected to have a dominant 4 Hz signal (i.e. twice the heave frequency) based on our previous work. All force and torque traces were smoothed for ease of analysis.
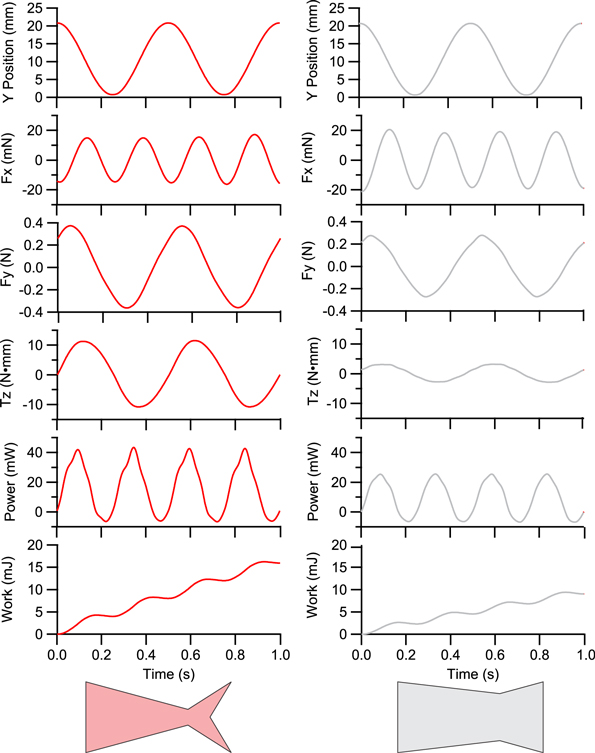
Figure 2. Representative force, torque, and calculated data from foils C1 (left) and W4 (right) when each is swimming at their self-propelled speed. Note that the swimming foils are self-propelling, and so the Fx curves average to zero over a cycle.
Download figure:
Standard image High-resolution imageA custom IgorPro program was written to calculate derived measures of performance from the original three-force axes (Fx, Fy, Fz), self-propulsion speed (Ueq), and foil heave position (Ypos). Foil power curves were calculated by multiplying the values of the instantaneous heave velocity and the force applied in the direction of the heave axis (Fy), as follows:

The net work done on the foil by the motor was calculated as the integral of the power curve,

The work per heave cycle (hereafter, 'work per cycle') was calculated by dividing the net work done over a 10 s trial by the number of cycles in that time period (20 cycles). The foil power coefficient was calculated following Read et al (2003), where ρ is the fluid density, c is the mean chord, and s is the mean span of the foil.

CoT was calculated in two ways. First, CoT was calculated as the net work done over the course of each 10 s trial divided by the total distance traveled (Ueq * 10 s). Then, mass-specific CoT was calculated by dividing the first measurement by the foil mass. Torque oscillation of the foil about the rod (Tz) was calculated as the average (Tmax – Tmin) for 20 heave cycles. This torque can be interpreted as the tendency for body and tail oscillation to cause a yawing moment at the anterior end of the foil.
2.3. Statistics
The Shapiro-Wilk W test for normality and Levene's test for homogeneity of variance were conducted in JMP Pro 9 (SAS Institute Inc., Cary, NC, USA). All metrics were heteroscedastic with non-normal distributions, so all data were transformed using an aligned-rank transform in ARTool v. 1.5.1 (Wobbrock et al 2011). Comparisons among foil shapes and stiffnesses were then conducted using two-way ANOVAs in JMP Pro 9, following the procedure detailed in Wobbrock et al (2011) (table 1). Significant differences were determined following a false detection rate correction, to reduce the chance of type I error from multiple testing, with a maximum allowable false detection rate of 5% (see Benjamini and Hochberg 1995).
2.4. Particle image velocimetry (PIV)
While flapping at the self-propelling speed, flow around foils was filmed in ventral view, via a 45° mirror, with a high speed camera (Photron PCI-1024; each frame with 1 megapixel resolution) at a frame rate of 1000 Hz. Near neutrally buoyant particles were illuminated using a Coherent 10 Watt laser, and analyzed using DaVis v. 7.2.2 (LaVision GmbH, Goettingen, GER) PIV software. The start of each flapping cycle was defined as when the leading edge was at its right-most lateral excursion. Still frames were taken when an visible trailing edge vortex was formed off the trailing edge of the foil 'body', and when that vortex had moved down the foil far enough to interact with flow at the 'tail' leading edge. For opaque flapping foils, the shadow of the foil blocked visualization of flow on the right side of the foil. For ease of interpretation, these unusable shadow areas were masked using CorelDRAW X5 (Corel Corp., Ottawa, CAN).
2.5. Midline kinematics
Midline envelopes were digitized from high-speed videos by tracing the foil midline every 0.125 s from the start of one flapping cycle to the start of the subsequent cycle, for a total of eight traces, using a custom MATLAB program (The MathWorks, Inc., Natick, MA, USA).
3. Results
3.1. Force and swimming speed
Swimming foils exhibited a sinusoidal thrust profile, with two thrust peaks for every foil oscillation cycle (figure 2). With every thrust peak, the foil power curve dips slightly negative, showing that for a brief period, the undulating foil is actually doing work on the rod, instead of the rod and motor working on the foil. Foils are self-propelling, and hence Fx averages to zero over a flapping cycle (figure 2).
There were significant interactions between shape and stiffness for every swimming performance metric measured except for the self-propelled swimming speed, Ueq (figure 3, table 2) for which the interaction term was not significant. Self-propelled swimming speed varied significantly with both foil shape and stiffness, with the yellow intermediate-stiffness foil in the Y4 (deep peduncle) shape exhibiting the fastest swimming speed overall. The stiffest (coral) foil material with the C3 and C4 shapes showed the slowest swimming speeds. For two of the three materials tested, white and coral, Ueq did not change substantially with shape (figure 3). For the medium-stiffness, yellow foils, it appeared that Ueq is highest in the foils with deep peduncles, and higher still in the deep-peduncle foil with an unforked tail (figure 3).
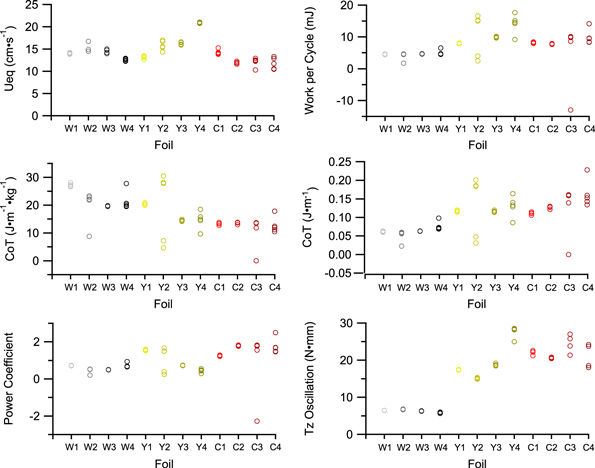
Figure 3. Swimming performance metrics for self-propelling foils. Raw data from each of the five trials per foil are shown. Points are translucent to show any overlap. Statistical analyses of these data are given in table 2.
Download figure:
Standard image High-resolution imageTable 2. Summary of two-way ANOVA on aligned ranks for four variables.
| Variables | Source of Variation | df | F-ratio | Prob. |
|---|---|---|---|---|
| Ueq | Shape | 3 | 35.60 | <0.0001* |
| Stiffness | 2 | 12.78 | 0.0007* | |
| Shape x stiffness | 6 | 0.016 | 0.8989 | |
| Mass-specific | Shape | 3 | 4.22 | 0.01a |
| COT | Stiffness | 2 | 31.07 | <0.0001a |
| Shape x stiffness | 6 | 4.49 | 0.0011a | |
| Power Coefficient | Shape | 3 | 5.03 | 0.0041a |
| Stiffness | 2 | 43.88 | <0.0001a | |
| Shape x stiffness | 6 | 11.52 | <0.0001a | |
| Tz Oscillation | Shape | 3 | 14.23 | <0.0001a |
| Stiffness | 2 | 81.25 | <0.0001a | |
| Shape x stiffness | 6 | 47.87 | <0.0001a |
aShows significance following false detection rate correction (after Benjamini and Hochberg 1995).
For all foils, the energy cost per heave cycle depended on foil material more than foil shape. The stiffest foils (coral) had higher energetic costs per heave cycle than the yellow foils, and the flexible white foils had the lowest costs per heave cycle. The CoT, however, exhibited opposite trends depending on whether or not mass was incorporated in to the calculation (figure 3; table 2). Coral foils exhibited the lowest mass-specific CoT, and the white foils had the highest mass-specific CoT, while the opposite was true when mass was not accounted for (figure 3; table 2). This discrepancy is the result of less-flexible coral foils being much heavier than the white flexible foils, while the yellow foils were of an intermediate mass.
The most flexible flapping foils tended to have similar power coefficients across all shapes. The power coefficients of the medium-stiffness yellow foils tended to be lower in shapes with greater surface area. The stiffest, coral foils, however, tended to have higher power coefficients with higher surface area.
Torque also varied with foil stiffness more than foil shape (figure 3). The coral foils all had similar, high torques, and the white foils had similar low torques. An interesting exception to this trend is foil Y4, the medium stiffness foil with a deep peduncle and an unforked tail. Y4 exhibited the highest torques of any foil, as well the highest Ueq.
There was considerable variance observed in the work, power, and CoT of some foils, particularly among the yellow and coral foils (figure 3). The force measurements used in the derivation of these values were very sensitive to small changes in the initial conditions, and the observed scatter may result from even minor variation in the forces measured from trial to trial. We have reported the raw data for these measures in order to accurately convey this scatter.
3.2. Midline kinematics
Foil kinematics vary considerably with both foil shape and foil material (figure 4). Material stiffness (table 1) governed the number of wavelengths on each foil, with the white foils exhibiting approximately 1.5 wavelengths, while the other materials only supported about 0.5 wavelengths. Shape, too, had an effect on midline kinematics, by modulating the lateral excursion of any particular point along the foil. For instance, foils with narrow peduncles tended to exhibit greater lateral excursion of the peduncle notch than foils with deep peduncles (figure 4). Interestingly, while shape did affect lateral excursion, it did not appear to change the position of nodes and antinodes along the body.

Figure 4. Midline envelopes showing the lateral (side-to-side) amplitude of foil motion along the length for self-propelling foils of different shapes and stiffnesses. Scale bar represents 5 cm for all foil shapes.
Download figure:
Standard image High-resolution image3.3. Flow visualization
PIV revealed that flow patterns at the peduncle notch of each foil varied considerably, while midline flow patterns were far more consistent across stiffnesses and shapes (figures 5 and 6). Of particular interest were flow patterns around the caudal peduncle (through the peduncle notch), where flow off the trailing edge of the upstream 'body' segment of the foil appeared to greatly modify the flow incident on the tail leading edge. For foils with narrow peduncles, in the plane of the peduncle notch, there was obvious flow through the gap between the body and the tail. This flow was not observed in the plane of the foil midline. Depending on the foil's shape and stiffness, flow through the peduncle notch could either increase the tail's effective angle of attack, or result in almost no flow immediately anterior to the tail (figures 5 and 6).

Figure 5. Flow visualization around self-propelling flexible, white foils, W1 (top panel) and W4 (bottom panel). The top row in each panel shows flow at the foil midline, the bottom row shows flow at the middle of the caudal 'notch'. Time is given as percent completion of one flap cycle, where 0% is at the lowest heave point. Times were chosen to show the appearance of a vortex at the trailing edge of the body (column 1), and the point at which that vortex reaches the fore-aft position of the tail leading edge (column 2). Vortices from the body trailing edge are indicated with white arrows. Scale bars represent 5 cm. Vorticity (blue, clockwise rotation; red, counterclockwise rotation) is also shown on each image. Color version is available online.
Download figure:
Standard image High-resolution image
Figure 6. Flow visualization around the stiff, coral foils, C1 (top panel) and C4 (bottom panel). The top row in each panel shows flow at the foil midline, the bottom row shows flow at the middle of the caudal 'notch'. Time is given as percent completion of one flap cycle, where 0% is at the lowest heave point. Times were chosen to show the appearance of a vortex at the trailing edge of the body (column 1), and the point at which that vortex reaches the fore-aft position of the tail leading edge (column 2). Vortices shed from the body or upstream trailing edge are indicated with white arrows, while bound vorticity on the tail leading edge is indicated with a hollow arrow. Scale bars represent 5 cm. Color version is available online.
Download figure:
Standard image High-resolution image
Phase differences between the body trailing edge and the tail leading edge were observed, and likely were caused by the interaction of tail shape and stiffness. These phase differences produced interesting changes in the flow incident on the tail as well—dictating whether or not flow off the body trailing edge would interact with the tail, or merely pass the tail by (figures 5 and 6). We noted the presence of a LEV on the tail leading edge of foil C1, a foil of the stiffest material with both a narrow peduncle and a tail fork, which appears to be a product of such a fluid-structure interaction (hollow arrow, figure 6). A bound LEV was not observed on any other foil.
4. Discussion
4.1. Propulsion of differently-shaped flexible foils
Fish tail fin shape and its impact on locomotor function has been the subject of research for more than a century (e.g., Ryder 1886, Breder 1926, Affleck 1950, Webb 1978). From observations of the evolutionary transition from heterocercal to homocercal tails and their potential for lift generation by the tail (Ryder 1886, Grove and Newell 1936) to early mechanical studies of tail function (Grove and Newell 1936, Affleck 1950), it was clear that tail shape has the potential to impact swimming performance. Using mechanical models to isolate the effects of particular shapes was an important first step, and the paper by Affleck (1950) is a classic in this regard. Although these early studies used stiff plates, and were largely qualitative, they proved that shape can exert a large influence on the forces experienced by a fish during undulatory swimming. A later study performed a more direct manipulation of fish tails—determining how partial amputation of the tail affected swimming performance (Webb 1973). These manipulations, however, appeared to have little effect on the swimming performance of trout with altered tails. More recent studies (e.g. Plaut 2000, Blake et al 2009, Law and Blake 1996, Webb and Fairchild 2001) have used natural variation in fish body and tail shapes and a comparative approach to investigate the effect of changes in fish morphology on locomotor performance.
Lauder et al (2012) summarized previous results obtained using the flapping foil apparatus used in this study, and showed differences in swimming performance between flexible foil models with different trailing-edge shapes. Their study, which employed several differently shaped foils, including a simple model of a homocercal (symmetrical tail) and another with a shark-like (asymmetrical) tail, demonstrated that 3D flow over the entire tail was more complicated than the section of flow observed in the plane of the foil midline. They also demonstrated that even simple changes in trailing edge shape could effect large changes in the forces produced by the foil (Lauder et al 2012). Subsequent work using this same flapping foil mechanism attempted to determine how length or stiffness alone affect swimming performance (Shelton et al 2014). Data from Alben et al (2012) suggest that specific combinations of foil length and stiffness can exhibit multiple performance optima. However, those experiments were conducted on rectangular foils, and did not include shape manipulations. The work of Dewey et al (2013) and Quinn et al (2014b) addressed the scaling of propulsion using flexible panels or foils, and focused on resonant effects and derivation of scaling laws. Resonant effects could certainly be relevant to the propulsion of the different tail shapes studied here, especially when comparing the similar shapes that differ in stiffness. However, given that we only studied one swimming speed (the self-propelled speed), it is difficult to ascribe any particular differences in swimming shapes among foils (figure 4) to a resonant effect. The question of how changing mass distribution along the foil length (figure 1) impacts resonant effects during locmotion is an intriguing one for future study.
One additional area to consider in flexible foil propulsion is the oscillation that would naturally occur in the center of mass if the foils were truly unconstrained to move freely in a fluid environment. Under the current experimental constraints, foils cannot oscillate in the upstream–downstream (x) direction as the heave motor constrains the leading edge to lateral motion only. In this study as in the other papers cited above, the swimming flexible foils do not exhibit unconstrained center of mass motion as observed in freely-swimming fishes (Xiong and Lauder 2014), and thus will show momentary small imbalances in the forces during propulsion. Wen and Lauder (2013) addressed this constraint by allowing controlled x-direction motion and varying the extent of this movement to determine the effect on thrust forces of center of mass motion. They found that reductions in the magnitude of thrust force oscillation could be achieved by allowing the swimming foils to oscillate axially during propulsion. This study is a continuation of this overall body of work on flexible panel propulsion, and we use controlled manipulations of a simple experimental model to remove confounding factors and ask a specific question: how might two aspects of shape, namely, the narrow caudal peduncle and the forked tail so often associated with economical cruising, affect swimming performance. The long-held hypothesis, largely based on hydrodynamic principle instead of experimental data, was that both a narrow peduncle and a forked tail would reduce swimming CoT. In particular, we expected the combination of narrow peduncle and forked tail to maintain high speed at a lower energetic cost (Brill 1996).
The results, however, do not agree with this simple assertion. The effects of both tail shape and tail stiffness interacted, such that it was difficult to predict any general performance difference between a deep peduncle and a narrow one, and between forked and unforked tails (figure 3, table 2). Even stiffness alone seemed to generate unexpected changes in foil swimming performance. Within any of the three given stiffnesses/materials, the effects of shape on performance were irregular. Z-torques increased as material flexural stiffness increased—the coral foils had the highest torques, and the white foils had the lowest (figure 3, table 2).
In sum, our results suggest that both shape and stiffness are important in determining the propulsive performance of undulating foils and that complex interactions between these two parameters occur.
4.2. Hydrodynamics of differently-shaped foils
PIV of the different foils complemented the performance measures in that flow, too, behaved in a complex manner depending on shape and stiffness. In particular, flow off the midline axis was highly variable, and provided new information about how the foil interacted with the surrounding fluid that is not captured in the plane of the midline. The off-midline flow was complex, especially in the region between the body and the tail parts of the foil due to the sharp edges encountered by the flow. This suggests that three-dimensional flow surrounding the tail is dependent on shape—especially that of the peduncle—and that studying midline flow alone fails to uncover much of the variation in the hydrodynamics of different shapes. This reinforces the views of Tytell et al (2008), and more recent studies taking advantage of volumetric PIV (Flammang et al 2011) and CFD (Borazjani and Daghooghi 2013): fishes and other flapping bodies with irregular shapes do not operate in flatland. Their moving, three-dimensional shapes influence hydrodynamic flow patterns significantly.
One way that shape and stiffness may be working in tandem to modulate performance is by altering kinematics, specifically, by modulating the phase relationship of the body and the tail (Lighthill 1970; figures 5 and 6). The presence of a body trailing edge and a tail leading edge, which varies with shape (figure 1), allows flow from the body to interact with or even dictate the flow incident on the tail. Body and tail flow interaction appears to be modulated by foil kinematics. For instance, with foil C1, the kinematics were such that the vorticity off the trailing edge of the body interacts with the leading edge of the tail, changing the tail's effective angle of attack (figure 6). In other foils, such as foil W4, the leading edge of the tail was nowhere near the vorticity shed by the body when that vorticity passed the tail (figure 5). Shape and stiffness thus interact to produce varying kinematics. The kinematics may be what ultimately drives swimming performance in these foils by altering the phasing of flows in the gap between the body and tail regions of the foils (also see Drucker and Lauder (2001), Akhtar et al (2007) and Standen and Lauder (2007) for discussion of flow interactions among fins in fishes). Indeed, the optimal kinematics (see Eloy 2013) for a given body shape vary considerably—even within the limitations of elongated-body theory. Taken as a whole, these results suggest that body-tail phase relationships may be a useful potential determinant of swimming performance.
The presence of a LEV on foil C1 is intriguing, given that leading edge vorticity is suspected to play a role in the presumed benefits of forked and semi-lunate tails (Chopra and Kambe 1977, Karpouzian et al 1990, Borazjani and Daghooghi 2013). This vortex appears to be the product of the effective angle of attack created by the interaction of vorticity off the body and on the tail, forming a weak, but discernable rearward jet (figure 6). A LEV on the foil tail surface may enhance propulsion via leading edge suction in the same manner suggested by Borazjani and Daghooghi (2013) in their computational fluid dynamic study of fish tail function. We note that foil C1 had a higher Ueq than the other foil shapes of the same material (figure 3). The placement of the bound LEV on foil C1 suggests that it would produce suction to pull the tail forwards and augment thrust. If that is the case, it suggests a narrow, stiff peduncle might be required for LEV thrust enhancement: the narrow peduncle to ensure a distinct body trailing edge and tail leading edge, and the stiffness to create the proper phase relationship between body and tail during undulatory propulsion. Whether this mechanism plays a role in fish swimming has yet to be determined for live fish, but remains a tantalizing possibility.
4.3. Implications for fish tail shape function
The foils used in this study are a simplified models of actual fish tails, and yet, even their performance appears to be dictated by a complex interaction of shape and stiffness. It was difficult to determine any predictive relationship between shape and performance, and there was no single shape or stiffness with the best performance for all performance metrics. The flow pattern produced by a given tail shape was governed by the interaction of the body and tail flows, suggesting that tail shapes cannot be studied in isolation of the body. Because the flow incident on the tail is in large part determined by the movement of the body in front of it, an isolated tail foil, without a body component, may not accurately model tail hydrodynamics in the freely-swimming fishes.
The foils used in this study are not intended to exactly replicate fish motion, but rather to investigate the complexity of shape as factor affecting undulatory locomotor dynamics, and suggest future avenues of research in biological systems of undulatory propulsion. The changes produced by varying shape of the foils—including the interaction of flow between anterior and posterior regions of the foils—suggest the possibility of similar interactions having a role in fish locomotion. A few notable studies have observed interactions among median fins in live fish similar to those of the foils in the present study (Drucker and Lauder 2001, Standen and Lauder 2007, Tytell et al 2008). Future research in biological systems may reveal the importance of such shape-based hydrodynamic interactions in fish swimming.
The complexity of this study's findings also demonstrate that even one shape can behave differently depending on the kinematics with which its moved, how the body in front of the tail is shaped and moves, and the body and tail's material properties. Many of the foils in this study contradicted the simplistic hypotheses about function. For example, the forked tail with the narrow peduncle region (the most 'tuna-like' tail) did not display the highest Ueq or the lowest energetic cost at all stiffnesses (figure 3). All of this is not to say that existing hypotheses about how fish body and tail shape affect swimming performance are wrong. Rather, it suggests that extrapolating any performance advantage from morphology alone is a risky venture. The assumptions behind the claims of adaptive morphology may be correct, but until the implied mechanistic links between morphology and performance are proven, they remain assumptions. Morphology and performance often have complicated interrelationships. Until there are data demonstrating that a morphological feature directly affects a specific metric of swimming performance, equating morphological differences with performance differences is premature.
Acknowledgments
This work was supported by an NSF Graduate Research Fellowship under grant DGE-1144152 to K.F., and National Science Foundation grant EFRI-0938043, Office of Naval Research grant N00014-09-1-0352 (monitored by Dr Thomas McKenna) to G.V.L., and ONR MURI grant N00014-14-1-0533 (monitored by Dr Bob Brizzolara). Special thanks to Dan Quinn and members of the Lauder Lab for many helpful discussions on foil propulsion, and to Kelsey Lucas in particular for comments on an earlier draft of this manuscript.