
Abstract
A brain–machine interface (BMI) can be used to control movements of an artificial effector, e.g. movements of an arm prosthesis, by motor cortical signals that control the equivalent movements of the corresponding body part, e.g. arm movements. This approach has been successfully applied in monkeys and humans by accurately extracting parameters of movements from the spiking activity of multiple single neurons. We show that the same approach can be realized using brain activity measured directly from the surface of the human cortex using electrocorticography (ECoG). Five subjects, implanted with ECoG implants for the purpose of epilepsy assessment, took part in our study. Subjects used directionally dependent ECoG signals, recorded during active movements of a single arm, to control a computer cursor in one out of two directions. Significant BMI control was achieved in four out of five subjects with correct directional decoding in 69%–86% of the trials (75% on average). Our results demonstrate the feasibility of an online BMI using decoding of movement direction from human ECoG signals. Thus, to achieve such BMIs, ECoG signals might be used in conjunction with or as an alternative to intracortical neural signals.
Export citation and abstract BibTeX RIS
1. Introduction
A brain–machine interface (BMI) is a device that translates neural activity of the brain into signals controlling a machine. Different techniques exist to record brain activity for BMIs and there are different approaches to translate brain signals into movements of an external effector (Wolpaw et al 2002, Lebedev and Nicolelis 2006, Waldert et al 2009).
Some of the most powerful BMIs have been realized using the spiking signals of multiple neurons recorded with intracortical electrode implants (Serruya et al 2002, Carmena et al 2003, Hochberg et al 2006, Santhanam et al 2006, Moritz et al 2008, Velliste et al 2008, Fraser et al 2009). However, recordings from intracortical implants can be unstable due to the response of brain tissue to the implant (Shain et al 2003, Bjornsson et al 2006) and due to changes of the neuronal activity–behaviour relationship across time (Donoghue et al 2004, Dickey et al 2009). BMIs have also been implemented using non-invasive recording techniques, where the neural activity is recorded outside of the subject's skull using electroencephalography (EEG), magnetoencephalography (MEG), functional magnetic resonance imaging (fMRI) or near infrared spectroscopy (NIRS; Birbaumer et al 1999, Weiskopf et al 2004, Wolpaw and McFarland 2004, Mellinger et al 2007, Abdelnour and Huppert 2009, McFarland et al 2010).
In addition, recordings from the surface of the brain (electrocorticography; ECoG) using epicortical implants have also been used for BMIs (Leuthardt et al 2004, Schalk et al 2008). Compared to intracortical implants, ECoG signals can be recorded without implanting the electrodes into the cortex, do not require spike sorting and exhibit potential advantages with regard to long-term recording stability (Chao et al 2010). In comparison to non-invasive recording techniques, ECoG has a higher spatial resolution (Freeman et al 2000, Slutzky et al 2010), higher bandwidth (Staba et al 2002), higher signal to noise ratio (Ball et al 2009a) and is less prone to artefacts (Ball et al 2009a). Additionally, ECoG recordings are used in clinical procedures, such as pre-surgical epilepsy diagnostics (Rosenow and Luders 2001) and electrical stimulation mapping (Foerster 1931, Uematsu et al 1992), which makes it possible to conduct ECoG studies with human subjects without additional medical risk.
Previous online brain-control studies using ECoG decoded the execution or imagery of different parts of the body (e.g. right versus left hand) to control an external actuator (Leuthardt et al 2004, Schalk et al 2008). In addition, it has been shown that different movements of the same limb (e.g. the direction of an arm movement) can also be inferred from ECoG (Leuthardt et al 2004, Mehring et al 2004, Schalk et al 2007, Pistohl et al 2008, Ball et al 2009b, Miller et al 2009, Wang et al 2009, Chao et al 2010). For example, continuous position and velocity of 2D arm movements (Schalk et al 2007, Pistohl et al 2008), continuous finger position (Kubanek et al 2009) and different grasping movements (Pistohl et al 2012) have been decoded. However, all these studies decoded the movements offline. An online BMI using the decoding of kinematic movement parameters from ECoG has not been realized until now.
Here, we demonstrate online brain control of a computer cursor using the decoding of movement direction from ECoG recordings in humans.
2. Methods
2.1. Subjects and recordings
Five subjects (S1–S5) suffering from intractable pharmaco-resistant epilepsy (table 1) voluntarily participated in the study after having given their informed consent. The study was approved by the Freiburg University Ethics Committee.
Table 1. Clinical profiles of the subjects taking part in the experiment.
| Subject | Age | Sex | Handedness | Electrode location | Seizure focus |
|---|---|---|---|---|---|
| S1 | 33 | M | R | Grid right fronto-central | Right frontolateral |
| Right fronto-lateral strip | Right parietal | ||||
| 4 Right inter-hemispheric strips | Right inter-hemispheric | ||||
| S2 | 22 | M | R | Grid left frontal | Left frontal |
| 3 Left dorsolateral-prefrontal and frontal strips | |||||
| 4 Inter-hemispheric strips | |||||
| S3 | 41 | F | L | Grid left fronto-lateral | Left precentral |
| 2 Left frontal strips | |||||
| 4 Inter-hemispheric strips | |||||
| S4 | 17 | M | R | Grid right frontal | Rest of gyrus temporalis superior (after resection) |
| 2 Depth electrodes to right insula and hippocampus | |||||
| 2 Right occipital and temporo-basal strips | Right hippocampus | ||||
| Right posterior insula | |||||
| Right frontal lobe | |||||
| S5 | 23 | M | R | Grid right fronto-central | Right frontal |
| 5 Inter-hemispheric strips | |||||
| Right parieto-occipital strip | |||||
| 2 Posterior parietal strips |
For pre-neurosurgical epilepsy diagnostics, the subjects were implanted with an 8 × 8 grid of subdural surface electrodes (Ad-Tech, Corp., 1 cm inter-electrode distance, 4 mm electrode diameter) covering parts of the primary and pre-motor cortex (figure 1). S1, S2, S3 and S4 had additional ECoG stripes implanted. In addition to the signal from the subdural electrodes, 21 surface EEG channels, one or two bipolar electro-oculography (EOG) channels, the electrocardiography (ECG) channel and several electromyography (EMG) channels were recorded. Signals from the ECoG electrode stripes, EEG, ECG and EMG channels were not analyzed in this study.
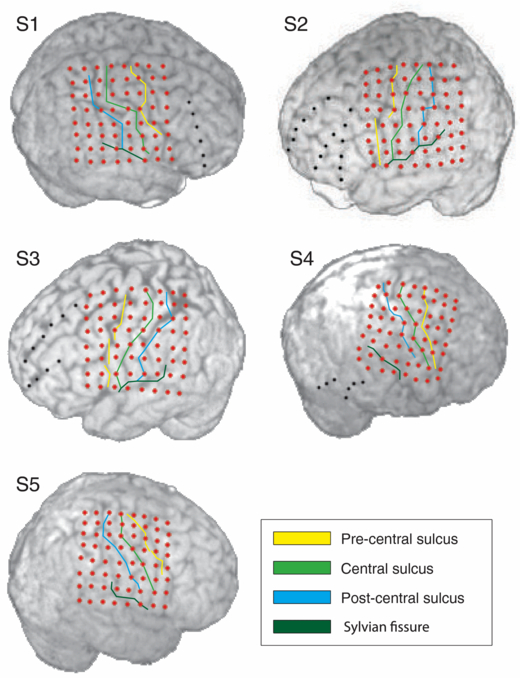
Figure 1. Position of the implants on the neocortex and in relation to the Sylvian fissure, precentral, central and postcentral sulci. Brain outlines were reconstructed from the pre-implantation MRI of the subjects. Electrodes (red and black dots) and sulci were reconstructed from the post-implantation MRI of the subjects. Note that, due to local pressure in the region of the implant, brain tissue can be partially compressed and the brain surface can be slightly deformed relative to the pre-implantation state. Therefore, a mismatch between the sulci on the pre-implantation MRI and sulci reconstructed from the post-implantation MRI is possible. We analyzed the signals from the electrode grid implants only (red dots).
Download figure:
Standard imageRecordings from all electrodes were digitized at 1024 Hz sampling rate for S1, S2 and S3 (Brainbox EEG-1164 amplifier, Braintronics B. V., Almere, Netherlands) and at 2500 Hz sampling rate for S4 and S5 (AC441-01 Neuvo amplifier, Compumedics Limited, Abotsford, Australia). Recordings for S1, S2 and S3 were made using a hardware high-pass filter with 0.032 Hz cutoff frequency. Recordings for S4 and S5 were made without the hardware high-pass filter. Experiment control and paradigm presentation were performed using our own laboratory software. Subsequent data analysis was performed using MATLAB (MATLAB versions 7.4-7.11, Natick, Massachusetts: The MathWorks Inc., 2007–2011).
2.2. Task
Subjects interacted with an experimental paradigm shown on a computer screen (figure 2). The experiment was carried out in sessions, defined as uninterrupted time epochs in which subjects continuously interacted with the paradigm. Each session consisted of 50 or 25 trials after which the subject stopped performing the task. Each trial consisted of a pause phase (1–2 s, random, uniformly distributed) followed by a preparatory informative cue presentation (displayed for 1–2 s, random, uniformly distributed), which informed the subject to prepare for moving a joystick to the left (purple rhomboid) or to the right (red rhomboid) using the hand contra-lateral to the implantation site. After a delay of 2–3 s (random, uniformly distributed), a go cue (green dot) was presented and subjects had to initiate the movement during the next 1 s. During the movement, no visual feedback was given to the subject. After reaching the joystick end position, they had to keep it in this position for additional 2 s. If subjects did not follow this sequence correctly, the trial was stopped and not used. This was done to ensure stereotypical movements of the subjects after the go cue and no movements before the go cue. Subsequently, the cursor on the screen moved in the direction in which subjects moved the joystick (feedback phase).

Figure 2. Subjects interacted with an experimental paradigm shown on a computer screen. One session consisted of 50 or 25 trials. Each trial consisted of a pause phase (1–2 s, random, uniformly distributed), informative cue presentation (1–2 s, random, uniformly distributed), a delay phase (2–3 s, random, uniformly distributed), a movement phase initiated by a go cue and a feedback phase. The screen showed a fixation cross during pause and delay phases, a coloured rhomboid (purple: movement to the left, red: movement to the right) during the informative cue presentation and a green dot during the movement phase, all in the centre of the screen. In the feedback phase the cursor changed to the colour of the informative cue, and was moved in the direction of the subjects' joystick movement. In addition, a thick line in the colour of the informative cue would appear in the path of the cursor. If the cursor crossed the line, the word 'Tor' (German for 'goal') would be written on the screen. If subjects did not perform stereotypic movements after the go cue or performed movements before the go cue, an error message would appear and the trial would be terminated. Subjects were then asked to resume the initial position and the next trial would start.
Download figure:
Standard imageEach experiment started with an introduction session in which the subject was familiarized with the task. Subjects were encouraged to perform correct as well as incorrect trials, so that they would get used to the task and to the error messages written on the screen. Once the subject was familiar with the task, the introduction session was stopped and one or two training sessions followed. During the feedback phase of the training sessions, the cursor always moved over to the maximum distance from the centre in the correct direction. Once the training sessions were finished, a model was built from the collected data. One or more brain-control sessions followed, identical to the training sessions, except for the feedback phase. Now, the distance travelled by the cursor was proportional to the posterior probability for the cued movement direction as decoded with the trained model. A vertical line was positioned at the half of the maximum distance the cursor could travel, signifying posterior probability of 0.5. Every time the posterior probability was higher than 0.5, the cursor would cross the line and the word 'Tor' (German for 'goal') was written on the screen, providing positive feedback to the subject. After every brain-control session the model was re-built using one or more of the previous sessions as training data, sometimes with a change in the selection of electrodes. Table 2 summarizes the experiments for all subjects.
Table 2. Summary of the online closed loop experiment. Numbers of left (L), right (R) and total (Tot) number of correctly performed trials are shown for each session. For every brain-control session, we listed the sessions, selected number of electrodes and electrode selection strategy (all ESM H&A motor electrodes, or selecting the electrodes by visual inspection of the neural responses) used for model building.
| Number of trials | |||||||
|---|---|---|---|---|---|---|---|
| Session | R | L | Tot | Model trained on | Number of electrodes | Electrodes used | |
| S1 | S1s1 (training) | 23 | 27 | 50 | |||
| S1s2 (training) | 23 | 22 | 45 | ||||
| S1s3 (brain control) | 24 | 21 | 45 | S1s1 and S1s2 | 16 | ESM H&A motor | |
| S1s4 (brain control) | 23 | 22 | 45 | S1s3 | 6 | Visual inspection | |
| S1s5 (brain control) | 16 | 24 | 40 | S1s4 | 6 | Visual inspection | |
| S2 | S2s1 (training) | 24 | 20 | 44 | |||
| S2s2 (brain control) | 18 | 23 | 41 | S2s1 | 16 | ESM H&A motor | |
| S2s3 (brain control) | 12 | 29 | 41 | S2s1 & S2s2 | 16 | ESM H&A motor | |
| S2s4 (brain control) | 24 | 22 | 46 | S2s1, S2s2 and S2s3 | 16 | ESM H&A motor | |
| S3 | S3s1 (training) | 24 | 23 | 47 | |||
| S3s2 (brain control) | 20 | 27 | 47 | S3s1 | 8 | Visual inspection | |
| S3s3 (brain control) | 21 | 28 | 49 | S3s1 & S3s2 | 2 | Visual inspection | |
| S4 | S4s1 (training) | 26 | 20 | 46 | |||
| S4s2 (brain control) | 13 | 9 | 22 | S4s1 | 12 | Visual inspection | |
| S5 | S5s1 (training) | 21 | 29 | 50 | |||
| S5s2 (brain control) | 11 | 11 | 22 | S5s1 | 19 | ESM H&A motor | |
2.3. Model building for decoding in brain-control sessions
Data from relevant (table 2) sessions was common average referenced using recordings from all electrodes on the 8×8 ECoG grid that did not have any defects or did not record epileptic activity.
First we chose the strategy for selecting the electrodes to be used in model building. We either selected all electrodes that showed a hand or arm motor response during the electrical stimulation mapping (ESM; ESM H&A motor electrodes; Foerster 1931, Uematsu et al 1992) or we chose the electrodes by visual inspection of the recorded ECoG amplitudes for each movement direction (table 2).
Our decoding model was based on several features of low-pass filtered ECoG signals (second-order symetric Savitzky–Golay filter with window length optimized between 0.25 and 1 s; Savitzky and Golay 1964, Steinier et al 1972). Following filtering, features were taken at different time points with respect to the go cue. Model building consisted of testing different values of parameters defining the feature selection and the decoder used for classification. Feature selection consisted of selecting: (i) the window length of the Savitzky–Golay filter, (ii) the number of features from one electrode, (iii) the time of the first feature relative to the go cue, and (iv) the temporal distance between the first and the last feature. For decoding, we used regularized linear discriminant analysis (RLDA; Friedman 1989), which uses an additional parameter, the regularization coefficient (v), to improve generalization. ECoG recordings for S4 and S5 were not high-pass filtered by the recording system. Therefore, to remove low frequency potential drifts for S4 and S5, we subtracted the low-pass filtered ECoG signal that was obtained by filtering using a causal running average filter. In addition to other model parameters, for S4 and S5, we also selected between different values of (vi) the window length of the running average filter. For each of these parameters, we defined a set of values and tested every combination of these values using five-fold cross validation. The set of parameter values which gave the highest estimated normalized decoding accuracy (DA) was used to build the model on the entire set of training data:

where Nclass is the number of classes (in our case 2; left and right movements), ci is the number of correct trials for a given class and ni is the total number of trials for a given class.
2.4. Offline data analysis
During the online experiment, the time for model building was limited. Therefore, the number of tested parameter values was reduced. In the offline analysis we always used a more exhaustive range of parameter values: (i) Savitzky–Golay filter window length: ¼, ½, ¾ and 1 s; (ii) number of features from one electrode: 1, 2, 3, 4 and 6; (iii) temporal distance of the first feature relative to the go cue: from 0 till 1.4 s after the go cue in steps of 0.1 s; (iv) time interval between the first and the last feature:  ,
,  ,
,  ,
,  ,
,  ,
,  and 1 s; (v) regularization parameter: 0, 0.001, 0.1, 0.3, 0.5, 0.7, 0.9 and 0.99; (vi) window length of the running average filter: 5, 10 and 20 s (for S4 and S5 only).
2.5. Comparison of electrode selection strategies
To optimize decoding, proper electrode selection is important (Muller et al 2000, Lal et al 2004, Demirer et al 2009). In the case of patients recovering after intracranial surgery, an additional restriction is that the model has to be built in the short amount of time available for experiments and, hence, needs to be based on only a small amount of training data. This restricts the number of possible electrode selections that can be tested. For this reason, before the brain-control sessions, we selected the electrodes used for model building based either on the results of ESM or on visual inspection of the neural responses, thereby not optimizing the electrode selection on the basis of DA.
Offline analysis was used to test whether selecting the electrodes in a different manner could have increased the DA. We restricted the electrode selection to the ESM H&A motor electrodes, trying to avoid electrodes where information could be a result of some kind of artefact (e.g. eye movements) and minimizing the influence of sensory feedback induced by the subjects' movements. To further minimize the influence of sensory input, we also considered the subset of the ESM H&A motor electrodes that lay over the motor cortex according to the sulci reconstruction (ESM H&A motor + SR motor electrodes).
Thus, two electrode sets were considered for the offline electrode selection strategy: (a) all ESM H&A motor electrodes and (b) ESM H&A motor + SR motor electrodes. For each of these sets, we considered (i) single electrodes belonging to the electrode set (a or b), (ii) electrode pairs (vertical or horizontal) within the electrode set, (iii) three neighbouring electrodes within the electrode set, (iv) four neighbouring electrodes within the electrode set and (v) all electrodes together belonging to the electrode set. We evaluated the DA of all electrode subsets for all parameter values (see above) by five-fold cross validation on the training data and selected the parameter values and electrode subset yielding the highest DA for (i), (ii), (iii), (iv) and (v) separately. These subsets and parameter values were then used to decode the brain-control sessions offline. Sessions used for training and testing the model were chosen in the same way as in the online experiment (table 2).
2.6. Significance testing of neural responses
To confirm that neural responses to left and right movements were significantly different from each other and from baseline activity, a Mann–Whitney–Wilcoxon test was applied between neural responses at every time point. Neural activity recordings were first low pass filtered with the Savitzky–Golay filter (symmetric, second-order, 0.5 s window length). Since the response had to be present within a limited time after the trigger, we tested the epoch of the neural activity from the go cue until 2 s after the go cue. Baseline neural activity was defined as all neural activity outside the epochs described above. To sample the baseline activity distribution properly, we removed the autocorrelation of the low-pass filtered activity arising from the filtering procedure by sampling the baseline activity only every 0.5 s. To reduce the computation time of the significance testing, we tested significance of the neural responses every 31.25 ms (corresponding to 32 Hz), instead of testing for every recorded time point.
Due to the large number of statistical tests, correction for multiple testing was necessary to control the number of falsely rejected null hypotheses. We used the Benjamini–Hochberg procedure (Benjamini and Hochberg 1995) with a correction for dependent statistics (Benjamini and Yekutieli 2001) to set the false discovery rate for one subject at the level of 5% for all tests. A neural response to the go cue on a certain electrode was considered significant if there was at least one time point for which the neural response to the go cue for right movements was significantly different from baseline neural activity or, alternatively, at least one time point for which the neural response to the go cue for left movements was significantly different from baseline neural activity. This condition needed to be satisfied after the correction for multiple testing was applied, taking into account all time-point-wise tests for both conditions. A neural response to the go cue was considered significantly different between left and right movements if there was at least one time point for which the neural response to the go cue for right movements was significantly different from the neural response to the go cue for left movements, after the correction for the multiple testing was made.
2.7. Movement onset versus go cue alignment
Since the neural signal epochs used for decoding were aligned to the go cue, differences in movement reaction times and, hence, in the onset times of neural responses time-locked to movement onset, could have quite different effects on DA, depending on whether they originate from trials of the same movement type (either left or right) or whether they stem from a systematic difference in reaction times for different movement types (left versus right). In the latter case, the systematic difference in response onset by itself would allow for correct directional decoding, even for otherwise identical neural responses. Removing the systematic reaction time difference by aligning the neural signal epoch on movement onset instead of on go cue should then reduce the DA. On the other hand, differences in reaction times for trials of the same movement type would increase the variability of the neural responses of both movement types when aligned to the go cue and, hence, lead to a reduction in DA. Removing the effect of reaction time variability by aligning the signal epochs on movement onset, instead of on go cue, would then be expected to result in an increase of DA.
To test which of these two scenarios were true, we realigned the neural responses to movement onset, thereby removing, or at least reducing, both response onset variability and systematic response onset latencies due to differences in reaction times. We ran the whole experiment offline as if it was an online experiment, i.e. using the same sessions for training and testing (table 2).
2.8. Electrical stimulation mapping and neuroanatomical electrode assignment
Electrical cortical stimulation through the electrode grid was performed using an INOMED NS 60 stimulator (INOMED, Germany) as a part of the clinical procedure. Stimulation trains of 7 s duration consisted of 50 Hz pulses of alternating polarity square waves of 200 µs each. The intensity of stimulation was gradually increased up to 15 mA or to the induction of sensory and/or motor phenomena. Subjects were unaware of the timing of stimulation, unless these phenomena occurred. Phenomena were reported by the subject, specifying the limb of origin and the type of sensation (motor or somatosensory). Consequently, ESM maps were created and used to select the electrodes used for online brain control (figure 3).

Figure 3. Overview of the electrode selection for the online brain control combined with ESM results and sulci reconstruction. For each subject, an 8 × 8 electrode grid (circles represent electrodes) is shown, oriented in the same manner as the grid in figure 1. Arrows above the top right corner point in the frontal direction. Red circles mark the electrodes initially used for brain control, blue circles mark the electrodes used after the electrode selection was changed. Electrode selection was changed only once for S1 and only once for S3. Letters above the electrodes mark the type of the ESM response elicited: A: arm, H: hand, L: leg, E: eye and F: oro-facial responses. Black letters mark motor responses, white letters mark somatosensory responses. Solid green lines mark the Sylvian fissure, precentral, central and postcentral sulci reconstructions.
Download figure:
Standard imageData from post-implantation MRIs were used to reconstruct the positions of the Sylvian fissure, central sulcus, postcentral sulcus and precentral sulcus with respect to the electrodes (figures 1 and 3). The reconstruction informed us whether an electrode was lying over one of the reconstructed sulci or not. We defined the sulci reconstruction (SR) motor electrodes as set of electrodes located over the central sulcus, over the precentral sulcus, or in-between the central and the precentral sulci according to the sulci reconstruction. Sulci reconstruction was available only after the online experiment had finished.
3. Results
3.1. Neural responses
We found significant neural responses to go cue (figure 4) on a large number of electrodes (47 out of 64 for S1, 37 out of 64 for S2, 52 out of 64 for S3, 19 out of 64 for S4 and 44 out of 64 for S5; 62% of the electrodes on average). In contrast, only a small number of electrodes showed significant differences between neural responses to left and right movements (8 electrodes for S1, 1 for S2, 7 for S3 and none for S4 and S5, 5% of the electrodes per subject on average). These results show that, even though the neural response to hand movements are widely distributed, only a small fraction of the responses contained directional information.
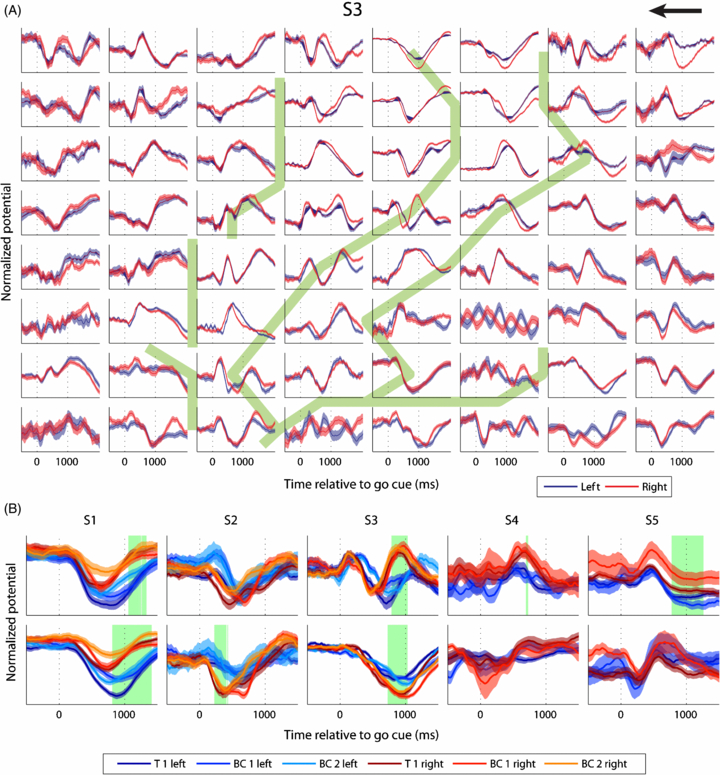
Figure 4. (A) Mean ± standard error of the mean of the low-pass filtered neural activity (second-order symmetric Savitzsky–Golay filter, 0.5 s length) for S3 for left (blue) and right (red) movements relative to the go cue (0 s) over the electrode grid. Every subplot represents one electrode with the top left subplot corresponding to the top left grid electrode as shown in figure 1. The arrow points in the frontal direction. Solid green lines in the background show sulci reconstructions. (B) Low-pass filtered neural responses recorded from two selected electrodes for every subject (same filter as in A). 0 s marks the go cue. For S1, S2 and S3 mean ± standard error of the mean of the neural response is shown for the first training session (T 1) and the first and the second brain-control session (BC 1 and 2). For S4 and S5, only one brain-control session was recorded. Therefore, only T 1 and BC 1 are shown. Green background marks the times when the neural response for left and right movements were significantly different from each other for all three sessions.
Download figure:
Standard image3.2. Decoding accuracy in online closed loop experiments
During the online experiment, we ran two training and three brain-control sessions with subject S1, one training and three brain-control sessions with S2, one training and two brain-control sessions with S3 and one training and one brain-control session with S4 and S5 each (table 2). Table 3 shows the overview of the chosen parameter values during the model building phase for each of the brain-control sessions.
Table 3. Summary of the parameter values used for building the model before each of the brain-control sessions during the online experiment. The high-pass filter, implemented by subtraction of the low-pass filtered signal using running average filter, was used for subjects S4 and S5 only.
| Session | Savitzky–Golay filter window length (s) | Features per channel | Time of the first feature (s) | Temporal distance between the first and the last feature (s) | Regularization | High-pass filter window length (s) |
|---|---|---|---|---|---|---|
| S1s3 | 1 | 2 | 1.4 | 1/4 | 0.7 | x |
| S1s4 | 1 | 3 | 1 | 1/16 | 0.1 | x |
| S1s5 | 1/2 | 2 | 0.9 | 3/8 | 0.01 | x |
| S2s2 | 1/2 | 2 | 0.3 | 1/16 | 0.3 | x |
| S2s3 | 3/4 | 1 | 0.4 | x | 0.01 | x |
| S2s4 | 2/3 | 1 | 0.5 | x | 0.01 | x |
| S3s2 | 1/3 | 1 | 1 | x | 0.1 | x |
| S3s3 | 1/2 | 1 | 0.9 | x | 0.5 | x |
| S4s2 | 1/2 | 1 | 1.3 | x | 0.3 | 5 |
| S5s2 | 3/4 | 1 | 0.7 | x | 0 | 20 |
We achieved significant (p < 0.01, binomial test) directional decoding in online closed loop hand movement direction decoding in four out of five subjects and eight out of ten sessions (figure 5(A), table 4) with average DA of 75%. We used two different strategies to select the electrodes used for model building. For the first brain-control session for S1 and all brain-control sessions for S2, S4 and S5 we used all ESM H&A motor electrodes (average DA 71%). For the other brain-control sessions, we selected the electrodes which showed strongest tuning during training, not necessarily restricting ourselves to ESM H&A motor electrodes (average DA 80%). The difference in DA between these two strategies was significant (p < 0.05, Fisher's exact test). On the other hand, we found no significant difference (p = 0.48, Fisher's exact test) between strategies of using only the last preceding session to train the model (average DA 77%) and using multiple sessions (average DA 74%).
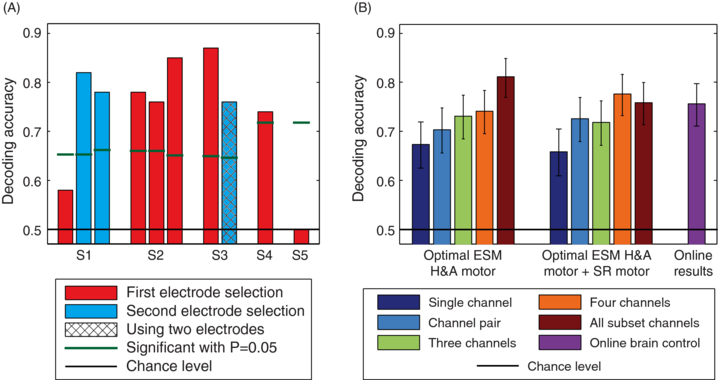
Figure 5. (A) Overview of the DA in the online brain-control experiment. (B) Offline analysis of DA for different electrode sets (ESM H&A motor, ESM H&A motor + SR motor) and their subsets (single electrode, electrode pair, electrode quartet, all electrodes) and comparison to DA from the brain-control sessions. For each or the electrode sets, the optimal electrode subset and the corresponding set of parameters were chosen by maximizing DA evaluated using five-fold cross-validation on the sessions used for model building. Histograms show the average DA evaluated on the testing sessions with error bars showing 95% confidence intervals of the mean. Choice of sessions used for model building and testing sessions was identical to those used in the online experiment (table 2).
Download figure:
Standard imageTable 4. Summary of DA in the online closed loop experiment. For every brain-control session, we listed the number of left (L) and right (R) successful/total trials and significance level (p) testing a chance level decoder hypothesis using a binomial test.
| Successful trials | ||||
|---|---|---|---|---|
| Brain-control session | R | L | DA | P value |
| S1s3 | 15/24 | 11/21 | 0.58 | 0.12 |
| S1s4 | 16/23 | 21/22 | 0.83 | <0.001 |
| S1s5 | 9/16 | 22/24 | 0.74 | <0.001 |
| S2s2 | 17/18 | 14/23 | 0.78 | <0.001 |
| S2s3 | 8/12 | 23/29 | 0.76 | <0.001 |
| S2s4 | 22/24 | 17/22 | 0.85 | <0.001 |
| S3s2 | 18/20 | 23/27 | 0.87 | <0.001 |
| S3s3 | 18/21 | 19/28 | 0.76 | <0.001 |
| S4s2 | 9/13 | 7/9 | 0.74 | 0.009 |
| S5s2 | 5/11 | 6/11 | 0.50 | 0.42 |
In the second brain-control session of S3, we used neural activity measured with only two neighbouring electrodes, 1 cm apart, for decoding (figure 5(A), electrodes marked in figure 3). The DA of 76% achieved by using only these two electrodes was not significantly different from the DA in the remaining sessions (mean DA = 75%, p = 1, Fisher's exact test).
3.3. Comparison of electrode selection strategies
We evaluated the DA from different electrode selection strategies and different electrode subsets (figure 5(B)). For ESM H&A motor + SR motor electrodes, the DA from four neighbouring electrodes (average DA 78%) was not significantly different from the DA from all subset electrodes (average DA 76%; p = 0.61; Fisher's exact test) or the DA from the brain-control sessions (average DA 76%; p = 0.56; Fisher's exact test). This shows that most of the directional information was already present in the signals recorded from small subsets of four neighbouring electrodes (contained within a 14 mm × 14 mm area). Additionally, ESM provides a strong indication that all four of these electrodes were recording neuronal signals from the hand and arm area of the motor cortex.
Using all ESM H&A motor electrodes yielded the highest DA (average DA 81%), with a tendency to be higher than the DA from brain-control sessions (p = 0.07; Fisher's exact test) and the DA from using only all ESM H&A motor + SR motor electrodes (p = 0.07; Fisher's exact test). Note that the 'all ESM H&A motor electrode set' can include electrodes that lay over pre-motor and somatosensory cortex according to the sulci reconstruction (see section 2.6).
3.4. DA topographies
Figure 6 shows the spatial distribution of DA over the electrode grid when electrode quartets were used for decoding. For all subjects, the maxima of the DA had at least one electrode in the quartet belonging to the ESM H&A motor electrode set, with other high DA quartets grouped around the locations of the maxima. This is expected for a task involving hand and arm movements and confirms that the neural responses used for decoding were not the product of artefacts.

Figure 6. Topographies of DA, averaged over all brain-control sessions, for all subjects with respect to the ESM responses (letters) and sulci reconstruction (solid green lines). The colour of each square indicates the DA achieved when using recordings from four electrodes located at the edges of the square. DA was calculated by selecting parameter values that gave the highest DA on the sessions used for model building (five-fold cross-validation), using these to build a model on the complete set of the same sessions and decoding using this model on the testing sessions. Choice of sessions used for model building and testing sessions was identical to those used in the online experiment (table 2). White circle marks the electrode quartet with the highest DA. Arrows above the top right corner point in the frontal direction.
Download figure:
Standard image3.5. Movement onset versus go cue alignment
Inspection of the joystick movements (figure 7(A)) revealed that, apart from reaction time and movement direction, rightward and leftward movements were quite similar, both across movement types (left versus right) and across trials within the same movement type (either left or right). Following the go cue, subjects initiated the movements (defined as crossing 15% of the maximum joystick deflection in horizontal direction) after 415 ± 87 ms (S1 304 ± 12 ms; S2 156 ± 12 ms; S3 439 ± 13 ms; S4 661 ± 33 ms; S5 513 ± 16 ms). We observed a significant difference in reaction time between left and right movements (p < 0.05; Mann–Whitney–Wilcoxon test) for some sessions of S2 and S4 (figure 7(B)).
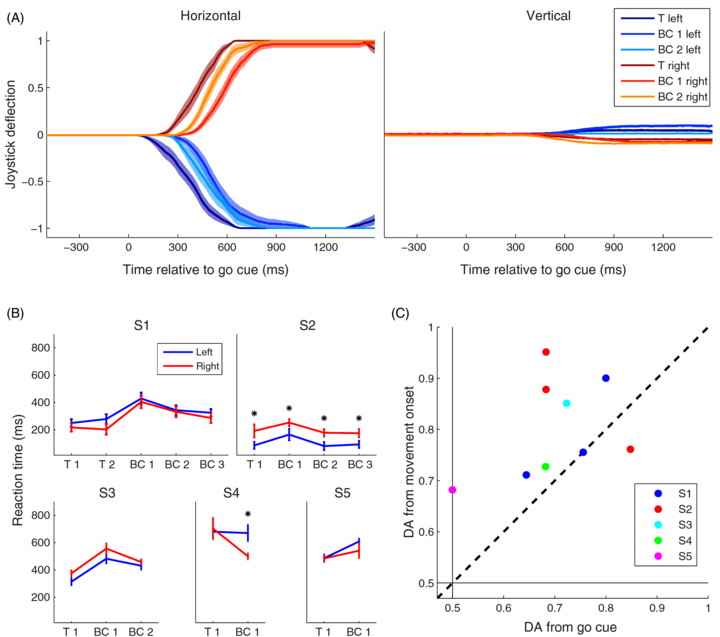
Figure 7. (A) Horizontal and vertical joystick deflection for S3 (normalized to a range of −1 to +1). Movements are shown as average ± standard error of the mean. (B) Average movement onset time (15% of joystick deflection) following the go cue for every subject and every training (T) and brain-control (BC) session. Error bars show standard error of the mean. Stars mark significant differences (Mann–Whitney–Wilcoxon test) between left and right movement onset times. (C) Comparison of DA from online brain-control experiment and DA from trials realigned to movement onset. Thin black lines show DA chance level.
Download figure:
Standard imageTo test whether response onset variability has an effect on the DA, we re-aligned the neural responses to movement onset and re-ran the experiment using the same sessions for training and testing (table 2). We found that, in all subjects, the resulting DA was higher after alignment to movement onset than during the brain-control sessions where trials were aligned on the go cue (figure 7(C); DA increase 0.08 ± 0.03%, p < 0.05; signed Mann–Whitney–Wilcoxon test). This indicates that the selected neural responses were indeed coding for movement direction and that correct decoding was not due to systematic response latency differences for different movement types.
4. Discussion
Here we showed that it is possible to realize online brain-control using the directional tuning of human ECoG signals. Brain control was achieved for four out of five subjects. For the subject where no control was obtained (S5), we could run only one brain-control session. Eventually, due to medical reasons, the experiments with S5 had to be stopped and no additional brain-control sessions could be performed later on. For S1, the first brain-control session was also unsuccessful. In the subsequent sessions for S1, we changed the electrode selection and achieved significant control. In case more experimental time had been available for S5, we would have employed the same strategy, hoping that it might have worked for S5 as well.
We also examined DA based on signals from a small subset of neighbouring electrodes. In the second brain-control session of S3, we showed that brain control is possible using signals from only two neighbouring electrodes. DA obtained with these two electrodes was the same as the average DA from other online brain-control sessions. Moreover, our offline analysis revealed that, across all sessions and subjects, already four neighbouring electrodes provided almost all available movement information. This supports the idea that most of the informative signals in our experiment can be recorded from an area that is relatively small compared to the size of the entire ECoG grid. This is consistent with offline analyses of previous studies showing high DA from local ECoG electrode quartets (Ball et al 2009b), thereby indicating the feasibility of using ECoG implants with small, possibly dense electrode grids for BMI applications.
One of the possible BMI applications is to control movements of hand and arm prostheses. Such prostheses might not provide proprioceptive feedback. Moreover, sources of the BMI control signals for the hand/arm prosthesis should not interfere with movements of other body parts. Thus, we focused on neural activity in the hand and arm area of the motor cortex. ESM was used as an indication that electrodes recorded neural activity predominantly related to hand and/or arm movements while sulci reconstruction was used to determine which of these electrodes were lying over the motor cortex (figure 3). Our online experiment demonstrated that using all ESM H&A motor electrodes lead to a significant DA of 71% on average. When the identical experiment was repeated offline, now on all brain-control sessions and with a complete search over all model parameters, DA increased to 81%. According to sulci reconstruction, some of the ESM H&A motor electrodes were lying over the somatosensory cortex and some over the pre-frontal cortex. Thus, neural activity related to somatosensory feedback and cognitive processes may have contributed to decoding performance in the online control condition. To test whether this was the case, we used sulci reconstruction to determine a more restrictive set of electrodes by using only ESM H&A motor electrodes within the anatomically defined motor cortex. We demonstrated that one can still achieve a significant DA of 76% from this smaller electrode set. Even though neural activity related to visual and somatosensory feedback is present in motor cortex as well (Fetz et al 1980, Naito et al 1999, Merchant et al 2001), neural activity in the motor cortex mainly codes for motor execution (Suminski et al 2009). Therefore, this result suggests that BMI using decoding of movement kinematics from ECoG recordings in humans may be possible, even without somatosensory feedback.
In previous offline studies, higher DA was found when using low-pass filtered ECoG activity as compared to using the power modulations in several frequency bands (Schalk et al 2007, Pistohl et al 2008, Ball et al 2009b). Schalk et al showed that using low-pass filtered ECoG signals greatly increased DA when added to power modulations in different frequency bands. Pistohl et al showed that decoding 2D arm movement trajectories from the low-pass filtered signal component (LFC) of the ECoG recordings provided greater accuracy than decoding from power in different frequency bands. However, it is not clear how conclusions from these offline studies would generalize to online experiments. Schalk et al (2008) showed that online closed loop control is possible using power modulations in different frequency bands of the ECoG recordings. Here, we showed that online closed loop control is possible using the LFC of the ECoG recordings as well. Further studies are needed to reveal which feature of the ECoG recordings, LFC or power modulations in different frequency bands, provides a better signal for online closed loop control and weather these two features can be combined to improve accuracy.
In a previous study by Ball et al (2009b), it was shown that it is possible to decode multiple movement directions of a single arm from ECoG recordings. While Ball et al used offline decoding, here we demonstrate that it is possible to realize an online BMI based on decoding movement direction from ECoG signals. In our study, subjects received visual feedback depending on the decoded brain activity. An important aspect of such closed-loop studies is the temporal delay between neuronal activity and sensory feedback. Previous BMI studies used different delays, ranging from instantaneous feedback based on spiking activity (Kim et al 2008), over 4s for movement related EEG and fMRI signals (Kalcher et al 1996, Neuper et al 2003, Weiskopf et al 2004, Lee et al 2009) to over 20 s for communication BMIs (Farwell and Donchin 1988, Sellers et al 2006). Neuronal adaptation was observed even in the case of delays of approximately 60 s (Yoo and Jolesz 2002, Posse et al 2003). In another study (Birbaumer and Cohen 2007) feedback provided 2 s after the corresponding neuronal activity has been recorded improved the BMI control of the subjects. Thus, delayed BMI feedback is functionally relevant. In our study, the temporal delay between movement initiation and feedback presentation was below 3 s, which is well within the range of delays used in these previous BMI studies. However, it has been observed that reducing the delay by only several tenths of milliseconds in the range below 500 ms can improve BMI performance (Cunningham et al 2011). Furthermore, it has been suggested (Grosse-Wentrup et al 2011) that long feedback delays may be one of the reasons why the use of BMI for stroke rehabilitation had only limited success (Buch et al 2008, Ang et al 2009), although, even by using such long delays, rehabilitation was improved (Caria et al 2011). A further investigation of the influence of the length of the delay on BMI performance and neuronal adaptivity is, therefore, an interesting topic for further research. In this context, also the possible relation between using BMI and the induction of neural plasticity should be included (Grosse-Wentrup et al 2011).
Schalk et al (2008) realized an online cursor control using the human ECoG using either movement execution or imagery of movements of different parts of the body. In our experiment, with movements of a single limb, movement of the arm contralateral to the implantation site was used to generate the neural control signals. In our experiments, recordings from a rather small area of the motor cortex were sufficient to extract most of the decoded movement information. Therefore, the size of a future electrode implant covering the relevant cortical area can be rather small as well. This is supported by the results of the second brain-control session of S3, in which brain control was achieved using the recordings from only two neighbouring electrodes. The area covered by a hypothetical future implant with two electrodes, using the same design as in the implant used in this study, would be around 2 cm2 only (the total area of the implants used in this study is approximately 64 cm2). Further support comes from our offline analysis which revealed that, across all sessions and subjects, recordings from four neighbouring electrodes (area of approximately 4 cm2) already provided the maximum movement information.
When movements of different body parts are used, we expect that, due to a roughly somatotopic representation of the motor cortex, the required size of the implant to achieve BMI would be larger. Furthermore, in the approach used by Schalk et al subjects had to learn how to transform movements of different body parts to the desired movements of a cursor, e.g. that tongue protrusion is mapped to the cursor going up. In our experiment, learning of such transformations is easier since the control is intuitive: movement of the arm to the left moved the cursor to the left and movement of the arm to the right moved the cursor to the right. Schalk et al demonstrated a higher level of brain control compared to our study: subjects controlled computer cursors continuously in two dimensions, whereas subjects in our study could only generate a binary control signal. However, the earlier study by Pistohl et al (2008) demonstrated that continuous decoding of 2D arm movement trajectories is possible using ECoG. Thus, the approach of using decoding of motor kinematics from ECoG might be extendable to continuous control and to more degrees of freedom. Our study is a first step in this direction, confirming that online brain control using ECoG recordings with such approach is indeed possible. Future studies should reveal whether raising the level of brain control to continuous multidimensional control will be possible.
Our online experiment was performed using ECoG recordings aligned to the go cue. Offline analysis revealed that part of the decoding errors was a result of reaction time variability. When we reran the experiment offline, aligning the recordings to movement onset, DA increased significantly. This shows that signals used for decoding contained information about movement direction and not just information about the reaction time. In addition, it also suggests that our DA could be substantially improved during online brain control if movement onset triggers, rather than the go cue, were used for signal alignment. This could be implemented by tracking the joystick positions and using the moment where the joystick passed a certain threshold as a reference point for the decoder. Such movement onset detection could obviously not be used in the case of movement imagery needed for the application for paralyzed patients. In that case, the neural response onset, a purely internal event, would need to be detected and used as a trigger.
Our study provides a proof of concept that the BMI using directional tuning of ECoG recordings can be realized. We used recordings from an ECoG implant designed for epilepsy assessment, with 0.4 cm electrode diameter and 1 cm distance between electrodes. Recent studies recorded ECoG using high-resolution implants with electrode diameters and inter-electrode distances on the order of micrometers (µECoG), showing that epicortical potentials have spatial variability on a millimetre scale or less (Kim et al 2007, Leuthardt et al 2009, Slutzky et al 2010). Therefore, due to the implant design used in the present study, it can be assumed that a large amount of potentially informative signal was not recorded. Moreover, in our study most of the movement information that we decoded was already obtainable from a small area of the motor cortex. Thus, using high density µECoG implants over a small cortical area could potentially increase the accuracy of brain control.
Studies using intracortical recording techniques showed better accuracy of brain control than predicted from respective offline studies. This increase can be attributed to neuronal plasticity which changes the neuronal representations of movements to improve BMI control (Ganguly and Carmena 2009). These learning effects typically occur across days or weeks while, in our study, the available experimental time was limited to a few hours during one or two days. Hence, we expect that, with longer experimental time, the accuracy of our BMI would have significantly improved due to subject learning.
Previous studies have shown that movements of individual fingers (Kubanek et al 2009, Miller et al 2009) as well as natural grasping movements (Pistohl et al 2012) can also be decoded from ECoG. Future research will therefore reveal whether utilizing high-resolution recordings from µECoG implants together with subject training will increase the accuracy and the number of degrees of freedom of brain control, such that ECoG control of a dexterous hand and arm prosthesis may become possible. If successful, such a BMI can be used to restore hand and arm movements in paralyzed patients (e.g. after spinal cord injury or stroke) or in amputees.
Acknowledgments
This work was supported by the German Federal Ministry of Education and Research (BMBF) grant 01GQ0420 to BCCN Freiburg, BMBF 01GQ0830 grant to BFNT Freiburg and Tübingen and BMBF GoBio grant 0313891. We would like to thank the subjects for participating in our study. In addition, we would like to thank International Neuroinformatics Coordinating Facility (INCF), Federation of European Neurosciences (FENS) and Imperial College Fund (ICF) for helping to fund travel to conferences where this study was presented and discussed. We are grateful to the staff of the Freiburg University Hospital, Epilepsy Center for their help.