
Abstract
Objective. Brain–computer interfaces (BCIs) have the potential to be valuable clinical tools. However, the varied nature of BCIs, combined with the large number of laboratories participating in BCI research, makes uniform performance reporting difficult. To address this situation, we present a tutorial on performance measurement in BCI research. Approach. A workshop on this topic was held at the 2013 International BCI Meeting at Asilomar Conference Center in Pacific Grove, California. This paper contains the consensus opinion of the workshop members, refined through discussion in the following months and the input of authors who were unable to attend the workshop. Main results. Checklists for methods reporting were developed for both discrete and continuous BCIs. Relevant metrics are reviewed for different types of BCI research, with notes on their use to encourage uniform application between laboratories. Significance. Graduate students and other researchers new to BCI research may find this tutorial a helpful introduction to performance measurement in the field.
Export citation and abstract BibTeX RIS
Introduction
Brain–computer interfaces (BCIs), also known as Brain–machine interfaces, are technologies that allow communication and control without requiring muscle movement [1]. By this definition, BCIs could be used by individuals with the most severe motor impairments [2–4]. However, while BCI research is several decades old, BCIs remain a nascent technology in the commercial and medical spheres. While a few commercial BCI devices are available to the general public, and at least one is in clinical trials, at present BCIs remain a research endeavor.
BCIs are seeing considerable research interest. PubMed and Scopus search results are included in figure 1; the figure shows the considerable and consistent growth in papers mentioning BCI from 2001–2012. The quantity of publications is indicative of the number of laboratories investigating this topic.

Figure 1. BCI-related publications from 2001 to 2012. Articles and reviews were identified from PubMed and Scopus, with search terms 'brain computer interface' or 'brain machine interface' in either all fields (PubMed) or the abstract, title, or keywords (Scopus).
Download figure:
Standard image High-resolution imageBCI sensor technologies are diverse, including voltage recordings from implanted microelectrode arrays [3], electrocorticogram [5–8], and electroencephalogram (EEG) [9–13] and more varied sensors such as near infrared [14, 15] or magnetic resonance imaging [16, 17]. The applications are similarly varied, including both communication and control of devices such as virtual keyboard [18–20], prostheses [21, 22], wheelchairs [23–26], or environmental controls [27, 28]. Depending on the application, aspects of BCI performance (e.g., accuracy and speed) may differ in their relative importance.
Due to the large number of BCI laboratories and the diversity of technology and applications, BCI performance reporting is far from uniform. Even within the same task and with the same metric, labs sometimes report incommensurable results due to differing assumptions about how certain parameters are calculated.
Several recent publications by ourselves and others have sought to unify certain aspects of performance reporting in BCI. Gao [29] focused on information transfer rate (ITR) and issues particular to its calculation, Thompson [30] suggested certain metrics for widespread use in measuring performance in a communication task. Other works have suggested methods for other tasks, such as the use of Fitts's law for continuous BCIs [31, 32].
This paper is a tutorial on performance measurement in BCI studies, with an intended audience of graduate students or other researchers entering a new discipline. The paper is organized in a series of notes and checklists designed for different types of BCI research; the types are defined in the following section. Readers are invited to focus their time on the sections most relevant to their research.
One goal of this paper is to encourage standardized metric calculation within the BCI community. The recommendations here represent the consensus opinion of the authors, many of whom participated in the workshop on performance measurement at the 2013 International BCI Meeting at Asilomar Conference Center in Pacific Grove, California.
Types of BCI research
Despite substantial research efforts on improving BCIs, identifying and implementing standard performance metrics and procedures has proven elusive. Metrics for BCI performance are typically designed to capture a particular type of change implemented in the BCI system, e.g. the addition of word prediction [33] or automated error correction [34]. Additionally, some metrics are affected by the structure of the experiment, or require performance to be measured at a certain point in the BCI system. For example, in event-related potential spellers, measures of binary classification are used to quantify classifier performance-–an important first step in many of these spellers. However, these metrics may not be appropriate to capture the overall spelling performance.
While each BCI may present unique performance measurement challenges, many aspects are shared between similar types of BCI research. To group these similar BCIs, we will use a framework modified from [35]. This framework, presented in figure 2(A), divides a generalized BCI system into two modules. The first module, sometimes called the transducer, acquires physiological signals and translates them into output signals, for example a selection of one of six possible outputs. The second module, sometimes called the control interface or selection enhancement module, translates these outputs into meaningful communication and control signals. This second module often incorporates contextual information in addition to physiological signals; for example, word prediction software in a BCI for spelling [36] or intelligent object avoidance in a BCI for wheelchair control [26].

Figure 2. (A) A framework for general BCIs. (B) Examples of modules used in discrete BCI systems. (C) Examples of modules used in continuous BCIs.
Download figure:
Standard image High-resolution imageIn this work, we have chosen to consider discrete and continuous BCIs separately. Figures 2(B) and (C) shows how discrete and continuous BCIs might fit into this framework, with examples of the types of modules that might be included in each. The framework also includes separate consideration for the user of the device, and his or her experiences and perceptions. The user and the BCI together form a user–BCI system, and the characteristics of this system influence the overall acceptance and effectiveness of the BCI as a clinical technology.
The following sections contain checklists for methods reporting and guidelines for applications of metrics for performance measurement at several points in the BCI milieu. First, a short general checklist is provided, consisting of items that would otherwise appear in multiple sections. Then, discrete BCIs are covered, including separate sections for the transducer/classifier module and control interface. Next, continuous BCIs are discussed, with a focus on the transducer. Finally, a user–BCI system metric framework is presented that can be used for both discrete and continuous BCIs. Subsection headers (usually methods or results) refer to the portion of a paper to which they are relevant.
General guidelines
General: methods
Understanding the task (what the participants were asked to do) is critical to appreciating the relevance and validity of the results. Well-written methods also allow the replication of experiments and independent validation of results. Our group has compiled a basic checklist of relevant details, most of which are commonly reported in the literature, but are presented in table 1 for completeness. Separate checklists will appear for each type of BCI in the following sections.
Table 1. General checklist for methods sections.
| Item | Clarification (*s indicate further text after the table) | |
|---|---|---|
| □ | Equipment | Type of electrodes or imaging technology, amplifier, etc |
| □ | Sensors/Electrodes | Number and location |
| □ | Participants | Number, demographics and relevant medical conditions |
| □ | Experimental protocol | Length of time per subject, including training sessions, rest periods, etc |
| □ | Data quantity | Explicitly include number of trials per subject used for both training and testing |
| □ | Task timing | Include a figure* |
Task timing
Of the above list, timing deserves special mention. Time appears prominently in both the formulas for most performance metrics, and in debates about current contentious practices. We suggest the inclusion of a figure outlining the timing of the task, and making specific note of what portions of time (if any) are excluded from metric calculation. Figure 3 is an example timing figure for P300-based BCIs.

Figure 3. An example timing figure for a P300-based BCI.
Download figure:
Standard image High-resolution imageAs can be seen in the figure, we recommend including any time necessary for operation of the BCI, specifically including any pauses between characters given for the purpose of visual search or confirmation of results. This is an area of contention in the literature. Some researchers have argued that removing this time addresses a possible confound when comparing studies. The stated concern is that if the time between characters is chosen to be longer than necessary for the BCI, the performance of the BCI will be undervalued relative to even the same BCI with different parameter settings.
However, the practice of removing the pauses between characters can cause problems when comparing between modalities. If this practice becomes field-standard, BCI improvements or modalities which demonstrate performance gains through reducing or eliminating those pauses will be undervalued relative to existing systems. Examples of these sorts of modalities are already in the literature (e.g. [37]), and given that time between characters implies a practical upper-limit on speller performance, more research of this type is predicted to follow.
Regardless of the validity of either of the above arguments, fully reporting the timing of the task, and especially what portions of the task were and were not included in metric calculation, will enable re-calculation of metrics and thus cross-study comparisons.
General: results
In addition to the research-specific metrics suggested in the following sections, we recommend always including the items in table 2, which are explained in the following paragraphs.
Table 2. General checklist for results sections.
| Item | Clarification (*s indicate further text in the paper) | |
|---|---|---|
| □ | Chance performance | Theoretical and empirical* |
| □ | Confidence intervals | For each metric, esp. accuracy and correlation coefficient* |
| □ | Idle performance | Standby or 'no-control' performance* |
Chance performance
We specifically recommend reporting both theoretical chance level, e.g. 20% in a 1 of 5 task, and empirical chance performance. Empirical chance performance can be calculated by running re-labeled data through the BCI system and measuring performance. This technique is more common in other fields with large-dimensional data and few examples, such as gene expression studies, but BCI studies also often have fewer observations than features. Formal tests have been proposed using this technique [38], but a basic summary is as follows: randomly permute the class labels, then run the complete algorithm on the result—including optimization of hyperparameters following the same heuristics used with the true data. If this procedure is repeated several times, it builds a useful estimate of the classifier's ability to fit what is actually random data, and thus can give an estimate of how relevant a result is. If this procedure is followed, the comparison between theoretical and empirical chance performance forms a sanity check on the system. The two values should be close to one another; a dramatic deviation may be an indication to the researcher to double-check algorithms, particularly those related to cross-validation and parameter optimization.
Confidence intervals
We note that any performance metric is calculated on finite data, and can thus be considered simply one observation of a random variable related to performance. Closed-form equations for confidence intervals may not be available for all metrics. However, the equations are available for the most common metrics for both discrete and continuous BCIs, accuracy (a binomial random variable) and correlation coefficient (see e.g. [39]). Confidence intervals can aid readers in the interpretation of results, and in some cases can be used in the calculation of performance metrics as well [21].
Idle performance
In comparison to traditional input devices, BCIs are much more prone to unintentional activation because they require no volitional movement. This problem, sometimes called the 'Midas Touch' or 'no-control' problem, has been receiving recent attention in the BCI literature. At present there exists no standard way to report this performance, partly because different modalities call for different strategies. Regardless, this performance is important clinically, and we recommend reporting idle performance. Simple metrics such as number of unintentional exits from standby mode in a particular timeframe, paired with the average time to intentionally exit standby, are useful pieces of information. As the field evolves, more formal metrics are likely to arise.
Discrete BCIs: transducer
Metrics for measuring transducer performance quantify the outputs themselves, not the process by which the output was created. These metrics are therefore an obvious choice for a direct selection BCI. Research done on the transducer typically focuses on improving classifier performance, often through signal processing, machine learning, or alternative stimulus presentations. However, discrete metrics may also be appropriate for certain continuous BCIs with discrete control interfaces. As these systems share characteristics of both discrete and continuous BCI systems, researchers working in this area may find both sections relevant to their work.
Methods
We recommend reporting the metrics presented in table 3.
Table 3. A methods checklist for discrete BCIs.
| Item | Clarification (*s indicate further text after the table) | |
|---|---|---|
| □ | Time per selection | Time per selection and time per correct selection* |
| □ | Selection method | Direct selection versus cursor-based selection |
| □ | Timing heuristics | E.g. method for choosing number of sequences in P300 BCI, dynamic stopping criteria in stimulus-based BCIs |
Time per selection
Reporting the details of task timing (see General: Methods) should help clarify this measure, but papers should be explicit as to whether this is time per correct selection or time per any selection. While the former can provide a measure of the overall BCI performance, many metrics depend on the latter. We recommend reporting both.
Note that while traditional P300- or steady-state visual evoked potential-based BCIs may have a set time per selection, other modalities and techniques (e.g. cursor-based selection and dynamic stopping criteria) have a variable time per selection.
Results
Many metrics are available to measure the performance of a discrete transducer. In a recent survey of discrete BCIs for communication [30], the two most commonly reported metrics were accuracy and bit rate, often calculated using Wolpaw's ITR formulation [40]. We recommend reporting both of these quantities, as noted in table 4.
Table 4. A results checklist for discrete BCIs.
| Item | Clarification (*s indicate further text after the table) | |
|---|---|---|
| □ | Accuracy | Include confidence bounds, note calibration timing* |
| □ | Bit Rate | Mutual information if possible, ITR if not* |
Accuracy
Firstly, as was mentioned above (in General: Results), all observed performance can be considered a single observation of a random variable. Accuracy follows the well-studied binomial distribution. Thus, confidence bounds on accuracy can and should be calculated using common statistical functions for parameter estimation. If separate accuracies are allowed for either each class or each target-outcome pairing, then each of these accuracies must also be estimated, typically from a much smaller dataset.
Secondly, discrete transducers often work best with calibration data taken on the same day as classification is performed. Authors should indicate if same-day calibration was performed, and otherwise include timing details in their experimental protocol.
Bit rate/information transfer rate
Information throughput is often sought after as an objective measure of the performance of a BCI. Since the full mutual information calculation from Shannon's channel theory [41] is impractical for many discrete BCIs due to data scarcity [30], most BCI research uses an approximation known as the ITR. ITR was defined by Wolpaw in [40] (see equation (1)), by simplifying mutual information based on several assumptions. The formula for ITR is:

where B is ITR in bits per second, c is the time per selection (as per General: Methods, we recommend including time between characters), N is the number of possible choices, and P is the probability that the desired choice will be selected, also called the classifier accuracy. ITR may also be presented in bits per symbol by removing the 1/c term.
ITR is only equivalent to mutual information under the following assumptions: (i) BCI systems are memoryless and stable discrete transmission channels; (ii) all the output commands are equally likely to be selected; (iii) the classification accuracy is the same for all the target symbols; (iv) the classification error is equally distributed among all the remaining symbols. Strictly speaking, ITR cannot apply to those BCI systems that do not meet the above requirements [29]. In practice, BCI systems typically violate several of these assumptions, notably those of uniform selection probability and uniform classification error distribution. Therefore, researchers are encouraged to be careful in reporting ITR, especially when using ITR for comparisons between different BCI systems.
We recommend reporting ITR only when circumstances prevent a full mutual information calculation. The ways in which the BCI being studied violates the ITR assumptions should also be included. Moreover, we do not recommend using ITR to optimize BCI performance, as ITR is a theoretical measure and tracks poorly with achieved performance. Other metrics presented in the following section are more relevant to the user and better reflect achieved performance.
Discrete BCIs: control interface
Research focusing on the control interface includes work such as integrating predictive spellers into a BCI [33, 36], but also concepts such as symbolic communication and selection enhancements similar to the T9 texting interface used on early cell phones [42]. Other techniques, such as dictionary-based classification or language models [43–45], could be considered control interface enhancements, even though they inform transducer decisions, because they depend on the semantic meaning of the selection. Methods reporting for these studies is very similar to those at the transducer level, and will not receive an individual section.
Results
Metrics that include the contribution of the control interface are a more recent development in BCI literature, though some metrics for similar performance appear in the literature of the text entry field. Here, we present a brief summary and a few notes on two BCI-specific metrics: Efficiency and BCI-Utility.
Efficiency
The efficiency metric [46] evaluates the performance of a BCI system as a combination of the contributions of the transducer, which recognizes user's intentions and classifies them into logical symbols (LSs) and the control interface, which translates LSs into semantic symbols (SSs) finally mapped to the end control.
It starts from the evaluation of classification performances by means of the extended confusion matrix (ECM), a N x (N+1) matrix where the N LSs to be classified (rows), those actually classified (columns) and those undetermined (abstentions, (N+1)th column) are stored. An example of ECM with four different LSs, A, B, C and D, is reported in [46]
In general, a LS can be assigned to an UNDO character to be selected if the wrong symbol is classified. To maximize the Efficiency, the UNDO could be assigned to the least error-prone LS.
A cost can be assigned to misclassifying an LS, in terms of the further steps needed to correct them: for example, assuming that error rates on LSs have the same order of magnitude, in a classical spelling task, two additional selections are needed to delete the error and reselect the desired character, while an abstention requires only one additional selection. Hence it is possible to quantify the loss of information due to misclassifications in terms of the expected additional mean cost occurring when attempting to generate each LS; these costs are stored in a SuperTax (ST) vector with elements as shown in equation (3).

Finally if the probability of occurrence of each LS  is known, the mean expected selection cost
  can be computed, see equation (4): it represents the mean number of classifications required to generate a correct LS:

where  depends on the LSs to SSs encoding strategy: for example, it changes if the user spells in Italian or English.
If any element of the ST vector is equal or greater than one, for example when the error rate on an LS is greater than 50%, the metric will not converge and the communication will be meaningless because it will be affected by too many errors. This may occasionally cause problems with calculating this metric on small datasets [30].
The Efficiency of a BCI system is inversely proportional to  .
.
The main benefits of the Efficiency are:
- (1)The contributions of the transducer and the control interface are considered separately, by means of the ECM and the error correction strategy. This means that it is possible to simulate different BCIs by adapting different control interfaces to the same transducer in order to choose the best-performing system according to the final application.
- (2)Errors can be weighted differently according to the final application: an error when using a BCI to drive a wheelchair has stronger consequences than in a spelling application. This allows evaluation of the performance of real world BCIs.
- (3)It is possible to predict if the performance of the system will converge and communication will be possible [47].
Utility
The aim of the Utility metric [48] is to measure the average benefit achievable with a BCI. It is driven by a very intuitive concept: the more benefit a system gives, the more useful the system is.
For a discrete BCI device, we may observe that a benefit (penalty) is obtained when the desired (wrong) target is reached. Under this assumption, it was shown [48] that the Utility for a discrete-BCI can be formulated as

where bk is kth gain achieved when the kth target is reached and Δtk is the time passed since the previous target was reached. The formulation can be interpreted as the ratio between the average benefit and the average time needed to get it. Therefore, Utility is maximized when the maximum benefit is obtained in the shortest interval of time. This interpretation makes the U metric an intuitive choice when two BCI interfaces have to be compared.
In practice, computation of Utility requires the definition of two quantities (benefit and time). Time has been addressed in other parts of this article (General: Methods), but the benefit term can seem to be a possible source of contention. Indeed this term adds flexibility and facilitates comparison with other metrics presented in the literature. Two examples:
- One could assign a positive benefit (+1) for any selected correct target. In this case, it easy to show that U measures the average number of correctly selected target per unit of time. Within this choice, U has the unit of 1/time and is the inverse of 'time per correct selection'.
- Alternatively, the benefit could coincide with the information conveyed when the correct target is selected. For a speller, assuming equal probability among (N-1) letters, the conveyed information will be bL = log2(N − 1). In this case, with the same BCI as the previous example, U has the units of bits/time and thus provides a measure directly comparable with ITR.
More interestingly, Utility can be linked to the performance of the classifier (i.e., to its accuracy). This relationship is interface-specific and it has been derived in closed form in a few cases only. For example, for a BCI speller interface (see [48] for interface details) it was shown that

where c is the duration of a trial, p is the classifier accuracy, and b is the benefit measurement unit (e.g., 1 in the case of letters, bL in the case of bits). When an automatic error correction system is added, the metric becomes

where rE and rC are the recall from error and from corrected letter, respectively. Interestingly, if we want to compare a speller interface with and without automatic error correction, we can compute the ratio of equations (6) and (7). In this ratio the benefit terms cancel out regardless of how they are defined.
As a final remark, if the equations (6) or (7) are employed, the experimenter should be aware that their validity is strictly related to a specific design of the interface. Conversely, equation (5) has general validity.
Continuous BCIs
Some BCIs offer continuous control over the position of one or more end effectors or joints. A typical task is 'center out' cursor movement acquiring radial targets or targets distributed through the workspace [4, 31, 32, 49–54]. Other tasks would include continuous reconstruction of joint angles [55], or isometric force [49]. An emerging task is control of a prosthetic arm with multiple degrees of freedom [3, 56, 57].
The metrics in this section are only appropriate if the task (as well as the BCI) is continuous. A cursor that selects from one of four walls is performing a discrete task and performance may be better evaluated as a discrete classifier. One rule of thumb for whether a task is continuous is whether the end effector can select anything within its range of motion. For example, if the select signal is a dwell time, the cursor should be able to select any point in the workspace, even if not all points are tested. Similarly, if one is attempting to reconstruct grasp aperture, a range of final grasp apertures should be included in the training and test sets.
Methods
Task reporting is important for all BCI studies, but critical for continuous BCIs. Continuous control is difficult to measure, but including the elements in table 5 will enhance the interpretation of the study.
Table 5. Methods checklist for continuous BCIs.
| Item | Clarification (*s indicate further text in the paper) | |
|---|---|---|
| Task geometry | ||
| □ | Degrees of freedom | Input and output* |
| □ | Size and starting position | Including both target and end effector (cursor, limb) |
| □ | Distances between targets | Specify edge-to-edge or center-to-center |
| □ | Units for all dimensions | Per cent of workspace, pixels, mm, or visual degrees |
| End effector behavior | ||
| □ | Control Timing | Time when cursor leaves user control, if any (e.g. does the cursor reset automatically |
| after a target is selected) | ||
| □ | Method of selecting targets | E.g. dwell time or separate selection signal |
| □ | Behavior of other targets | Are all other targets inactive, or is the user allowed to make errors? |
| □ | Speed gain settings | Linkage between neural signal and effector speed |
| Feedback characteristics | ||
| □ | Form of online feedback | What controlled the cursor/effector during the session? |
| □ | Latency | Lag between neural signal and resulting feedback |
| □ | Online or offline | Was online feedback provided to the user?* |
Degrees of freedom
While BCIs aim to provide a replacement for impaired motor function, the number of degrees of freedom is typically dramatically lower than the replaced system. The degrees of freedom of a continuous BCI system should be reported, both the number of independent or loosely-correlated input features, and the number of dimensions of the output which can be controlled. Additionally, the definition of degree of freedom used should be included in the report. Ideally an output degree of freedom would be the full control of a scalar output, i.e., the ability to both move in either direction and to stop when desired.
Online or offline
A final, critical piece of information for methods sections is how feedback was presented to the user. Particularly when researchers are choosing between different candidate control algorithms, the algorithms may be compared 'offline' using prerecorded neural data. Papers should always include what feedback was given to the user, and clearly indicate if the performance shown is online or offline in nature. While offline comparisons are useful, they do not necessarily predict online performance. For example, offline analyses may suggest large bin sizes, when the latency these bin sizes introduce actually lowers online performance by making the cursor less responsive to the user's error corrections [58].
Results
Many metrics are available to measure Continuous BCI performance. Depending on whether the study is online or offline, different metrics may be more appropriate. This section will present notes on several of the most popular metrics in this area: correlation coefficient (and a few alternatives), accuracy or per cent correct, and Fitts's law.
Correlation coefficient
The most commonly-used offline performance metric is Pearson's correlation coefficient, ρ. Correlation coefficient can be an informative metric, for example one can quickly check if an intracortical implant is recording from task-relevant neurons. However, there are two important caveats. First, the correlation coefficient is scale invariant. This means the cursor can miss the target dramatically and still generate high ρ values provided the sign of the actual and predicted movements match. Figure 4 shows an example of a sinusoid and a sinusoid with continuously decreasing amplitude. The signals are correlated with ρ = 0.87, despite having remarkably different shapes. This property could for example obscure the effects of global firing rate nonstationarities, which tend to simply increase or lower the amplitude of the predicted movement [52]. Second, if a decoder simply generates a signal that oscillates along with the trials, it can also generate a high ρ value. This may imply that the decoded signal has information about target position when it actually only has information about movement onset. In general, correlation coefficient may tend to minimize differences in performance between different algorithms, even for the same task.
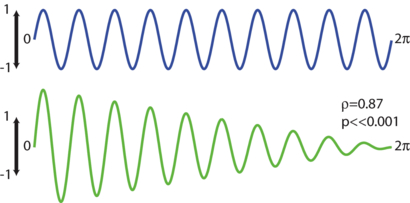
Figure 4. Two simulated sinusoids, one decaying in amplitude, and a demonstration of a remarkably high correlation coefficient.
Download figure:
Standard image High-resolution imageWe suggest correlation coefficient be calculated and reported, but recommend also reporting scaling-dependent metrics such as mean square error. There are other measures of continuous trajectories that have been applied [59] and could be of value in assessing BCI performance, including mean-integrated-distance-to-target [58], distance ratio (also referred to by some groups as movement efficiency or movement inefficiency), orthogonal direction changes, movement direction changes, target exits per selection, and variations of Fitts's law. These metrics may better capture the continuous aspects of BCI performance.
Accuracy (per cent correct)
While this is the first metric typically reported, it should be noted that it is highly dependent on task parameters such as target size and dwell time. Consequently, this is less a performance metric, but more an indication that the task was well-calibrated for the subject and modality.
Fitts's law
Potentially the most robust and informative performance metric for continuous tasks is calculating an overall bit rate using Fitts's law [31, 32]. This is also the guiding principle for the ISO standard 9241 [60] on evaluating computer mice. Fitts's law involves calculating the 'index of difficulty' of a particular movement according to equation (8), in bits. This is related to the ratio of the distance traveled (D) to the target width (W) as shown in figure 5. One can then divide this by the trial time and average across the dataset to obtain a 'throughput' in bits per second, as shown in equation (9). According to Fitts's law, this value is robust to many parameter changes such as target width and workspace size, and can potentially enable comparisons across labs (See [32], Supp Mats). Even if not attempting a task described in the ISO standard (such as 2D center out), one can still apply the basic principle and create a performance metric based on the ratio of the total distance traveled to the acceptance window of the target.


Fitts's metrics are not appropriate without a clear selection signal, whether a click, grasp, or substantial dwell time (>250 ms). Without a selection signal, an infinitely fast random walk would have the highest performance. Using a selection signal, a related metric is 'dial-in' time, i.e., how much time did it take to select the target after it was initially touched. In one study [32], the Fitts bit rate was doubled primarily by reducing the dial in time by 89%. Certain task differences that make one task easier than another can make Fitts's bit rate incomparable between studies. For example, if the targets in one study are in open space while the others are against a hard border, the rates will be incomparable.

Figure 5. An example Fitts's law task. The dotted circle represents the cursor's starting point, the solid circle is the trial's target.
Download figure:
Standard image High-resolution imageUser–BCI System
Results
User–BCI system metrics provide a user-centric view of BCI system performance and quality. Users are an integral part of the BCI product lifecycle, and their interaction and experience determine the acceptability and viability of BCI systems. User experience (UX) principles could be employed to understand user requirements and experiences. UX provides a blueprint of user needs, emotions and experiences [61]. To assess BCI performance from the user's point of view, we propose the uFEEL framework shown in figure 6, which is comprised of four UX factors: Usability, afFEct, Ergonomics, and quality of Life.

Figure 6. The uFEEL framework for user–BCI system measurement.
Download figure:
Standard image High-resolution image
Usability
Usability is the extent to which a product can be used to achieve specified goals with effectiveness, efficiency and satisfaction in a specified context of use [60]. Usability also includes learnability. Usability measures could be employed to assess the BCI system design metrics explored elsewhere in this paper from an end-user's perspective, such as:
- Effectiveness relates to accuracy with which a task is completed. Effectiveness represents overall BCI system accuracy as perceived by the end user. Accuracy and error rate directly influence the user's perceived effectiveness.
- Efficiency, distinct from the Efficiency metric, relates to rate and timings with which a task is completed. Efficiency of a BCI system represents the overall BCI system speed, throughput and latency as perceived by the end-user. For instance, Utility and the Efficiency metric directly quantify elements of the efficiency of BCI systems.
- Learnability relates to ease with which a system could be learned and used. Learnability applies to both end-user and caregiver. Notes on learnability and usability in general can be found in [62].
- Satisfaction represents the positive attitude of the user toward the use of the system. User satisfaction can be measured using ratings scales or qualitative methods.
Affect
Affect corresponds to emotions and feelings. In terms of BCIs, it can relate to how comfortable the system is, especially for long durations, and how pleasant or unpleasant they perceive the audio/video stimuli to be. Normally, rating methods [63] and qualitative techniques are used to assess emotions. Since users in a locked-in state may not be able to provide such affective ratings easily (if at all), other physiological measures could be used. For example, EEG event-related potentials and spectral features, galvanic skin responses, or heart rates could be used to objectively assess user fatigue, valence, and arousal levels [64].
Ergonomics
Ergonomics is concerned with the interactions between humans and their surroundings. Some sub factors include:
- Cognitive Task Load is a multidimensional construct that represents the load on the user's memory. For instance, in visual BCI systems, the screen used for presentation (its size, flashing lights, and location of symbols), and the information used (how stimuli are presented, accessed, and controlled) creates a work load. For patients, calibration and training of the BCI system may also increase their cognitive load, creating discomfort and fatigue. To assess cognitive load, a subjective rating system called NASA Task Load Index can be used [65]. Additionally, physiological measures such as eye-activity, EEG ERP and spectral features could also be used to measure cognitive load objectively [65].
- Control represents the flexibility and freedom with which a user can use a system. BCI systems should, therefore, enable users to undo/correct errors, and ideally offer the freedom to go into idle or rest states.
Quality of life
Quality of life represents the overall user experience of the system's usefulness and acceptability and its impact on the user's well-being.
- User's ROI (Return on Investment) is an economic measure of the perceived gain attained from a product. A high ROI represents a high utility product.
- Overall Quality of Experience represents an overall assessment of user experience. For instance, the level of improvement in a patient's life or the video gamer's experience with BCI-controlled video games. The overall user experience could be evaluated using rating or open ended questions.
Conclusion
Performance measurement is a surprisingly difficult task, and often a source of contention between laboratories and researchers. This work has presented guidelines and checklists for performance reporting for many different types of BCI research, highlighting the variety of research currently ongoing in the field. While we cannot claim to have produced a universal guideline or handbook for performance measurement in BCI, we hope that the intended audience will find this paper a useful primer on the topic.
Acknowledgments
JEH and all the workshop participants would like to acknowledge the support for the BCI Meeting and student travel from the National Institutes of Health (NIH), grant #1R13DC12744-1 from the National Institute of Deafness and other Communication Disorders (NIDCD), the National Institute of Child Health and Human Development (NICHD), the National Institute of Neurological Disorders and Stroke (NINDS) and the National Institute of Biomedical Imaging and Bioengineering (NIBIB). The opinions expressed here are those of the authors and do not represent the opinions of NIH, NIDCD, NICHD, NINDS or NIBIB.