
Abstract
Objective. Functional electrical stimulation (FES) approaches often utilize an open-loop controller to drive state transitions. The addition of sensory feedback may allow for closed-loop control that can respond effectively to perturbations and muscle fatigue. Approach. We evaluated the use of natural sensory nerve signals obtained with penetrating microelectrode arrays in lumbar dorsal root ganglia (DRG) as real-time feedback for closed-loop control of FES-generated hind limb stepping in anesthetized cats. Main results. Leg position feedback was obtained in near real-time at 50 ms intervals by decoding the firing rates of more than 120 DRG neurons recorded simultaneously. Over 5 m of effective linear distance was traversed during closed-loop stepping trials in each of two cats. The controller compensated effectively for perturbations in the stepping path when DRG sensory feedback was provided. The presence of stimulation artifacts and the quality of DRG unit sorting did not significantly affect the accuracy of leg position feedback obtained from the linear decoding model as long as at least 20 DRG units were included in the model. Significance. This work demonstrates the feasibility and utility of closed-loop FES control based on natural neural sensors. Further work is needed to improve the controller and electrode technologies and to evaluate long-term viability.
Export citation and abstract BibTeX RIS
1. Introduction
Functional electrical stimulation (FES) approaches for limb control typically operate using open-loop stimulation sequences and are unable to adapt automatically to muscle fatigue and perturbations [1]. There is a growing effort to incorporate sensory feedback into neural prosthetic systems to improve the stability and accuracy of complex, multi-joint functions [2, 3]. An FES controller that uses sensory feedback could minimize muscle activation [4], compensate for fatigue [1] and adapt to varying loads. Recent efforts have used a wide variety of external sensors to monitor limb state including position sensors [5], goniometers [6], force sensors [7–11], accelerometers [7–9, 11, 12], gyroscopes [7, 8, 11] and other sensors [11]. Challenges with the reliability, positioning and mounting of external sensors have limited the development of continuous feedback control of FES systems [13, 14]. Furthermore, potential users desire assistive devices that have minimal visibility or are implanted, to limit drawing additional attention towards their condition [15–17]. A direct interface with the nervous system provides an alternative way to extract sensory information without the limitations of external sensors [2].
Sensory signals from peripheral nerves have been used to provide feedback in closed-loop FES applications such as footdrop [18, 19], ankle control [20] and hand grasp [21]. The use of peripheral afferent nerve signals takes advantage of the body's various natural sensors. Recordings from peripheral nerve cuffs, as in [18, 19, 21], have been shown to be safe and stable [22]. However, nerve cuff recordings are subject to significant spatial and temporal averaging of signals emanating from a large number of nerve fibers, which reduces sensitivity and specificity of the information conveyed [18]. Discrimination of signal sources arising from individual fascicles within a nerve cuff may be possible [23]; however identifying different afferent and efferent signals remains a challenge. Furthermore, multiple nerve cuffs may be required to yield sensory signals from an entire limb. For complex, multi-joint activities such as locomotion or reaching and grasping, multiple sensory inputs are needed to provide adequate feedback.
Dorsal root ganglia (DRG) are an alternate location for obtaining natural sensory information. At DRG, the cell bodies of thousands of sensory axons are packed together where they enter the spinal cord [24]. Since the 1970s, wire electrodes have been inserted chronically into DRG to record and study the activity of muscle, cutaneous and joint afferent fibers in freely moving animals [25, 26]. In recent years, researchers have progressed to inserting arrays of microelectrodes for recording simultaneously from over 100 neurons in the lumbar DRG [27–31]. This approach has been expanded to include studies with microelectrode arrays in cervical DRG to monitor upper limb afferent fibers [32] and in sacral DRG to monitor pelvic afferents [33]. Recording from populations of sensory afferents has enabled decoding of limb position in acute [29, 31, 32] and chronic studies [28, 29] with simple regression models. Access to this abundance of sensory information at a single location provides a significant benefit over recording from multiple peripheral nerve locations or with multiple external sensors.
Our primary goal in these experiments was to determine if kinematic feedback decoded from DRG unit activity can be used to perform closed-loop control of FES enabled stepping. In this paper we demonstrate real-time closed-loop FES control of a hind limb utilizing limb position estimates decoded from the spike counts of DRG neurons. We successfully generated multi-state walking patterns with a closed-loop controller that discarded stimulation artifacts and responded appropriately to perturbations in the desired limb path. Our secondary goal was to evaluate the degree to which FES may degrade estimates of limb state obtained from recorded neural signals. Our results indicate that while stimulation artifacts can contaminate signals recorded from DRG neurons, there was not a significant impact upon limb position estimates. Preliminary results have been presented in poster form at conferences [34, 35].
2. Methods
2.1. Experimental setup
The University of Pittsburgh Institutional Animal Care and Use Committee approved all procedures performed for this study, which utilized four adult, male cats. Each animal was initially anesthetized with a ketamine (10 mg kg−1)–acepromazine (0.15 mg kg−1) mixture. The cat was subsequently intubated or a tracheotomy was performed to facilitate maintenance of anesthesia using isoflurane (1–2.5%). Respiratory rate, end-tidal CO2, rectal temperature, O2 perfusion in the tongue or ear, heart rate and blood pressure were monitored continuously on a vitals monitor (Advisor, SurgiVet) and maintained within normal ranges. Intravenous lines were inserted into the cephalic veins bilaterally for fluid infusion (3–7 mL kg−1 hr−1). One limb received a one-to-one ratio of lactated Ringer's solution and 5% Dextrose while the other limb received Plasmalyte. A single-lumen polypropylene catheter (3.5 Fr, Sovereign) was inserted into the urethra to drain the bladder.
After completion of all experimental objectives, as detailed below, each cat was euthanized with an intravenous dose of potassium chloride (10 mL of 2 mEq mL−1) while deeply anesthetized.
2.2. Surgery and electrode placement
One to three stimulating electrodes were inserted into each of the primary flexion and extension muscle groups of the left hind limb joints: anterior sartorius (hip flexion), semimembranosus (hip extension), biceps femoralis (knee flexion), vastus lateralis (knee extension), tibialis anterior (ankle flexion) and lateral and/or medial gastrocnemius (ankle extension). See figure 1(a) for a diagram of the overall setup and the major muscle groups targeted for stimulation. Each muscle was exposed during surgery and electrodes were placed on or in the muscle belly. When possible, we used electrical stimulation of the muscle surface to locate the motor point, characterized by having a low threshold and strong recruitment. Most muscle electrodes were patch electrodes (epimysial) anchored to the fascia via 3-0 silk suture. Intramuscular electrodes were used to access deeper muscles. The patch and intramuscular electrodes were made in-house using multi-stranded stainless steel wire (AS 632, Cooner Wire Company). In one experiment commercial intramuscular electrodes (Permaloc, Synapse Biomedical) were inserted in each muscle with a 16 gauge needle. A needle inserted percutaneously in the abdomen or ipsilateral foot served as the return electrode.

Figure 1. (a) Setup diagram. A MultiPort Utah microelectrode array in the L6 and L7 DRG monitored sensory afferents from the left leg. Neural signals were acquired by a TDT RZ2 processor and sent to a PC running LabVIEW software to estimate the limb position in real-time. State estimates were updated every 50 ms and sent to a finite state controller also running in LabVIEW, which controlled the FES system. FES muscle electrodes targeted the anterior sartorius (AS; hip flexion), semimembranosus (SM; hip extension), biceps femoralis (BF; knee flexion), vastus lateralis (VL; knee extension), tibialis anterior (TA; ankle flexion) and lateral or medial gastrocnemius (L/MG; ankle extension). A haptic robot generated forces resisting extension of the limb, to simulate ground contact mechanics. A motion capture system and active joint markers on the iliac crest, hip, knee, ankle and toe also tracked the position of the limb. (b) Limb schematic and four-state space controller diagram. The left hind limb is shown with the forward direction to the right. The limb state was defined in one of two different reference frames: a joint-based frame using intersegmental angles for the hip (φH), knee (φK) and ankle (φA) joints and an end point frame using the toe position relative to the hip in polar coordinates (R, θ). The controller state transition regions were defined in the plane of movement (boxes 1–4, representing toe lift, swing initiation, end swing and toe strike). The trace shows the path of the toe through two stepping cycles in one trial.
Download figure:
Standard imageThe placement of each muscle electrode was inexact. Non-target muscles may have been recruited when targeting ankle extension (such as soleus), ankle flexion (such as extensor digitorum longus), knee flexion (such as gracilis) and hip flexion (such as psoas). Our goal in these experiments was not to precisely replicate normal limb movements during locomotion but to obtain sufficient muscle recruitment such that the limb could be moved through the normal range of motion in a stepping-like pattern. These electrode placements and stimulation protocols were sufficient to meet that objective.
After revealing the spinal laminae by reflecting the paraspinal muscles overlying the L5-S1 vertebrae, a laminectomy was performed to expose the lumbar DRG (L5-S1) on the left side. The cat was placed in a custom frame, which supported the torso, spine and pelvis while allowing the hind limb to move freely. Microelectrode arrays (90 channel MultiPort Utah Array, Blackrock Microsystems) were inserted into the L6 and L7 DRG (10 × 4 and 10 × 5, respectively) with a pneumatic inserter (Blackrock) and the wire bundles were secured to the dura with suture. A bone screw in the iliac crest was used as a ground electrode, and a recording reference wire was placed near the spinal cord.
2.3. Neural and kinematic signal recording and processing
Neural signals from the microelectrode arrays were recorded with a signal processing system (RZ-2, Tucker Davis Technologies) at 25 kHz and band-pass filtered (300–3000 Hz). An amplitude threshold was set on each electrode channel above the noise floor and a spike event was stored each time this threshold was crossed. A spike event consisted of a time stamp and a snippet of voltage data representing the spike waveform (0.7–1.2 ms duration). Spike sorting of the waveforms on each channel was performed on the RZ-2 processor using principal components analysis and K-means clustering (K set to 2). Before attempting FES, the clusters were manually verified and combined into a single cluster when the clusters represented the same afferent or both clusters contained multi-unit activity.
During FES, stimulation artifacts were removed using a dual approach. Most artifacts were automatically rejected by the clustering algorithm. In addition, a simple artifact rejection algorithm was implemented in the RZ2 processor, as described in [34]. Briefly, if the sum of spike-threshold crossing events across all channels during a 400 µs detection window exceeded a set limit (54 channels; 60%) then all events in a corresponding 2 ms rejection window were excluded from the spike count vector. Since active electrodes were stimulated synchronously at 30 Hz, this rejection window retained over 90% of time available for neural decoding.
For each sorted unit, after artifact rejection, the RZ-2 processor calculated spike counts (Ci) in 50 ms bins. A spike count vector (SCi) for each unit was generated by smoothing counts over prior time points, as indicated by equation (1):

In equation (1), v is a time index corresponding to 50 ms time bins for the spike count calculation of neuron i. This smoothing approach was selected to reduce jitter in the spike count vector.
Active LED markers were placed over the left iliac crest and the hip, knee, ankle joints and toes. The marker locations were recorded with a 6-camera motion capture system (Impulse, PhaseSpace Motion Capture), sampled at 120 samples per second. A custom LabVIEW (National Instruments) program was used to calculate the hip, knee and ankle joint angles from the marker locations in real-time. As in previous studies, the limb position was represented in two reference frames (figure 1(b)) [29, 36]. Intersegmental angles were used to measure the angular position of the hip (φH), knee (φK) and ankle (φA) joints. Segment lengths for the femur, shank and foot were measured and combined with the joint angle measurements to determine the position of the toe relative to the hip. We also measured the toe position relative to the hip expressed as a vector in polar coordinates. The length of the vector was the hip to toe distance (R) and the orientation of the vector (θ) was measured with respect to the horizontal. For simplicity, we included the three joint and two end point position variables in a single state vector (Xm; m = 1, 2, 3 for hip, knee and ankle angles, m = 4, 5 for hip-to-toe distance and orientation angle).
Both kinematic representations of the hind limb and the smoothed neural spike count vectors were streamed via User Datagram Protocol to the finite state controller (see below) at 50 ms intervals. A haptic robot (Phantom Premium 1.5HF, Sensable Technologies Inc.) was attached to the plantar surface of the left foot and programmed to create a virtual floor, rendering ground reaction forces during the stance phase of a step cycle (transition from state 4 to state 1 in figure 1(b)).
2.4. Limb-state estimator and FES controller
A multivariate linear regression model was used to estimate the limb position as a function of the ensemble neural spike counts [28, 29]. All observed DRG units were included in the regression model. The estimated hind limb joint angles ( ; m = 1, 2, 3 for hip, knee, ankle) and the hip-to-toe distance and angle with the horizon (m = 4, 5) were obtained from equation (2):

In equation (2), SN refers to the set of N units that were sorted in real-time by the clustering algorithm and  are the least-squares estimates of regression coefficients.
A CWE stimulator (FNS16) was used to drive muscle electrodes in a monopolar configuration. This 16-channel stimulator allowed stimulus parameter updates in 'real-time' using an RS-232 interface. We developed a custom finite state controller using LabVIEW that modified the stimulation parameters based on the location of the hind limb end point. The controller used the actual toe position (Xm), measured by the motion capture system, or the estimated toe position ( ) based on the neural recording to update the stimulation parameters. In addition, the controller could be programmed to run in an open-loop mode with each stimulation state operating for a fixed duration.
The controller operated in one of four distinct states based on the current position of the toe. The four states corresponded to different phases of the step cycle. In state 1, the controller stimulated the ankle and knee flexor muscles to lift the leg. In state 2, the hip and ankle flexors were activated to move the foot forward. In state 3, the hip flexors remained active while the ankle and knee extensor muscles were stimulated to plant the foot on the virtual floor rendered by the haptic robot. Finally, in state 4, the hip, and ankle extensors were stimulated to pull the leg backwards (against the virtual ground).
State-switch regions were defined as boxes in the four quadrants of the expected range of motion of the hind limb. As needed, the dimensions of each state region box were adjusted to match the range of motion that could be achieved during each phase of the stimulation cycle. At each time point (50 ms increments) the position of the toe was evaluated and a state change was triggered when the toe position entered one of the pre-determined state-switch regions (see figure 1(b)). This closed-loop control scheme cycled through different stimulation states, resulting in a stepping motion.
To configure the stimulation parameters, we first determined the threshold current for muscle twitch recruitment for each electrode. Next, groups of muscles were stimulated simultaneously to generate coordinated limb movements for each phase of a stepping cycle. Stimulation amplitudes (0.5–20 mA) were adjusted manually to achieve the desired movement. If necessary, additional wire electrodes were inserted percutaneously to improve recruitment of specific muscles. The stimulation waveforms were charge-balanced cathodal-leading stimuli with a half-amplitude recovery phase at a fixed stimulation frequency (30 Hz) and pulse width (200 µs). Current levels for each stimulating channel were controlled individually, in multiples of the respective threshold current.
2.5. Closed-loop FES control
During a training phase, the controller used the actual limb state (obtained by the motion capture system) to update the finite state controller. The stimulation parameter sequence drove the hind limb through each of the four identified gait states. This resulted in closed-loop FES control where the feedback was provided using the camera setup (see alternate feedback path in figure 1(a)). Estimates of the regression coefficients ( ) were updated every 200 ms throughout the training phase using the smoothed spike count vectors (SCi) and the recorded limb kinematics (Xm). The training phase was terminated when the estimated coefficients stabilized, which typically took 1–2 min.
Next, we used the predictions of the limb state ( ) based on DRG afferent activity as feedback for the finite state controller. Here, the estimated toe position was inferred from the observed spike counts (SCi) by equation (2) at 50 ms intervals. In the first experiment (cat I), a joint angle (
 ) reference frame was used to estimate limb position from the afferent firing rates, and used to calculate toe position. In the last experiment (cat K), the toe position in polar coordinates (
 ) was estimated directly from the afferent firing rates. For the purpose of decoding toe position during stepping, both reference frames can be used somewhat interchangeably as prior work by our group [29–31, 36] has shown that the firing rates of many primary afferent neurons correlate strongly with limb movements represented in both reference frames.
Before activating the closed-loop FES, the hind limb would be in resting position, typically hanging between states 4 and 1. When the controller was turned on, the initial target state was 1. Subsequently, the controller drove the limb from state to state to generate a complete step cycle (duration ∼2–5 s per step; see table 1). Approximately 10–15 step cycles were performed in each trial, with 5–15 min rest periods between trials.
Table 1. Summary of stepping distance and time for closed-loop controlled stepping.
| Experiment | Full cycles | Linear distance (mm) | Time (s) | Walking speed (mm s−1) | Step cycle time (s) | Step length (mm) | Swing phase duration (s) (state 1 to 4) |
|---|---|---|---|---|---|---|---|
| 'I'–-non-perturbation cycles | 57 | 5507.0 | 167.0 | 33.0 | 2.93 ± 1.32 | 96.6 ± 33.7 | 2.01 ± 1.02 |
| 'I'–-perturbation cycles | 17 | 1330.0 | 68.3 | 19.5 | 4.01 ± 2.14 | 78.2 ± 34.6 | 2.75 ± 1.20 |
| 'K'–-non-perturbation cycles | 70 | 4077.1 | 211.0 | 19.3 | 3.01 ± 1.16 | 58.2 ± 9.4 | 1.70 ± 1.10 |
| 'K'–-perturbation cycles | 24 | 1032.4 | 109.3 | 9.4 | 4.56 ± 1.65 | 43.0 ± 11.8 | 3.13 ± 1.36 |
Subsequently, we performed multiple perturbation trials in which the limb was obstructed to prevent movement to the next state transition zone. In one experiment, the foot was held manually for ≤2 s before being released. In another experiment, the haptic robot was programmed to generate a force simulating a virtual barrier for 1 s once the limb entered state 2. After that fixed time period, the virtual barrier was removed. The period of time that the barrier actually impeded the leg movement varied, as it was located between states 2 and 3.
2.6. Passive movement experiments with and without FES
An additional goal of these experiments was to examine the effects of FES on the neural signals that are recorded in the DRG. FES can produce two distinct types of artifact that can contaminate the limb-state information conveyed in the records of neural activity. The most common stimulation artifact is that produced by volume conduction of stimulation currents from the muscle to the recording electrodes. These appear simultaneously with the stimulation pulses applied to the muscle. A second type of stimulation artifact may be produced by sensory fibers recruited directly by electrical stimulation applied to the muscle. This type of artifact appears at a short latency (∼2–5 ms) corresponding to the propagation delay from the stimulation site to the DRG. Since this neural activity is produced by stimulation, it does not necessarily carry information about the actual movement of the leg. Although we were successful at generating closed-loop FES control using DRG recordings and artifact rejection, we performed this analysis to achieve a more thorough assessment of neural signal quality in the presence of muscle stimulation.
We examined the effects of stimulation on DRG unit responses during passive movements of the leg generated by a robotic arm (VS-6556E/GM, DENSO Robotics) attached to the base of the foot. DRG neural responses were recorded in two conditions: robot and robot + FES. During the robot + FES condition, electrical stimulation was applied continuously to the muscle electrodes in the same pattern and amplitudes used during closed-loop FES while the robot moved the leg. The robot arm produced the same leg movements during the robot and robot + FES conditions and allowed for a direct comparison of the neural activity generated by movement alone and movements produced in the presence of FES. The passive movements consisted of ramp-and-hold flexion–extension movements (e.g. between states 1 and 3 in figure 1(b)) or complete step cycles (e.g. all four states in figure 1(b)).
A multi-step process was followed to examine the effect of electrical stimulation on observed DRG unit responses with respect to the position and velocity of the toe relative to the hip. Only the hip-to-toe distance was used in this analysis as this kinematic parameter is highly correlated with the joint angles during these simple movements, providing a simple, yet characteristic representation of the whole-leg movements. The DRG neural spike activity was sorted offline in OpenSorter (TDT, Inc.) after each experiment. Robot + FES trials were sorted based on units identified during sorting of robot trials. Stimulation artifacts and DRG units that did not appear during robot trials were marked as outliers in robot + FES trials and excluded. DRG unit firing rates were calculated by convolving spike times with a 150 ms triangular window, as in [29].
We define the terms 'position gain' and 'velocity gain' to represent the response of a DRG neuron to changes in leg position and leg velocity. The position gain of each DRG unit was estimated by the difference in the mean firing rate between the flex and extend positions of movement, when velocity was near zero, divided by the mean change in the toe position. The velocity gain of each DRG unit was estimated by the difference in the mean firing rate between states when the limb was moving (|velocity| > 0) and hold states (velocity ≈ 0) divided by the mean difference in velocity. Figure 2 shows example limb movements and firing rates that were used for each gain calculation. Units without consistent polarity in gain across trials or an average correlation coefficient (ρ) between firing rate and the kinematic parameter less than 0.3 were excluded. These steps were performed to remove units that were not related to limb movement from the analysis.
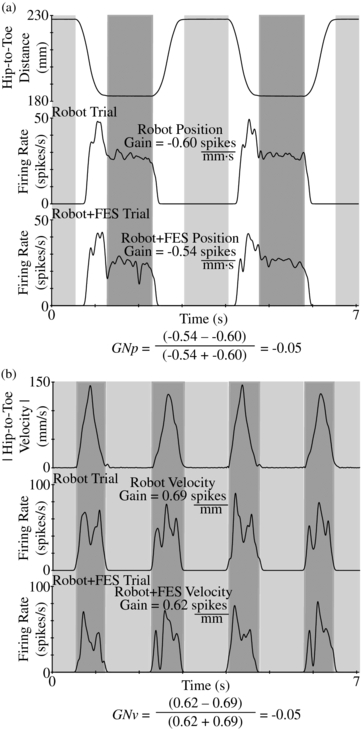
Figure 2. Example position and velocity gains. In (a) the response of an example DRG unit (L7; I experiment) to the limb position is given during trials of robot and robot + FES, leading to the GNp. Light and dark regions indicate the extension and flexion periods that were used in the GNp calculation. Similarly, in (b) the firing rate of an example unit (L6; I experiment) and the velocity magnitude are shown, leading to the GNv. Light and dark regions indicate the hold states and movement periods.
Download figure:
Standard imagePosition and velocity gain values obtained from the robot and robot + FES conditions for each unit were compared using the 'gain normalization' metric computed with equation (3):

This gain normalization value (GN) yields one of three relationships: units with GN near 0 did not have a change in the unit response during electrical stimulation; units with GN near +1 had a higher effective gain during stimulation; and units with GN near –1 had a higher effective gain without stimulation. Subscripts of 'p' and 'v' denote GN for position and velocity, respectively. For the example units of figure 2, each GN was just below zero, indicating a slightly lower gain during stimulation.
The previous analysis examined the effects of stimulation on individual neurons. We also examined the global effects of stimulation on neural population decoding. Repeated multivariate linear regressions were performed on each robot + FES and robot trial in Matlab (Mathworks) to estimate the leg position from the recorded activity, for different numbers of DRG units as an input. Sorted units in each trial were ranked by their individual correlation coefficient to the hip-to-toe distance. Starting with the best unit and increasing up to all units in a trial, linear regression was performed to fit unit firing rates to the position. For robot + FES trials, regression estimates of hip-to-toe distance were repeated for several alternative unit sorting methods (all snippets including stimulus artifacts in a single unit sort per channel; all non-stimulus artifacts in a single unit sort per channel; and only stimulus artifacts in a single unit sort per channel) and compared to the limb position regression estimate for the ideal unit sorting approach, with stimulus artifacts excluded and all single units sorted appropriately.
2.7. Statistical analysis
The root mean square error (RMSE), as calculated in equation (4), was used to determine the error in limb position estimates:

In (4), Pu and  refer to the measured and estimated hip-to-toe position at time u across the t data points in a trial. Confidence intervals were calculated to determine statistical differences. A p-value ≤0.05 (for a 95% confidence interval) was considered significant. Where relevant, data is reported as average ± one standard deviation.
3. Results
Four adult (0.88 ± 0.11 years) male cats (4.9 ± 0.4 kg), designated as H, I, J and K, were used in this study. We estimated limb position in real-time while rejecting stimulation artifacts and demonstrated multi-state closed-loop control of a hind limb with FES in two of these cats (I, K). In the other two cats, closed-loop FES was either not accomplished due to software errors in the controller (H) or was unsuccessful due to ineffective muscle recruitment (J). These results show the feasibility of estimating the limb position in real-time from the decoded activity of DRG units and integrating the limb position estimates into closed-loop control of FES for rudimentary locomotion. In three cats (H, I, K), the impact of electrical stimulation on DRG neural signals was evaluated. Electrical stimulation decreased the mean unit gain but not enough to have a significant effect on limb position decoding.
3.1. Real-time decoding
Real-time decoding of lumbar DRG activity was performed in two of the experiments (cats I, K). In experiment I, 129 DRG units were used in the real-time model, which estimated the angular position of the hip, knee and ankle joints ( ). The estimated joint angles and measured segment lengths for the femur and shank were used to calculate an estimate for the toe position. At the end of the 61 s training period, which had 29 complete step cycles, the limb position estimate had an RMSE of 6.4 mm. In experiment K, 124 DRG units were used in the real-time model, which used polar coordinates (
 ) to estimate the toe position. In this experiment, a 73 s training period consisting of 28 complete limb step cycles led to a final limb position estimate RMSE of 4.8 mm. The first 20 s of the training period is recreated for cat K in figure 3.

Figure 3. Demonstration of real-time regression model fitting in experiment K. In (a), the actual end point position (hip-to-toe distance) and the spike counts for two DRG units are given at the top. The regression model coefficients were updated every 200 ms, indicated by the vertical dashed lines. Regression coefficients for the two units are shown. Each new value is based on spike counts from the start of the trial to the end of the previous interval. Continuous updates to the regression model, based on updates to the coefficients for all DRG units, yield improved estimates of the end point position, at the top, and the RMS error, as shown at bottom. Each RMS error value is calculated from the start of the trial to the end of the previous interval using the current set of regression coefficients. In (b), the actual and updated regression estimates for the angle to the horizon are shown. The final RMS error for the angle ( ) was 1.3°.
Download figure:
Standard image3.2. Closed-loop control
Closed-loop FES control of the left hind leg was attempted in three cats (cats I, J and K). In cat J, insufficient muscle recruitment was achieved with the FES electrodes made in-house, which prevented an evaluation of closed-loop control. This failure led to the purchase of the commercial intramuscular electrodes utilized in experiment K. The results discussed here are from the two successful experiments.
Example step cycles and electrode combinations from cat K are shown in figure 4. The electrode locations and stimulation sequence used to control the limb position are indicated below the kinematic trace. Four distinct stimulation channel combinations were used for transitioning between the four states of the step cycle. As the foot was transitioned out of state 4, there were small oscillations resulting from contact with the haptic robot simulated floor.

Figure 4. Closed-loop FES control of the hind limb based on DRG recordings during normal and perturbed states in experiment K. The stick figures at top represent limb states at different time points, recreated from X1–3. The actual (X4; solid line) and estimated ( ; dashed line) elevation of the toe are given. At the bottom, combinations of electrode channels used to move the limb and the controller state transitions are shown (A = ankle, K = Knee, H = Hip; E = extensor, F = flexor; muscle abbreviations defined in figure 1). During the first and third steps, forward movement of the limb was obstructed (shaded gray boxes) by the haptic robot attached to the foot, which otherwise provided only a virtual floor. During each step, the FES controller successfully moved the limb through the four states.
Download figure:
Standard imageIn experiment I, a total of 74 complete FES-controlled stepping cycles were performed using DRG signals as feedback, of which 57 cycles were not impeded with a perturbation. Across six trials, 12.3 ± 9.2 cycles were performed for 64.4 ± 20.4 s per trial. Rest periods between closed-loop trials were 3.6 ± 1.8 min. In cat K, a total of 94 complete FES-controlled stepping cycles were performed, of which 70 cycles were not impeded. Across seven trials, 13.4 ± 6.2 cycles were performed for 77.6 ± 8.2 s per trial. Rest periods between trials were 16.8 ± 8.4 min. Table 1 summarizes the effective linear stepping distance and time per experiment. Partial stepping cycles, at the beginning of a trial when the limb moved to state 1 or at the end of a trial if recording was stopped before the limb returned to state 1 are not included in this summary.
A total of 20 manual perturbations were performed in cat I (1.01 ± 0.47 s average duration) and 24 automated (i.e. robot-controlled) perturbations were performed in cat K (0.76 ± 0.11 s average duration). Table 1 summarizes the effective linear stepping distance and time during perturbation cycles, per experiment. After each perturbation, the controller correctly identified that the position of the limb had not yet reached the next state. This shows that the estimates of the limb state were not influenced by the stimulation itself and were based purely on sensory neural activity associated with the actual limb position. Once the perturbation ceased, the hind limb continued to advance toward the desired state and usually completed the step cycle successfully. After 8 of the perturbations, the controller first had to force the limb to re-enter the perturbed state before continuing due to movement that occurred during the perturbation. Two successful stepping cycles with perturbation are shown in figure 4.
Across the two experiments, 3 and 20 step errors, respectively, occurred in which the limb either re-entered a state (18) or skipped a state (5) in the step cycle. These errors occurred during 18 of the full step cycles, representing an error rate of 10.7%. Eight of these step errors occurred after a perturbation, as described above. After each error the controller was always able to complete a step cycle, although in two cases there was more than 1 error before the cycle finished.
Closed-loop FES stepping cycles were performed in several trials in each experiment, with multiple cycles per trial (12.3 ± 9.2 and 13.4 ± 6.2 cycles per trial, for I and K). Within each trial, regardless of the number of cycles, a trend was typically observed for the total path length that the toe followed: cycle path lengths increased to a maximum near the mid-point of the trial before decreasing. In figure 5, the mean cycle path lengths in five equal duration periods (20% intervals) of each trial were normalized to the maximum period mean cycle path length. Path lengths for individual trials within each experiment and across all trials are indicated. Path lengths during the first periods of all trials were significantly lower than during periods 2–4 (p < 0.05). Mean path lengths during the final period were lower than but not significantly different than during the middle period (p = 0.07). These results suggest that the flexibility and recruitment of the limb increased after the start of a trial and that fatigue may have occurred later in each limb movement sequence.

Figure 5. Fatigue effects in closed-loop stepping. The path length of the toe during a complete step cycle (start and stop at state 1) was determined for all non-perturbation cycles in each closed-loop trial. The weighted average path length was determined for each of five equal duration periods spanning a trial, since the number of step cycles varied among trials. Each period-average path length was taken as the ratio to the maximum value within that trial. This figure shows the cumulative average path length ratios, per period, across all trials and within each trial. The mean path length in the first period was significantly shorter than during periods 2–4 (p < 0.01). The mean path length in the last trial period was shorter than during the third period (p = 0.07), when most maximal path lengths occurred.
Download figure:
Standard image3.3. DRG responses during stimulation
A comparison of DRG unit decoding during electrical stimulation for robot-controlled limb movements was performed in three cats (H, I, K). In cats H and I, two-state ramp-and-hold limb movements (whole-limb flexion and extension) were performed. In cat K, four-state stepping was performed. Across the three experiments, spike snippets from the robot-only trials were sorted on 222 channels yielding 353 non-artifact units. Four channels in experiment I and 44 channels in experiment K did not yield neural data. In the robot + FES trials, we discarded units that were not present in the robot-only condition. The discarded units included waveforms corresponding to stimulation artifacts and afferent activity produced by electrical stimulation. The discarded units are referred to as artifacts in analyses described below.
From the identified units, 242 were used in this analysis (60 units in both position and velocity analyses) and 111 units were excluded. The excluded units comprised 90 units which had a consistent gain polarity but ρ < 0.3 for either the position or velocity analysis and 20 units which failed both criteria in both the position and velocity analyses. Among the excluded units were 46 clear single units and 32 multi-units which were not correlated to the limb movement and 33 noise units on channels where the snippet threshold was set too low.
Figure 2 shows the position and velocity responses of example units during trials with and without stimulation. The GN for each unit is −0.05, indicating that a lower gain was observed for each unit during the trials with stimulation. Figure 6(a) summarizes the GNp and GNv across all non-excluded units, per experiment and in total. In experiment I (p < 0.001) and for all units (p < 0.02), the mean GNp was significantly lower than 0, indicating that the presence of electrical stimulation led to a lower observed mean unit gain. The mean GNv was significantly lower than zero (p < 0.029) in all comparisons.
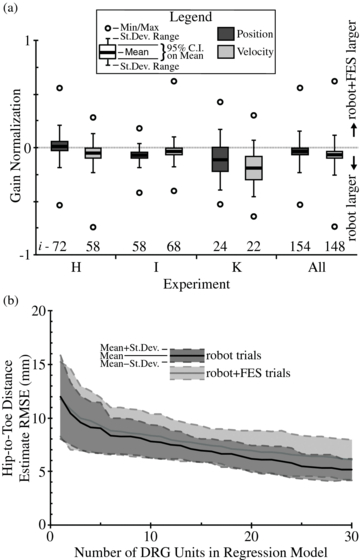
Figure 6. Evaluation of the effect of electrical stimulation on regression model encoding. In (a) the distribution of GNp and GNv values are given for each experiment and in total. The mean GNp for experiment I units and all units and the mean GNv for all experiments and across all units were significantly different from zero. The number of units (i) in each analysis is given at the bottom. In (b) the RMSE of the hip-to-toe distance regression estimate is given for different number of units in the model, for robot and robot + FES trials. There was no significant difference in the position error between the two trial types (p > 0.19). The standard deviation of the mean RMSE was consistently larger for robot + FES trials, but not significantly larger (p > 0.07).
Download figure:
Standard imageThe lower mean unit gains during electrical stimulation did not significantly affect the mean linear regression estimate of the hip-to-toe position. In figure 6(b) the mean RMSE of the regression estimate, for robot + FES and robot trials, is given for up to 30 rank-sorted units in the model. There was no significant difference between the means at any number of units in the model (p > 0.19). The standard deviation of the position estimate errors was larger for robot + FES trials (≤2.1 times larger), but not significantly (p > 0.07). Beyond 30 units in either trial type, the mean position estimate RMSE was between 4 and 6 mm.
We compared the accuracy of the estimated position in robot + FES trials achieved with spike data obtained with different offline unit sorting methods. First, estimates of the toe position were compared between sorted DRG units and unsorted DRG units including artifacts. The units were rank-ordered by their individual correlation with toe position and the difference in the RMSE between the two approaches was calculated (figure 7(a)). For 2–9 units, identifying individual units per channel and removing artifacts yielded significantly or near significantly better estimates (0.02 < p < 0.14) than not performing any sorting on each channel. For greater than 20 units, the RMSE difference approached 1.0 mm and was not significantly different (p > 0.14).

Figure 7. Comparison of regression model toe position estimates for different approaches to unit sorting during electrical stimulation trials. In (a) the difference in the end point position estimate RMSE between sorting units individually with artifacts excluded and combining all units and artifacts in a single sort per channel is shown. For 10 or more units in the regression models, the RMSE difference remained between 0.5 and 1.6 mm. In (b) the mean (plus standard deviation) position RMSEs for 20 units in the model are given for different sorting conditions: units individually sorted with artifacts excluded; all non-artifact snippets in a single sort per channel; all snippets including artifacts in a single sort per channel; and only artifacts in a single sort per channel. Mean (plus standard deviation) position RMSEs are also given for robot trials, for sorted and unsorted units. For 12 or greater units in the model during robot + FES trials, sorting of units provided a small increase in accuracy (0.5–1.8 mm) while artifacts added no information to the regression model.
Download figure:
Standard imageTo further investigate the effects of sorting, robot + FES trials were sorted in two additional means: artifacts only in a single sort code and non-artifacts only in a single sort code. Figure 7(b) shows the RMSE of the toe position estimates for the different sorting approaches using 20 units. For non-artifacts only in a single sort code in the robot + FES trials, the regression estimates were not different than when all threshold crossings were combined as a single unit per channel. These two approaches were consistently less accurate than when units are individually sorted with artifacts rejected across the various number of units in the model (1.8 ± 2.5 mm average difference for 1–30 units in each model). As indicated in the figure, end point position estimates were very inaccurate when only artifacts were in the model (9.0 ± 5.8 mm average difference against other approaches for 1–30 units in models). The end point estimates for the robot trials showed a similar trend, with a model based on unsorted activity only slightly less accurate than a model using well-sorted units (p > 0.50). In summary, artifacts or the use of unsorted units led to slightly less accurate model estimates and reduced unit gains with greater variability; however the effect was minimal for beyond 10 units in the models.
4. Discussion
This study represents an important step in the development of neuroprostheses for restoring limb control. We achieved closed-loop control of a single hind limb (figure 4) based on near real-time estimates of the limb position from DRG neural recordings (figure 3), that allowed for repeated locomotion-like movements (table 1) in two cats. The artifact rejection scheme was successful at limiting the impact of electrical stimulation artifacts on the controller. While fatigue of the limb movements was observed (figure 5), the controller was still able to drive the limb through the desired path. The closed-loop controller was effective at dynamically responding to both manual and automated perturbations in the limb path (table 1, figure 4) without requiring manual intervention. This study demonstrates that primary afferent recordings from lumbar DRG provide sufficient information for closed-loop control of the limb.
In a separate analysis from the closed-loop movement trials, we evaluated the effect of FES on DRG recordings in three cats. The presence of electrical stimulation led to a decrease in the mean observed gain of DRG units (figure 6(a)). The overall reduction in observed neural activity was most likely due to stimulation artifacts obscuring neural spikes that occurred nearby in time. It is also possible that FES affected the response of muscle spindles and Golgi tendon organs. For example, muscle stimulation can cause muscle spindle firing to pause briefly when the host muscle contracts, leading to a reduced firing rate [37]. However, this effect would not generally pose a problem since the movement information of interest is derived from muscles that are lengthening rather than those that are contracting. In cases where the muscle is undergoing a lengthening (i.e. eccentric) contraction, stimulation would likely cause a slight reduction in the firing rate and gain observed in the robot + FES trials. On the other hand, Golgi tendon organs are sensitive to active tension in the muscle and would thus respond more strongly when the host muscle is stimulated, leading to an increased gain measured in the robot + FES trials compared to the robot-only trials. Even with these potential sources of variation in the observed unit responses, the simple linear regression model was nearly as effective at estimating the end point position as during robot trials (figure 6(b)). This indicates that movement-related afferent activity is preserved even in the presence of muscle stimulation, and that spike sorting is effective in isolating this unit activity even in the presence of artifacts. This is an important benefit of spike recording methods over peripheral nerve cuffs, which may not be able to differentiate stimulation artifacts from superimposed neural activity.
Furthermore, we sought to examine the benefit of performing spike sorting to discriminate individual units and stimulation artifacts. Figure 7(a) shows that errors in the estimated foot position are generally higher when unsorted spike data (all units and artifacts combined on a given channel) are used compared to when single units are isolated and artifacts are removed. The magnitude and variability of these errors is highest when only a small number of units are used in the regression model. When the number of DRG neurons is high (e.g. N > ∼10 units), spike sorting yielded only a small improvement in the regression estimate. Similar results have been reported in recent studies with cortical neural interfaces that suggest that spike sorting provides only a small improvement in decoding performance during brain–computer-interface tasks [38]. This is further demonstrated in figure 7(b), which shows that the decoding errors are generally low across all sorting conditions, even when artifacts are included. While the most conservative approach is to isolate and remove artifacts, the presence of stimulation artifacts did not severely inflate the decoding errors. This is because the rate of stimulation is constant (30 Hz). Thus, including the artifact events simply increases the average firing rate of the recorded spiking activity that is superimposed on the activity modulated by the limb movement. As a result, regression models trained on 'noisy' data that includes stimulation artifacts perform well in capturing the movement-modulated activity. Despite the modest improvements provided by spike sorting in the experiments performed here, it is possible that the benefits of using isolated spike activity may be greater when trying to decode limb position across a wider range of movement conditions (e.g. standing or stepping at different speeds). The question of how well these approaches generalize across a range of task conditions will require further investigation.
This study is the first example of the use of natural sensory signals as feedback control for FES of a multi-joint coordinated movement. Previous demonstrations of multi-joint control utilized external sensors [5, 7–9], while the use of natural sensors for feedback has been limited to control of a single joint [18–20, 39]. Our approach of using natural sensors to provide feedback for multi-joint movement represents a natural progression of the two approaches.
Lumbar DRG, as a source of natural signals, provide access to sensory neurons from the entire leg that convey position, velocity, force and touch information. Neural interfaces with DRG are a significant improvement over interfaces that target peripheral nerves, as in [18–20, 39], which only yield partial information about a limb and are susceptible to low signal levels and interference from other neural pathways. By targeting individual cells and tracking spike times, as opposed to recording aggregate neural activity, DRG signals allow for straight-forward rejection of irrelevant signals such as stimulation artifacts or unrelated neural activity. Furthermore neural interfaces like these have the potential for being completely implanted, which in the eyes of many neuroprosthesis users is a benefit [15–17] over non-invasive approaches.
All observed DRG units were used in the FES state controller. This approach allowed for a relatively quick setting of regression coefficients during the training period (figure 3), as non-relevant units with low regression coefficients were essentially ignored. In the separate analyses of regression estimates during FES (figures 6(b) and 7) and in prior evaluations of DRG decoding of limb position [28, 29, 31, 36], it has been suggested that as few as 20–30 DRG units could provide a reasonable kinematic estimate. This process would involve a training period in which all units were ranked and the best were selected for the model. During short procedures, this process would likely lead to adequate control. However, during long-term controller use, it is probable that units will change their shape or disappear over time [38, 40]. This modulation in the quality of observed units would require repeated selection of the best units. An all-inclusive controller, such as that used here, would merely require a regular training period to identify any changes to regression coefficients. Furthermore, as suggested by figure 7, it may not be necessary to sort spikes while still obtaining robust estimates of the limb position so long as there are a sufficient number of channels exhibiting activity modulated with limb state.
Neuroprosthesis users desire smoother gait during locomotion, improved energy efficiency and better balance [17]. Integration of sensory feedback in closed-loop control of locomotion, as demonstrated here, will help address these objectives. Integrated sensory feedback provides users with a more natural control of locomotion by allowing FES controllers to react to perturbations and muscle fatigue. For FES recipients having surgery to receive implanted stimulating electrodes, DRG electrodes could be placed at the same time and connected to the implant electronics for easy integration, such as in a networked neuroprosthesis [41, 42]. For other individuals it may be possible to access the DRG with minimally invasive approaches, similar to insertion of Medtronic Interstim stimulation electrodes in the sacral foramen [43] or for insertion of the spinal modulation device near cervical DRG for pain management [44].
There are a number of opportunities to improve the performance of the controller and extend this work. The accuracy of the limb position estimates (figure 3) could be improved to provide more precise control and reduce the occurrence of step errors. Advanced decoding algorithms, such as state-space regression models, have shown significant improvements over the regression models used here but are currently too complex to be implemented in real-time [36]. Other approaches, such as Bayesian classifiers or fuzzy neural networks may achieve similar improvements while remaining computationally tractable [45]. A Bayesian classifier may predict the likelihood of the leg being in one of the switching states. Such a method could lead to more effective state switching but would be unable to track individual limb-state variables. The performance and stability of the system could be improved by replacing the finite state controller with more sophisticated designs. A continuous proportional–integral–derivative controller is one option that may be more robust and would enable reference trajectory tracking for more refined movements [46].
Although the objective of this study was to demonstrate a real-time closed-loop controller, the electrical stimulation approach for generating the limb movements could also be improved. The epimysial and intramuscular electrodes used here are the standard approach for FES control of the legs [42, 47]. Muscle fatigue is often observed with these electrodes, due to the non-physiologic order of recruitment [47]. Alternate electrode interfaces may address the fatigue (figure 5) and incomplete muscle recruitment seen in this study, such as the variance in step lengths between cats I and K (table 1). Peripheral nerve stimulation with cuff [22, 48, 49] or penetrating electrodes [10, 50–52] or recruitment of muscle synergies via intraspinal microstimulation [7, 9, 53] may lead to a more natural activation of limb muscles while requiring fewer electrodes and lower currents than direct muscle stimulation [47]. Integration of the feedback controller demonstrated here with an improved FES system may yield clinically relevant muscle recruitment and locomotion.
Nevertheless, long-term animal studies are needed to ensure the viability of this approach. As yet, chronic DRG recordings have not been demonstrated beyond several weeks [26, 29]. Long-term recordings are needed to show the viability and stability of interfacing with the DRG, and whether a closed-loop controller can respond to changes in DRG signals over time. Although improvements are being made to peripheral nerve penetrating electrodes [39], it may be possible to record cellular activity from the surface of DRG, as we have recently demonstrated [54]. A less invasive approach, such as DRG surface recordings, may yield an improved efficacy in chronic recordings and allow for a quicker transition to human evaluations. Also, chronic closed-loop locomotion studies evaluating body-weight supported trials, as have been performed using external sensors [7–9], would allow for an examination of bilateral DRG feedback during load-bearing scenarios.
Although this was a feasibility study, there were several shortcomings that may have limited the effects we observed. Each experiment was performed in an acute setting, with data collected after 5 or more hours of surgical preparation, electrode implantation and controller setup. The extended anesthesia duration may have depressed DRG spike counts or limited the effectiveness of the muscle recruitment. Performing chronic studies in awake animals will alleviate this concern. DRG units were manually sorted after experiments for the analysis of FES impact. There may have been inconsistencies in the resulting data set because more than one person completed the sorting process [55]. We tried to limit this effect by having a master sort for each experiment generated by a single individual. As the accuracy of automated spike sorting algorithms improves, the need for manual sorting to perform analyses will be eliminated.
5. Conclusions
This study is the first demonstration of closed-loop multi-joint FES control of whole-limb stepping movement using real-time decoding of the limb position based on high-density recordings from the DRG. The regression model and controller obtained reasonable estimates of the limb position in the presence of electrical stimulation artifacts. A separate analysis suggested that electrical stimulation may affect DRG recordings, but not in a manner to significantly affect the regression model if sufficient DRG units are included. This work demonstrates the potential of providing neuroprosthesis users with closed-loop control based on natural sensors that can react to perturbations and fatigue. Long-term studies and efforts to improve FES control and electrode technology are needed to further develop this approach.
Acknowledgments
The authors thank members of the Rehabilitation Neural Engineering Lab for their assistance during the animal experiments (Ingrid Albrecht, Tyler Simpson) with data analysis (Chris Ayers, Jim Hokanson) and with spike sorting (Rishi Sethi, Andrew Seong). This work was supported in part by NIH NIBIB grant 1R01EB007749 (DJW), TATRC grant W81XWH-07-1-0716 (DJW) and NIH NINDS grant 1F32NS074565 (TMB). The content is solely the responsibility of the authors and does not necessarily represent the official views of the NIH, NIBIB, NINDS or TATRC.