
Abstract
Until very recently, gallium oxide (Ga2O3) has aroused more and more interests in the area of power electronics due to its ultra-wide bandgap of 4.5–4.8 eV, estimated critical field of 8 MV/cm and decent intrinsic electron mobility limit of 250 cm2/(V·s), yielding a high Baliga's figures-of-merit (FOM) of more than 3000, which is several times higher than GaN and SiC. In addition to its excellent material properties, potential low-cost and large size substrate through melt-grown methodology also endows β-Ga2O3 more potential for future low-cost power devices. This article focuses on reviewing the most recent advances of β-Ga2O3 based power devices. It will be starting with a brief introduction to the material properties of β-Ga2O3 and then the growth techniques of its native substrate, followed by the thin film epitaxial growth. The performance of state-of-art β-Ga2O3 devices, including diodes and FETs are fully discussed and compared. Finally, potential solutions to the challenges of β-Ga2O3 are also discussed and explored.
Export citation and abstract BibTeX RIS
1. Introduction
Motivated by achieving high breakdown voltage and high energy conversion efficiency simultaneously, ultra-wide bandgap semiconductor materials and devices with high carrier mobility are powerful competitors of the next generation power electronics. Ultra-wide bandgap materials like diamond, β-Ga2O3 and AlN have attracted most of the attentions, due to their high Baliga's figure of merit (BFOM), defined as εμEc3, where ε, μ and Ec are the dielectric constant, carrier mobility and critical breakdown field (Ec), respectively[1–9]. Compared to diamond and AlN, the monoclinic β-Ga2O3 has the advantages of potential low cost and large size substrate through melt-grown method and the easy control of the n-type doping, while on the contrary, both diamond and AlN are difficult to be doped and the high quality single crystalline native substrate are extremely expensive[7, 8]. β-Ga2O3 with an ultra-wide bandgap of 4.6–4.9 eV, estimated Ec = 8 MV/cm and decent intrinsic electron mobility limit of 250 cm2/(V·s), yielding a high BFOM of more than 3000, which is several times higher than that of GaN and SiC, showing that β-Ga2O3 is more promising candidate for power electronics by simultaneous achieving higher breakdown voltage (BV) and lower specific on-resistance (Ron, sp) from the material point of view.
Although some progresses have been achieved, the performance and development of β-Ga2O3 based devices are still far behind the GaN and SiC's. While in fact, the research of β-Ga2O3 both on material and device still present itself as a virgin area, such that more universities, research institutes, national laboratories, and government funding are needed to have a fully discovering and understanding about the material properties, how to enhance device performances and make them comparable or even higher when compared with the device performance of GaN and SiC. In this review article, recent advances of the state-of-art material growth and device technologies are summarized, showing the great promise of β-Ga2O3 as power device channel material.
2. Basic material properties of β-Ga2O3
There are 5 polymorphs of β-Ga2O3, namely α, β, γ, δ, and ε[10–15]. Among which, the monoclinic (β-) phase of β-Ga2O3 denotes the most stable one until its melting point, while other polymorphs are metastable and will convert into β phase at an elevated temperature (T) above 750–900 °C. The crystal structure and lattice parameters of β-Ga2O3 are shown in Fig. 1, with lattice constant a = 12.2 Å, b = 3.0 Å and c = 5.8 Å, respectively. The unit cell possesses two crystallographically inequivalent Ga positions, one with tetrahedral geometry Ga (I) and one with octahedral geometry Ga (II). The oxygen ions are arranged in 'distorted cubic' array. Oxygen atoms have three crystallographically different positions and are denoted as O(I), O(II) and O(III), respectively. Two oxygen atoms are coordinated trigonally and one is coordinated tetrahedrally. The different position of Ga and O atoms leads to an anisotropic optical, electrical and physical properties, for example its different thermal conductivity at (-201), (100), (010) and (100) planes. The upper valence and lower conduction band structure of β-Ga2O3, calculated from density functional theory (DTF) is shown in Fig. 2, as reported by He et al.[13]. It is generally accepted that the bandgap from DFT is underestimated due to the ground state theory. More accurate bandgap value of β-Ga2O3 is extracted to be around 4.8 eV from hybrid DFT, which is in agreement with absorption and resolved photoemission experiment[16, 17]. The electron effective mass is calculated to be around 0.3mo, where mo is the free electron mass. However, the flatness of valence band shows the large effective mass of holes, indicating an extremely low hole mobility even the p-type doping can be resolved. In addition to the challenges of the p-type doping and low hole mobility issues, the extremely low thermal conductivity of 10–25 W/(m·K) both from theoretical calculation and experiment turns out to be the most detrimental property of using β-Ga2O3 native substrate and potential solutions will be described in the future section.

Fig. 1 (Color online) Atomic unit cell of β-Ga2O3 with lattice constant and angle marked.
Download figure:
Standard image
Fig. 2 Band structure of β-Ga2O3 with Fermi energy aligned to zero. Reprint from Appl Phys Lett, 88, 261904 (2006). Copyright 2006 American Institute of Physics.
Download figure:
Standard image3. Bulk substrate growth and thin film epitaxial growth
The success achieving of large diameter single crystalline and low defect density β-Ga2O3 native substrates is the main stimulation of devoting tremendous efforts to realize the application of β-Ga2O3 based materials and devices. Particularly, the development of melt-grown method offers the great promise of accomplishing low cost commercial substrates, which is advantageous over the growth techniques of SiC and bulk GaN. Standard growth techniques of β-Ga2O3 including Czochralski method (CZ)[18–20], edge-defined film fed (EFG)[21], floating-zone (FZ)[22–24] and vertical Bridgman (VB)[25–27] growth methods. Tomm et al. first studied the CZ growth of the β-Ga2O3 single crystals and later Galazka et al carried out a comprehensive study on the same method[28, 29]. It is reported that a diameter of 2 inches cylindrical β-Ga2O3 single crystal have been demonstrated with this CZ method. It is generally accepted that the EFG is the most promising growth method for β-Ga2O3, combing the capability of achieving large size and high quality for future high-volume production, which is also a standard method for sapphire substrate. Growth rate as high as 15 mm/h and large size of 4 inches have been accomplished even at this premature stage, as shown in Fig. 3[30]. FZ method is always used as a route to synthesis β-Ga2O3 rod for basic research purpose with typical growth rate of 6 mm/h and diameter of 10 mm. VB methods provide another useful alternative methodology to achieve β-Ga2O3 single crystals by providing the advantage of easy release of the crystals after growth. The single crystal with diameter of 25 mm is obtained through this method, as shown in Fig. 4[31]. It should be noted that the unintentional incorporation of the Si and Ir atoms from the β-Ga2O3 seed and crucible leads to the unintentionally doped (UID) n-type conducting in the material so that deep acceptors like Mg and Fe are commonly used to compensate those n-type dopants to achieve the semi-insulating property.
Fig. 3 Photograph of 4-inch-diameter β-Ga2O3 wafer. Reprinted from Higashiwaki et al., J Phy D, 50 (2017). Copyright 2017 IOP Publishing[30].
Download figure:
Standard image
Fig. 4 (Color online) β-Ga2O3 crystals grown by the VB method in either (a) a full-diameter crucible (a'), and (b) or in a conical crucible (b'). Reprinted from Hoshikawa et al., J Cryst Growth 447, 36 (2016). Copyright 2016 Elsevier[31].
Download figure:
Standard imageDeveloping high quality β-Ga2O3 thin film epitaxial growth is of equal importance when compared to the β-Ga2O3 substrate, since β-Ga2O3 thin film always serve as the channel layer for power devices such as diodes and MOSFETs. Accurate control of the dopants and minimization of defects and imperfections are always two challenges for thin film epitaxial growth. Homoepitaxial growth of high quality β-Ga2O3 thin films on its native substrates can be carried out by the following major ways: metalorganic chemical vapor deposition (MOCVD)[32–34], molecular beam epitaxy (MBE)[35–38], halide vapor phase epitaxy (HVPE)[39–42], mist-CVD and some other CVD techniques[43–49]. MOCVD and MBE are two of the most popular epitaxial growth tools, which are widely used in GaAs and GaN epitaxial growth. Baldini et al. reported on growing Sn-doped homoepitaxial layer on (100) substrate with MOCVD[50]. TEGA, molecular oxygen (O2) and TESn were used as Ga, O and Sn precursors, respectively. The epi-layer has a RMS surface roughness of 0.6 nm and the main defects in the layers were stacking faults and twin lamella. Gogova et al. reported on achieving single-phase, smooth β-Ga2O3 layers doped with Si, with a dislocation density not exceeding those of the melt grown substrate. HRTEM image of grown thin film is shown in Fig. 5(a)[33]. Okumura et al. reported on using plasma-assisted MBE to grow the (010) β-Ga2O3 under Ga-rich conditions at growth temperatures above 650 °C with growth rate about 2.2 nm/min. Slightly Ga-rich conditions between 650 and 750 °C are optimal for a smooth surface with an RMS surface roughness of 0.1 nm at a high growth rate. Surface roughness at various growth temperature is shown in Fig. 5(b)[37]. HVPE is one of the most cost effective methodologies in terms of deposition rate, epi-layer quality and inexpensive facility. However, it generally ends up with a rough surface, which requires a post chemical mechanical polishing process to smooth. Murakami et al. reported on using GaCl and O2 precursors for the HVPE of β-Ga2O3 thin film on (001) β-Ga2O3 substrate with a relative smooth surface morphology and low net carrier doping concentration of 1013 cm−3 at a limited growth rate of 5 μm/h and temperature of 1000 °C. The microscopy images of β-Ga2O3 surfaces after HVPE growth on (001) β-Ga2O3 substrates for 1 h at (c) 800 and (d) 1000 °C[41] are shown in Fig. 5. Mist CVD is another inexpensive approach to grow different polymorphs of Ga2O3, like α-, β-, γ-phases at a relatively low growth temperature of 500–630 °C, while the solution is atomized via ultrasonication at a frequency of 2.4 MHz. Other phases can be transformed into β-phase after a high temperature annealing.

Fig. 5 (Color online) (a) HRTEM image of an undoped homoepitaxial β-Ga2O3 layer from MOVPE method. (b) Surface morphologies of 60-nm-thick β-Ga2O3 (010) layers grown on Sn-doped β-Ga2O3 (010) substrates at a growth rate of 1 nm/min under slightly Ga-rich conditions at the growth temperatures of 500, 700, 800, and 900 °C, respectively. NDIC microscopy images of β-Ga2O3 surfaces after HVPE growth on (001) β-Ga2O3 substrates for 1 h at (c) 800 and (d) 1000 °C. Reprinted from Refs. [33, 37, 41].
Download figure:
Standard image4. Device performances: diodes and FETs
As always emphasized by the β-Ga2O3 community, β-Ga2O3 holds promise for future power electronics due to its ultra-wide bandgap, high breakdown field and decent electron mobility induced high BFOM. Table 1 lists the comparisons of some major semiconductors as the channel materials for power devices. Some key FOMs used for representing how ideal of this material can be utilized for power electronics, such as Baliga, Johnson and Keys are also included. Baliga, Baliga high frequency, Johnson and Keyes FOMs are used to evaluate the power devices in terms of power handling capability and conduction loss, the measure of switching losses, the measure of suitability of a semiconductor material for high frequency power transistor applications and requirements, and the thermal dissipation capability for power density and speed, respectively. As shown in this Table 1, all other FOMs of β-Ga2O3 are significantly higher than that of SiC and GaN except Keyes FOM due to its obvious shortage of extremely-low thermal conductivity. Nevertheless, we should put all our endeavors to explore and demonstrate all its potentials and then push the device performance to its limit. Diodes and FETs are the most basic but most important elements of power electronics, which deserve thorough investigation. In this section, the most recent progresses of both diodes and FETs are comprehensively reviewed and solution to its low thermal conductivity issue is proposed.
Table 1. Properties of β-Ga2O3 relative to some other major semiconductors used for power electronics applications, considering their different kinds of FOM.
| Material Parameter | Si | GaAs | 4H-SiC | GaN | Diamond | β-Ga2O3 |
|---|---|---|---|---|---|---|
| Bandgap Eg (eV) | 1.14 | 1.43 | 3.25 | 3.4 | 5.5 | 4.8 |
| Dielectric constant ε | 12 | 13 | 10 | 9 | 5.5 | 11 |
| Breakdown field EC (MV/cm) | 0.3 | 0.4 | 2.5 | 3.3 | 10 | 8 |
| Carrier mobility μ (cm2/(V·s)) | 1450 | 8400 | 1000 | 1200 | 2000 | 300 |
| Saturation velocity νsat (107 cm/s) | 1 | 1.2 | 2 | 2.5 | 1 | 2 |
| Thermal conductivity κ (W/mK) | 150 | 50 | 370 | 250 | 2000 | 10–30 |
| FOM relative to Si | ||||||
| Baliga FOM = εμEc3 | 1 | 14.7 | 317 | 846 | 24 660 | 3200 |
| Johnson FOM = Ec2νsat2/4π2 | 1 | 1.8 | 278 | 1089 | 1110 | 2844 |
| Baliga High Frequency FOM = μEc2 | 1 | 10 | 46 | 100 | 1500 | 142 |
| Keyes FOM = κ[(cνsat)(4πε)]1/2 | 1 | 0.3 | 3.6 | 1.8 | 41.5 | 0.2 |
4.1. Schottky barrier diodes on native substrates
Schottky Barrier Diodes (SBDs) with low turn on voltage (Von), high forward current density and fast switching speed properties are ideal candidate for low switching/conduction losses and high frequency operations, which are indispensible components in power electronic circuits such as converters and inverters for power supplies and power factor corrections[51]. Sasaki et al. developed the first β-Ga2O3 SBD on its (010) native substrate with a 1.4 μm thick ozone MBE homoepitaxial grown drift layer and a breakdown voltage (BV) of more than 100 V is achieved[52]. The electron mobility of this Sn-doped thin film is reported to be as high as 100–150 cm2/(V·s) at a doping concentration range of 1016–1017 cm−3. The mobility versus doping concentration and I–V characteristics are included in Fig. 6.

Fig. 6 (Color online) (a) Electron mobility as a function of carrier concentration. (b) I–V characteristics of Pt/β-Ga2O3 Schottky barrier diodes. The inset shows the schematic structure of the β-Ga2O3 SBD. Reprinted from Sasaki et al., Appl Phys Express, 5, 035502 (2012)[52]. Copyright of 2012 Japanese Society of Applied Physics.
Download figure:
Standard imageFollowing the 1st β-Ga2O3 SBD, many research groups have demonstrated high performance SBDs with BV around or exceeding 1 kV with or without field-plate or edge termination techniques. Konishi et al. reported on the 1st achieving of the BV more than 1 kV with a field-plate structure and a 7-μm thick HVPE grown β-Ga2O3 drift layer[53]. Diodes were fabricated by depositing full area back Ohmic contacts of Ti/Au (20 nm/230 nm) by E-beam evaporation, while the Schottky contacts were patterned by lift-off of E-beam deposited Schottky contacts Pt/Ti/Au (15 nm/5 nm/500 nm) on the epitaxial layers with a field plate length of 20 μm. The net donor concentration of this epitaxial layer is calculated to be 1.6 × 1016 cm−3 from C–V measurement. To achieve a high BV, a low density channel or drift layer is needed so as to flatten the electric field from the anode to cathode based on the Poisson Equation. The device has a specific on-resistance of 5.1 mΩ·cm2, yielding a power FOM of 227 MW/cm2, combined with the BV of 1076 V. The peak E at anode edge is simulated to be 5.1 MV/cm, which is much higher than the EC of GaN and SiC. Fig. 7 shows the details of the device schematic, forward and reverse J–V characteristics.

Fig. 7 (Color online) (a) Forward and (b) reverse J–V characteristics of β-Ga2O3 FP-SBD at room temperature. Inset shows the cross-section device schematic of the vertical SBD. Reprinted from Appl Phys Lett, 110, 103506 (2017). Copyright 2017 American Institute of Physics[53].
Download figure:
Standard imageYang et al. also demonstrated 1 kV-class vertical β-Ga2O3 SBD without field-plate structure with a 10-μm thick β-Ga2O3 drift layer and Ni/Au as the anode[54]. The native substrate possesses a pit dislocation of 103 cm−2 and the epitaxial layer has a net doping concentration of 2 × 1016 cm−3. It is found that the BV has a strong dependence on the anode diameter and the BV is around 1 KV and 800 V at an anode diameter of 105 and 205 μm, respectively, as shown in Fig. 8(a). The diode is also reported to achieve a high power FOM of 150 MW/cm2 with a Ron,sp of 6 mΩ·cm2. By further shrinking the anode diameter to 25 μm, the BV is further increased to be 1.6 kV at a decent power FOM of 100 MW/cm2, as shown in Fig. 8(b)[55]. This anode diameter dependent BV is most likely related with defects in the epitaxial layer. With larger anode area, higher quantities of defects are expected underneath the anode so that once a point defect is damaged under the high E condition the whole diode is destroyed, resulting in a reduced BV. Through growth optimization, the carrier concentration in the epitaxial layer can be further reduced to 2 × 1015 cm−3. Combined with a 20-μm thick drift layer, the BV can be enhanced to 2300 V. Meanwhile, a high current of 2 A can be also achieved by enlarging the anode area to 0.2 cm2[56].
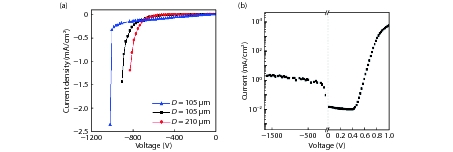
Fig. 8 (Color online) (a) Reverse I–V characteristics of 3 diodes with two different diameters, showing a diameter dependence of the BV, and (b) forward and reverse I–V characteristics from a 20 μm diameter diode. Reprinted from Appl Phys Lett, 110, 192101 (2017) and IEEE Electron Device Lett. Copyrights 2017 American Institute of Physics and 2017 IEEE[54, 55].
Download figure:
Standard image4.2. Field effect transistors (FETs) on native substrates
4.2.1. Depletion-mode high-power FETs
The first metal-semiconductor-FET (MESFET) was demonstrated by Higashiwaki et al. with a Sn-doped β-Ga2O3 epitaxial channel on a semi-insulating (010) β-Ga2O3 substrate[57]. This circular MESFET is with a gate length (LG) of 4 μm and source-drain (LSD) of 20 μm demonstrates a BV of more than 250 V, drain current (ID) of 15 mA and on/off ratio around 104. Output and transfer characteristics are plotted in Fig. 9. Following the MESFET, metal-oxide-semiconductor FETs (MOSFETs) start to attract the power device community's attention to resolve the shortcomings of the MESFET. The first lateral depletion-mode (D-mode) β-Ga2O3 MOSFET power device with BV more than 600 V was reported by Wong et al.[58]. The device structure is shown as Fig. 10(a) with a MBE grown and Si-doped channel with doping concentration of 3 × 1017 cm−3, a heavily doped source and drain contacts and a FP length of 2.5 μm. A maximum ID of 80 mA/mm, peak gm of 3.5 mS/mm and high on/off ratio of more than 109 are achieved simultaneously. Pulsed ID–VDS shows no current collapse phenomenon, verifying the great promise of β-Ga2O3 MOSFET as a candidate for power device application. Recently, Zeng et al. has pushed the BV to be 1850 V by adopting a FP structure and a 400-nm thick composite field plate oxide at a LGD = 20 μm[59]. It is believed that the introduction of another 50 nm of ALD SiO2 is helpful in improving the BV, rather than a simply plasma-enhanced CVD (PECVD) SiO2 layer underneath the gate FP electrode, where the premature breakdown happens and also a high-quality ALD SiO2 is available to sustain a higher EC. The device structure and breakdown characteristics are described in Fig. 11.

Fig. 9 (Color online) (a) DC output characteristics of β-Ga2O3 MESFET and (b) transfer characteristics of the same MESFET at VDS = 40 V. Reprinted from Appl Phys Lett, 100, 013504 (2012). Copyrights 2012 American Institute of Physics[57].
Download figure:
Standard image
Fig. 10 (Color online) (a) Schematic cross section of a β-Ga2O3 MOSFET with a gate-connected FP structure and (b) Output characteristics of the MOSFET with maximum ID of 78 mA/mm and BV of 750 V. Reprinted from IEEE Electron Device Lett, 37, 2 (2016). Copyright of 2016 IEEE[58].
Download figure:
Standard image
Fig. 11 (Color online) (a) Cross-section view and (b) optical image of the fabricated field-plated Ga2O3 MOSFET with SOG S/D doping. (c) Three-terminal breakdown measurement of the field-plated Ga2O3 MOSFET and a record-high BV of 1850 V is demonstrated. Reprinted from IEEE Electron Device Lett, 39, 9 (2018). Copyright of 2018 IEEE[59].
Download figure:
Standard image4.2.2. Enhancement-mode (E-mode) high-power FETs
Zeng et al. reported on achieving the first E-mode β-Ga2O3 MOSFET by adopting a high work function Au gate electrode and low doping (6 × 1015 cm−3) MBE β-Ga2O3 channel, so that E-mode operation with VT of 3 V and BV of 400 V are demonstrated[60]. Later, Tadjer et al. fabricated a (001) β-Ga2O3 MOSFET with VT = 2.9 V and HfO2 as the gate dielectric[5]. Figs. 12(a) and 12(b) are the ID–VGS characteristics of Zeng's and Tadjer's E-mode MOSFET. Chabak et al. demonstrated the E-mode β-Ga2O3 MOSFET via incorporating a fin-array structure with triangular fin-width of 300 nm and fin-height of 200 nm, such that the high work function Ni gate electrode can deplete the β-Ga2O3 channel from two side walls with VT around 1 V[4]. On/OFF ratio greater than 105 and a three-terminal BV of more than 600 V are achieved at a 21-μm gate-drain spacing, as shown in Fig. 13. Hu et al. has adopted a similar Fin-structure to achieve an E-mode operation on a vertical MOSFET[61]. A 10-μm thick HVPE β-Ga2O3 layer on (001) substrate with low charge doping concentration of 2 × 1016 cm−3 is used as the starting wafer. By shrinking the fin-width to 330 nm or even smaller, the VT is extracted to be 1.2–2.2 V. A current on/off ratio of 108, Ron,sp of 13–18 mΩ·cm2, BV up to 1057 V and output current of more than 200 A/cm2 are demonstrated. Figs. 14(a)–14(d) depict the device structure of the vertical E-mode β-Ga2O3 MOSFET, on-state ID–VGS and three-terminal OFF-state breakdown measurement results, respectively.
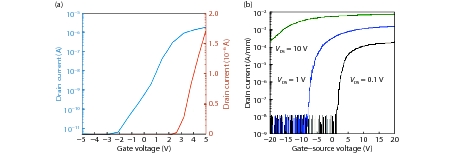
Fig. 12 (Color online) ID–VGS characteristics of (a) Zeng's and (b) Tadjer's E-mode MOSFET. Reprinted from IEEE Device Research Conf and ECS J, Solid State Sci, Technol, 39, 9 (2018). Copyright of 2016 IEEE[60] and 2016 ECS[5].
Download figure:
Standard image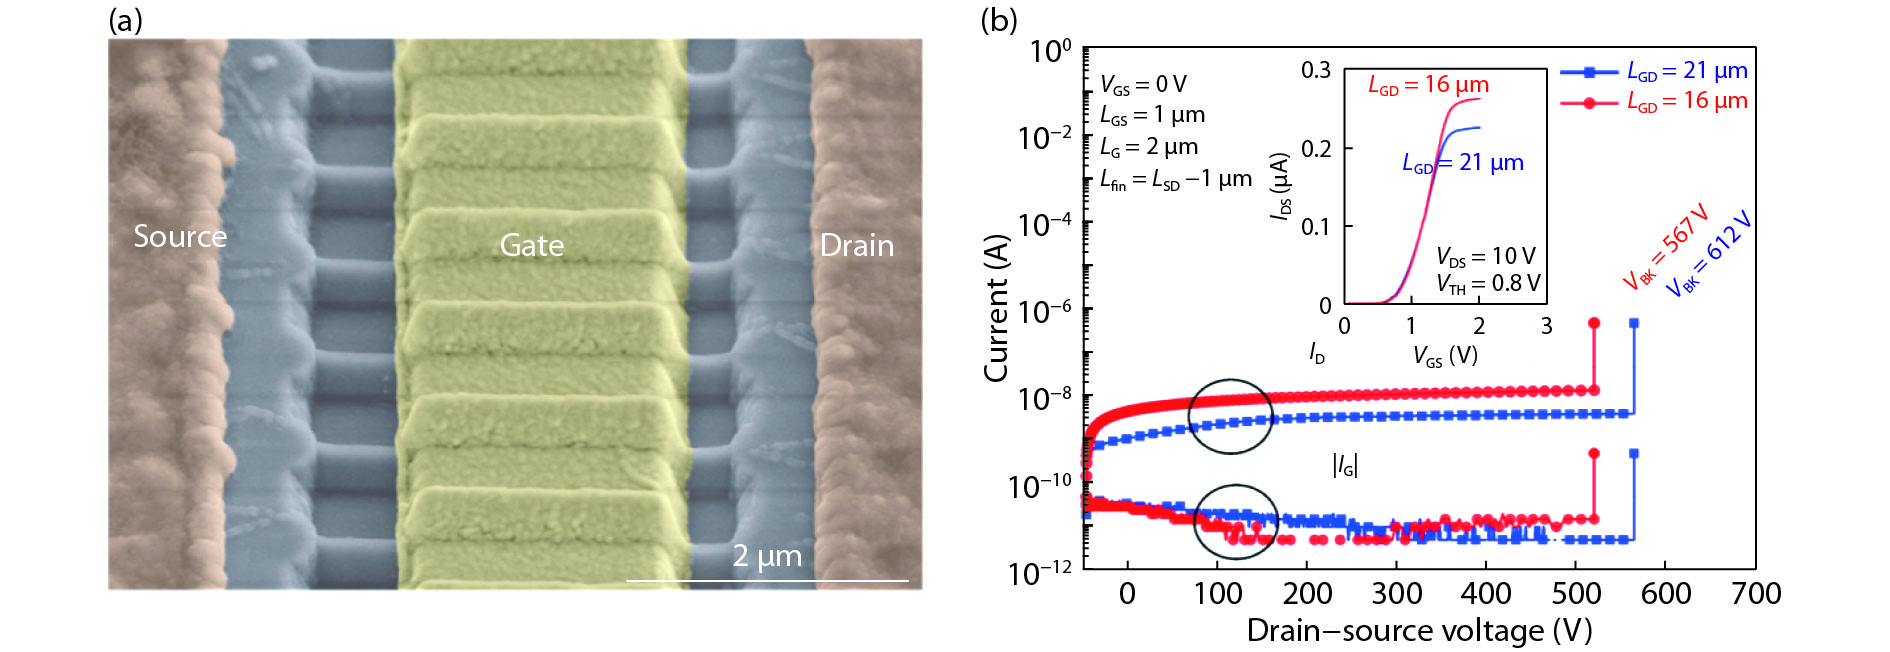
Fig. 13 (Color online) (a) Tilted false-colored SEM image of a fabricated E-mode β-Ga2O3 Fin-MOSFET and (b) The breakdown characteristics of β-Ga2O3 Fin-MOSFET with LG = 2 μm and LGD = 16, 21 μm at VGS = 0 V. The inset shows the transfer characteristics of the same device indicating a VTH = 0.8 V. Reprinted from Appl Phys Lett, 109, 213501 (2016). Copyrights 2016 American Institute of Physics[4].
Download figure:
Standard image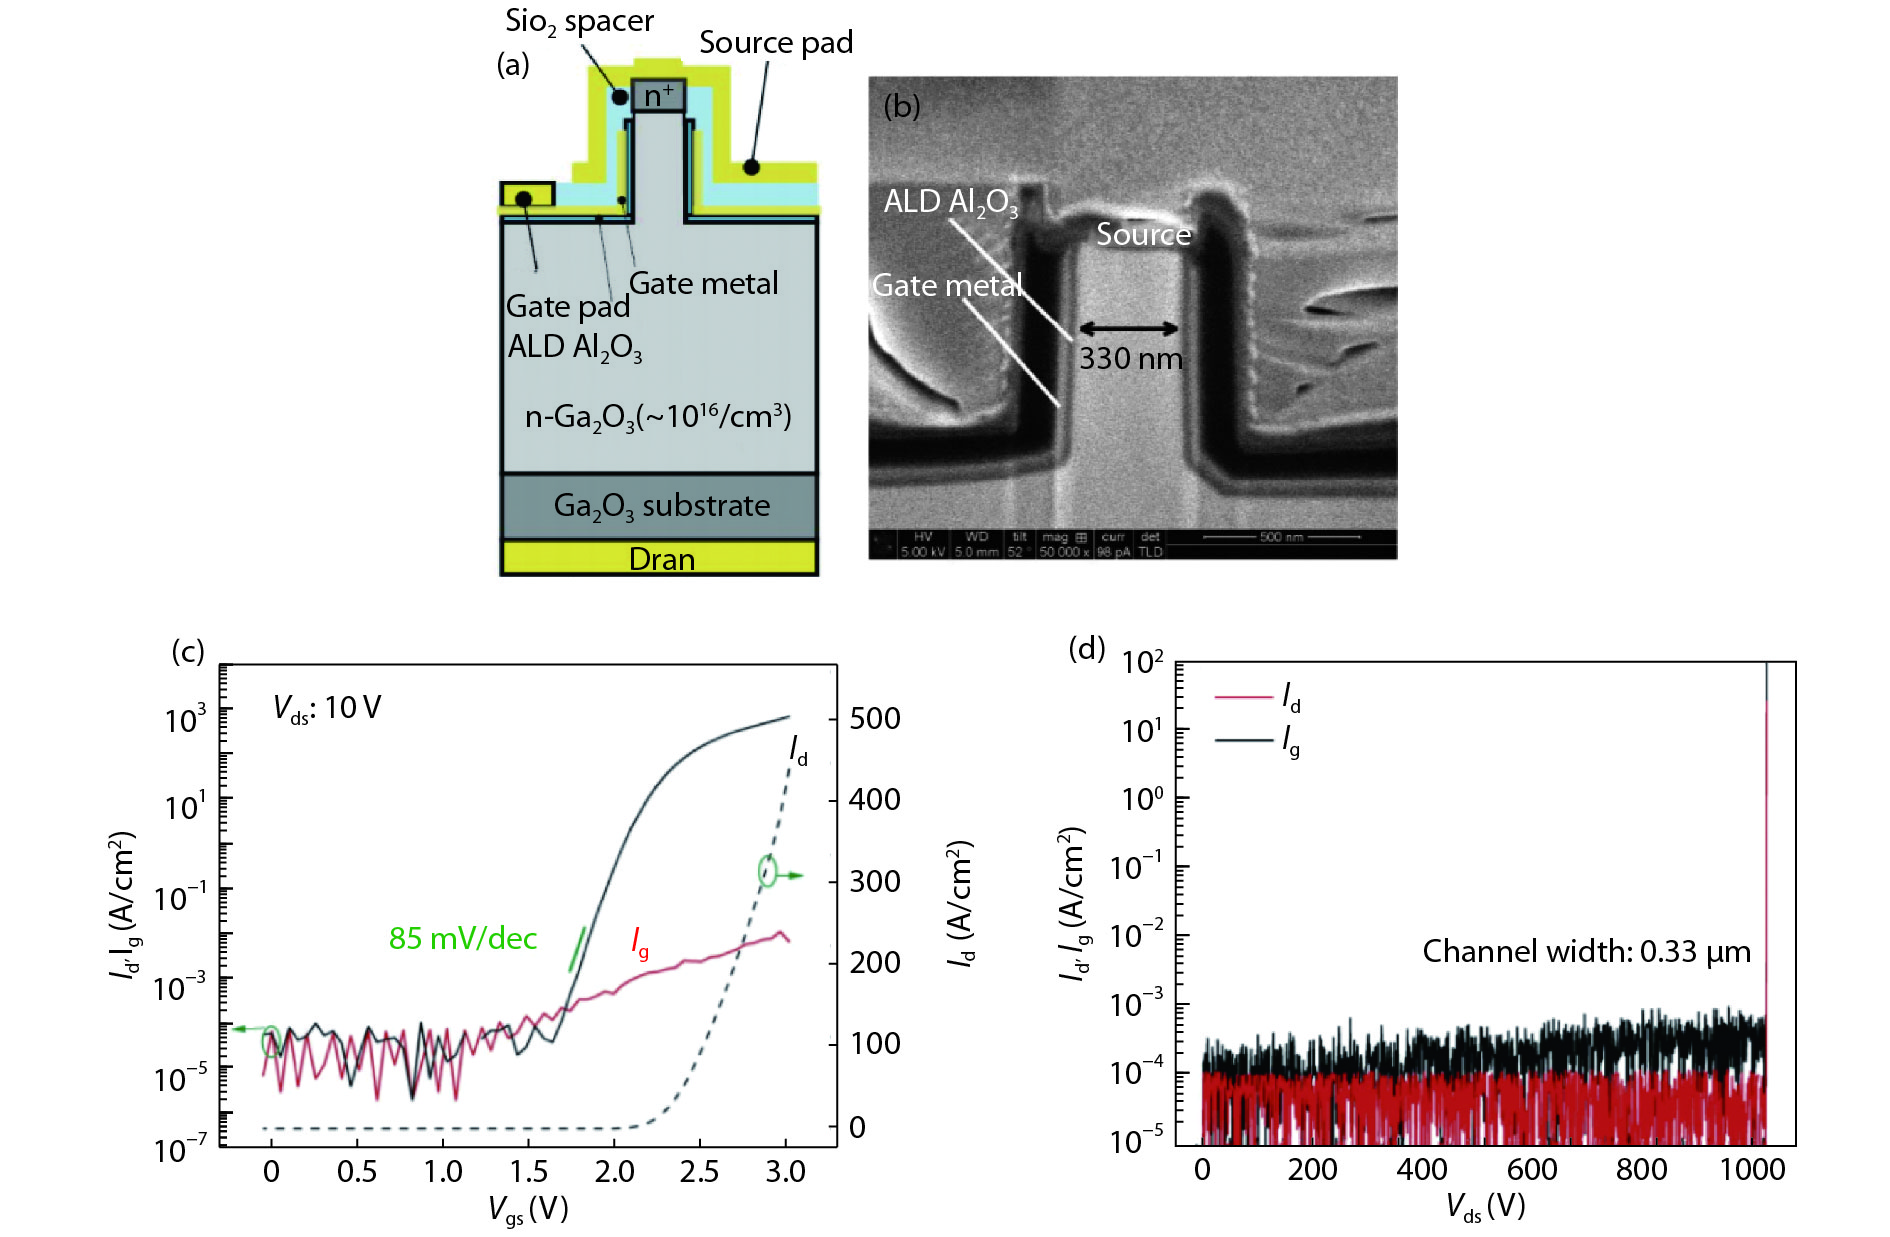
Fig. 14 (Color online) (a) Schematic cross-section and (b) SEM image of a vertical E-mode β-Ga2O3 Fin-MOSFET, (c) transfer characteristics of the device with a VTH = 2.2 V, on/off ratio of 108, and on-current of 400 A/cm2. (d) The breakdown characteristics of β-Ga2O3 Fin-MOSFET with channel width of 330 nm. Reprinted from IEEE Electron Device Lett, 39, 869, 2018. Copyright of 2018 IEEE[61].
Download figure:
Standard image4.2.3. High frequency RF Power FETs
Green et al. reported on demonstrating the first β-Ga2O3 RF transistor on a Si-doped MOCVD β-Ga2O3 channel with doping concentration of 1018 cm−3 and a (100) substrate[62]. By recessing the β-Ga2O3 epi-channel, peak transconductance of 21 mS/mm and extrinsic cut-off frequency (fT) and maximum oscillation frequency (fmax) of 3.3 GHz and 12.9 GHz are achieved. Meanwhile, CW class-A power amplifier demonstrate a output power density (Pout), power gain, and power-added efficiency (PAE) of 0.23 W/mm, 5.1 dB and 6.3%, respectively at the frequency of 800 MHz. Device structure, small signal and large signal performances are described in Fig. 15. Singh et al. carried out the study on the pulsed large signal RF performance of field-plated β-Ga2O3 MOSFET[63]. It is revealed that reduced self-heating when pulse resulted in a PAE of 12%, drain efficiency of 22.4%, Pout of 0.13 W/mm and a maximum gain up to 4.8 dB at 1 GHz for a device with Lg = 2 μm. Self-heating effect at high VDS and IDS caused by the low thermal conductivity is the main factor limiting the device performances, while the trapping effect has the minimal impact on the performance degradation. Pulsed ID–VDS measurement and large signal load pull measurement results are shown in Fig. 16 and the comparison between CW and pulsed results are shown in Table 2, indicating the self-heating effect is the primary detrimental factor of degrading device performance. Chabak et al. reported on achieving high performance β-Ga2O3 RF transistor by utilizing a higher doped but thinner Si doped MOVPE (100) channel with sub-micron T-shape gate[64]. A record-high fT/fmax of 5/17 GHz at VDS = 15 V and VGS = −14.2 V is achieved, along with a peak gm of 25 mS/mm. DC and RF results are shown in Fig. 17.
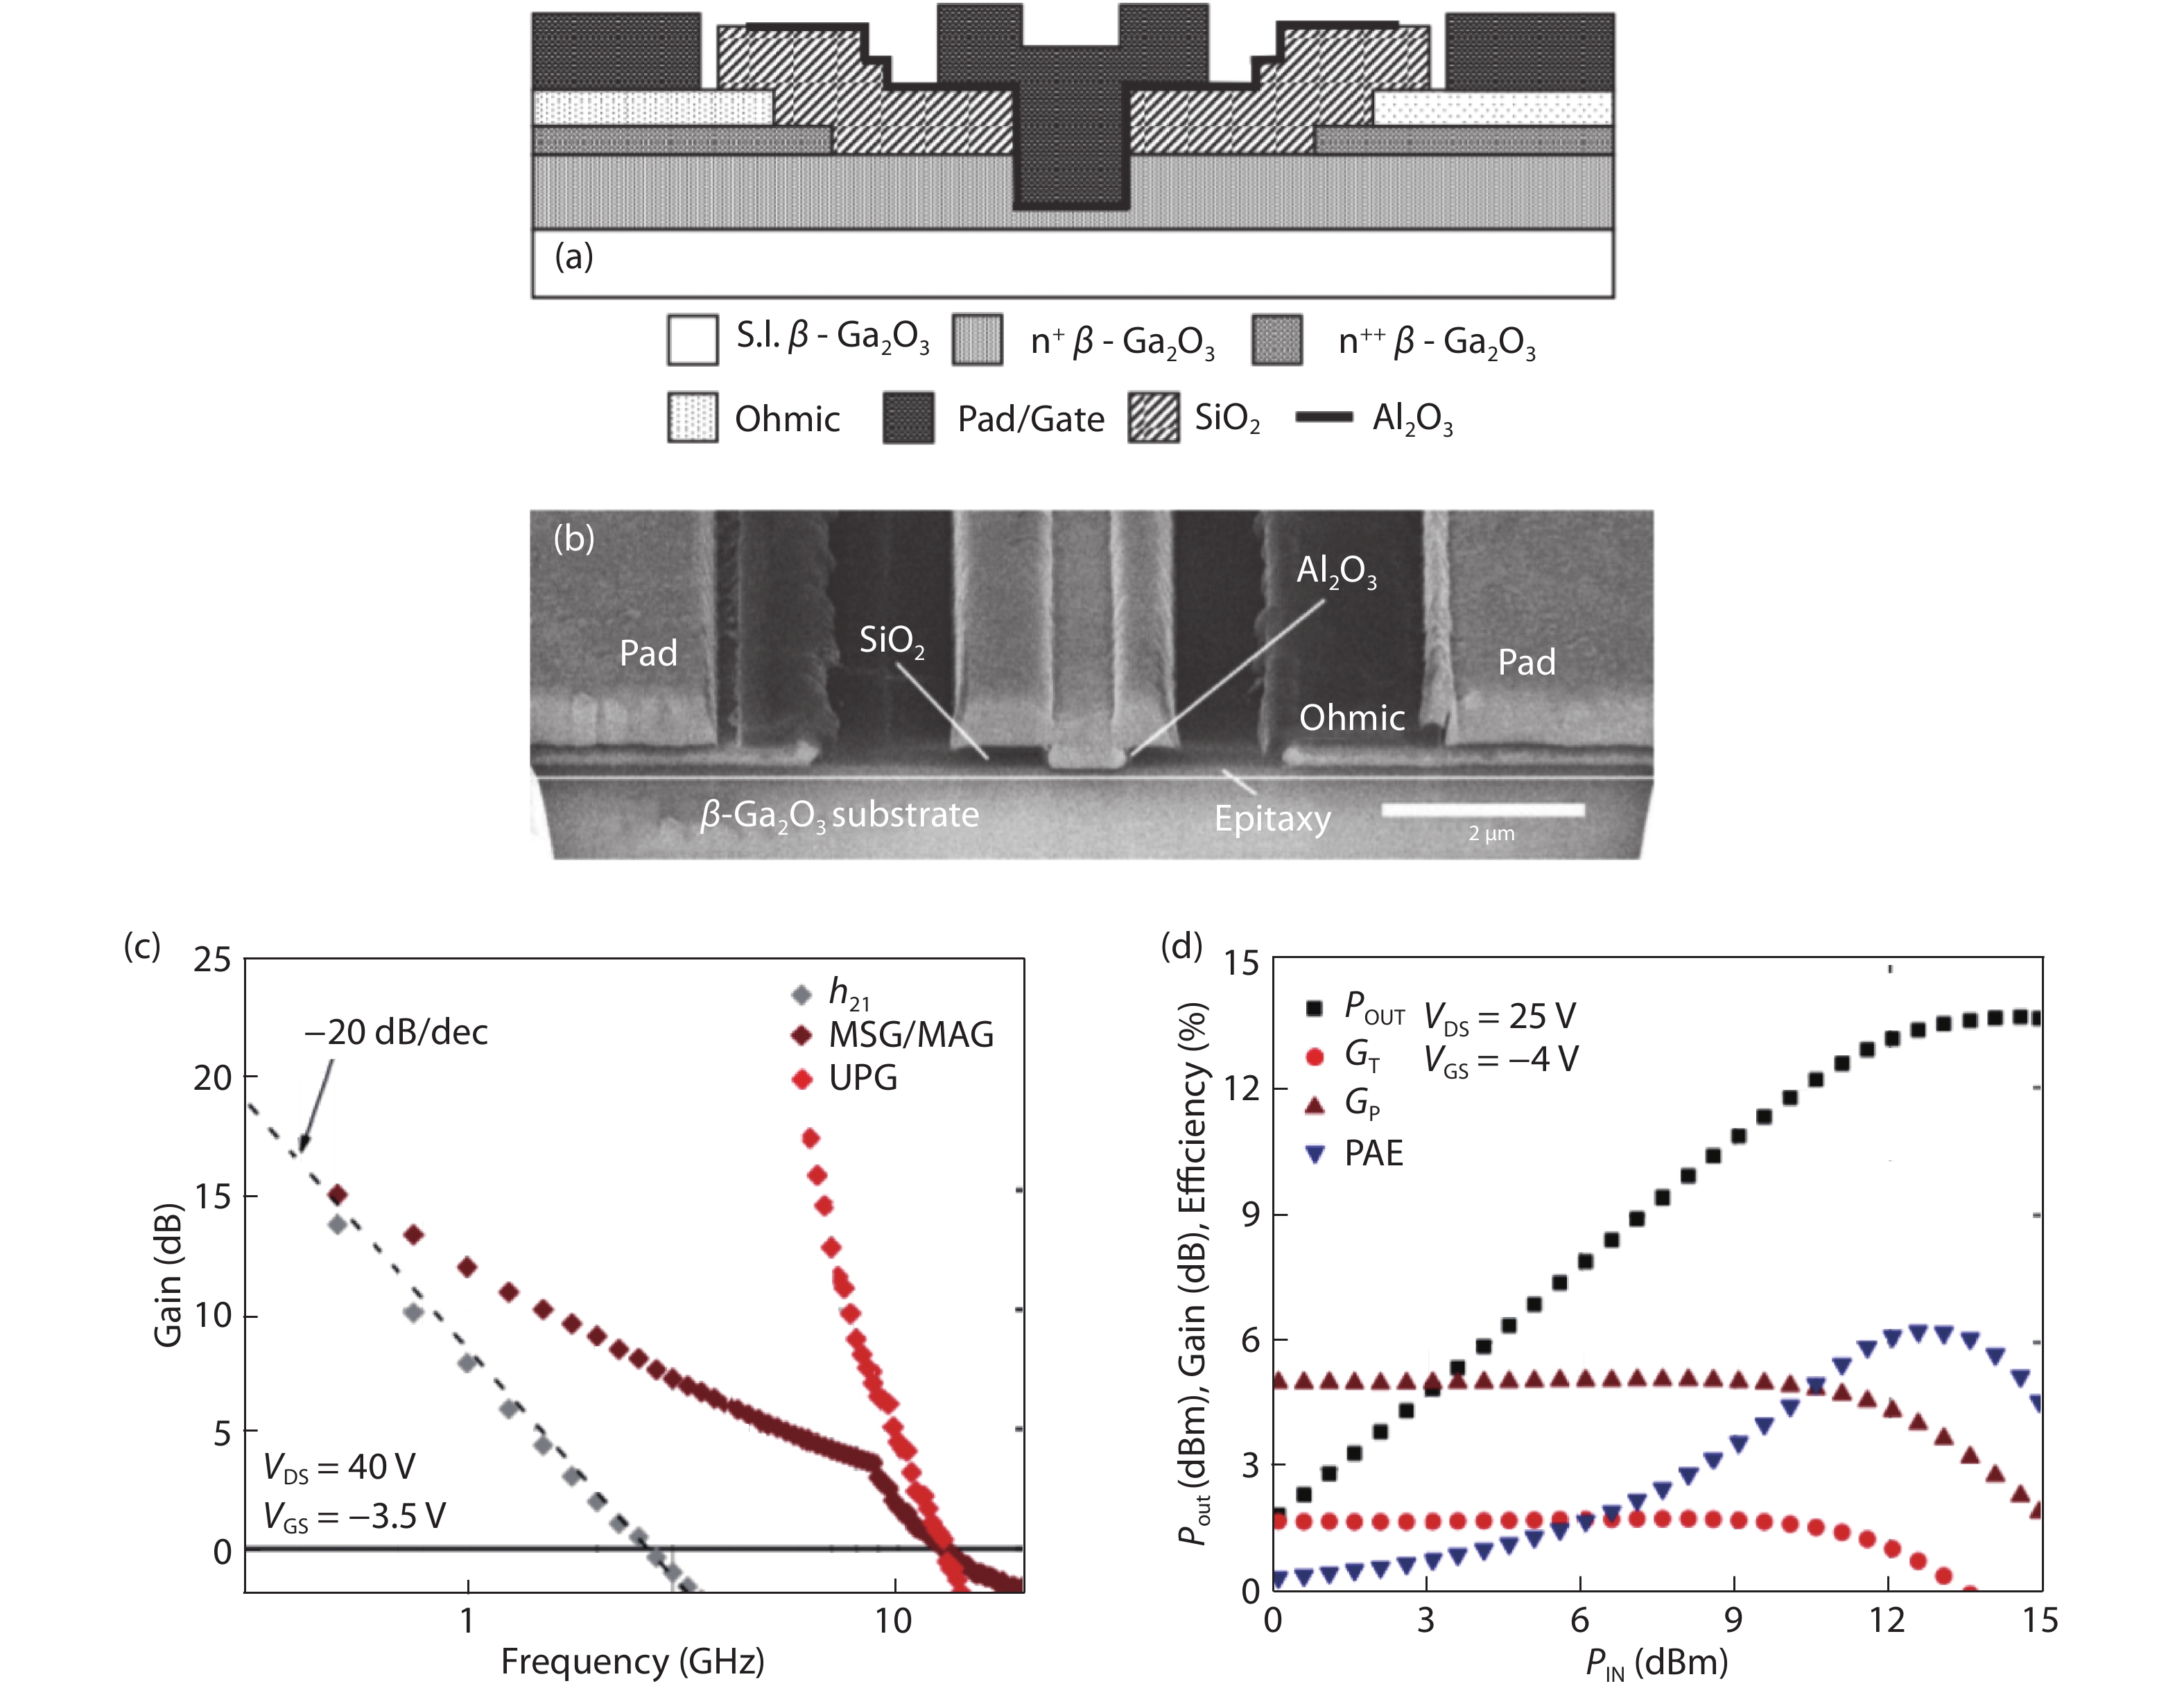
Fig. 15 (Color online) (a) A device cross section schematic is shown for the β-Ga2O3 MOSFET under test. (b) A focused ion beam (FIB) cross sectional image of the device. (c) Extrinsic small signal RF gain performance recorded at VGS = −3.5 V (peak gm) and VDS = 40 V (d) 800 MHz Class-A power sweep of a 2 × 50 μm β-Ga2O3 gate recessed MOSFET. Reprinted from IEEE Electron Device Lett, 38, 790, 2017. Copyright of 2017 IEEE[62].
Download figure:
Standard image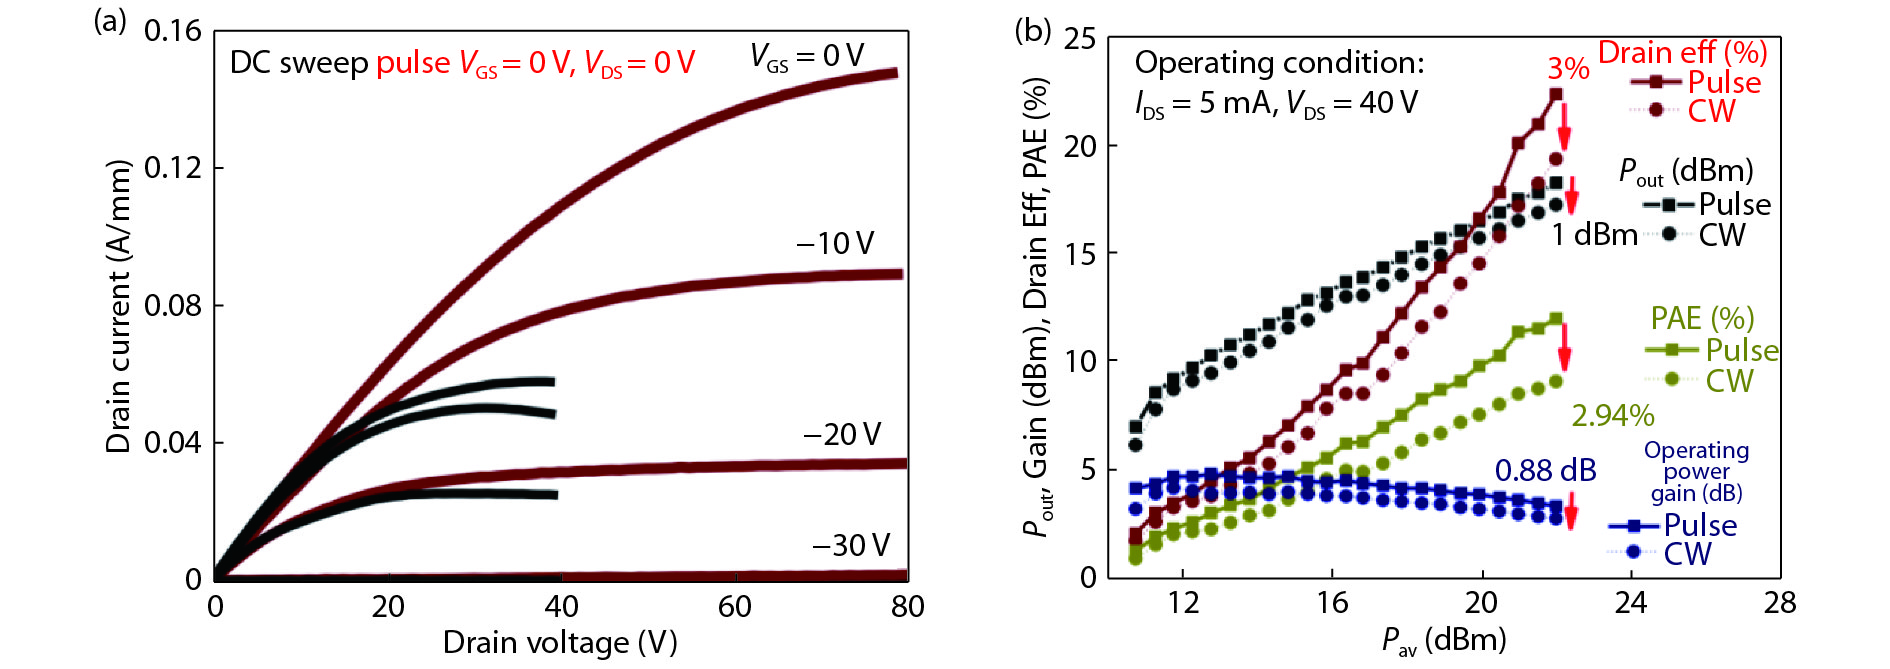
Fig. 16 (Color online) (a) DC output characteristics and pulsed I–V from a quiescent bias of VGS = VDS = 0 V up to VDS = 80 V with 1 μs pulse length and 1 ms period (b) Pulsed and CW large signal measurements at 1 GHz with input available power sweep up to 22 dBm, measured at VDS = 40 V with IDS = 5 mA. Reprinted from IEEE Electron Device Lett, 39, 1572, 2018. Copyright of 2018 IEEE[63].
Download figure:
Standard imageTable 2. Comparison of CW and pulse large signal measurements performed at two different operating power levels of 0.4 and 0.8 W/mm. larger differences in performance between cw and pulsed modes can been seen with increasing operating power. Reprinted from IEEE Electron Device Lett, 39, 1572, 2018. Copyright of 2018 IEEE.
| Parameter | Operating condition 0.4 W/mm 25 °C (IDS = 5 mA, Vds = 40 V) | Operating condition 0.8 W/mm 25 °C (IDS = 10 mA, VDS = 40 V) | ||
|---|---|---|---|---|
| CW | Pulse | CW | Pulse | |
| Pout (dBm) | 17.42 | 18.28 | 17.63 | 19.52 |
| Pout (W/mm) | 0.11 | 0.13 | 0.11 | 0.17 |
| Drain Eff (%) | 19.56 | 22.40 | 13.83 | 17.04 |
| PAE (%) | 9.09 | 12.01 | 3.23 | 6.85 |
| Max gain (dB) | 4.17 | 4.81 | 2.08 | 3.68 |
| Channel temperature (°C) | 58 | 28 | 97 | 36 |
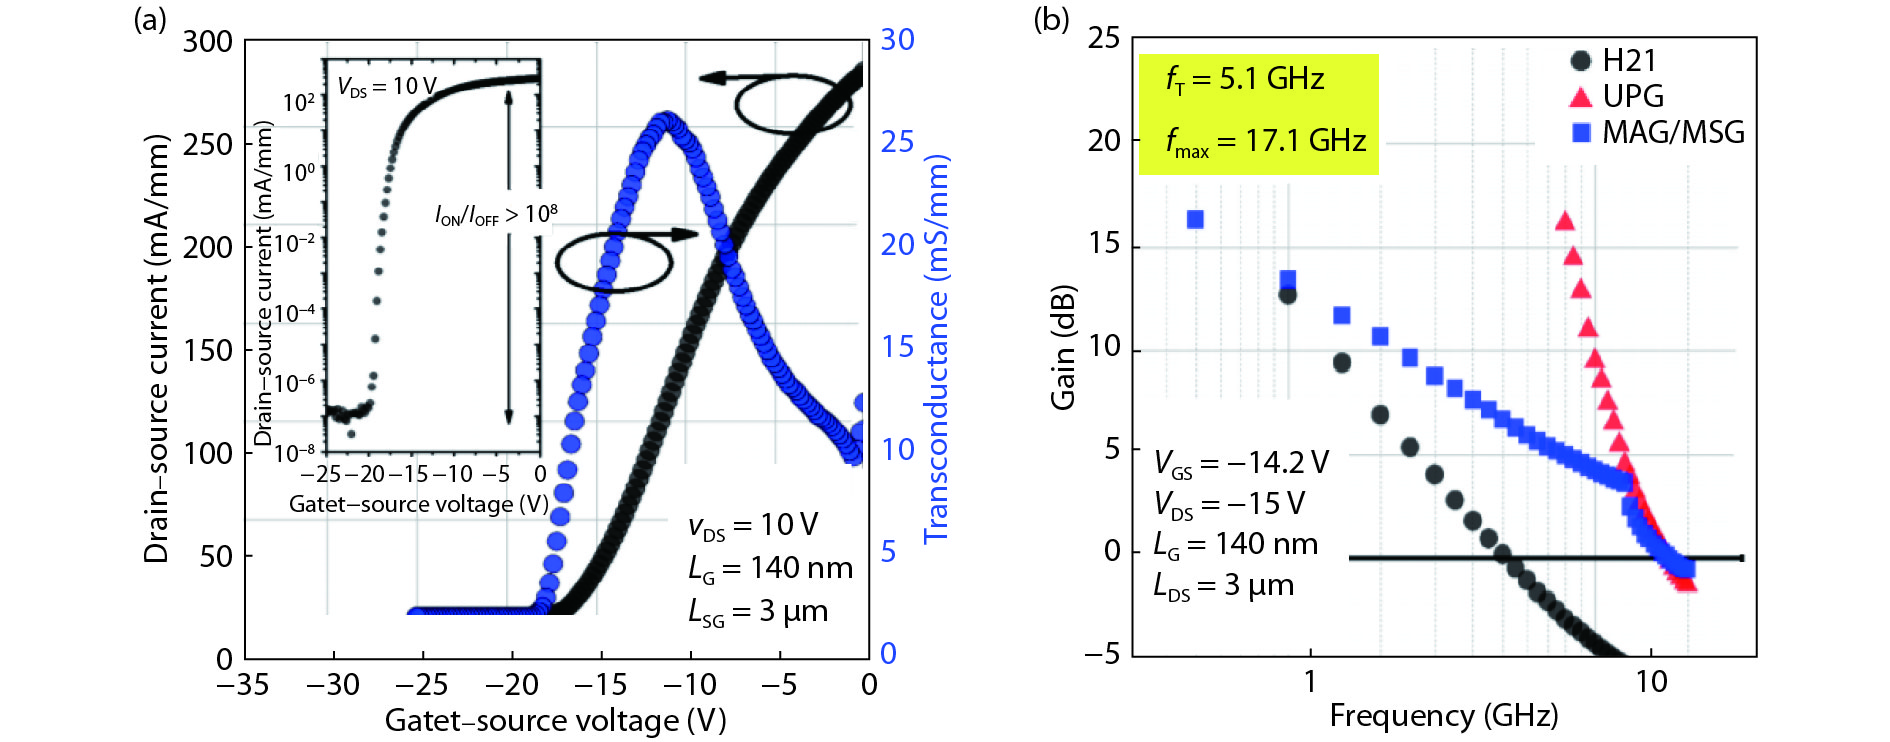
Fig. 17 (Color online) Transfer characteristics of the thin-channel BGO MOSFET with T-gate. The GM reaches 25 mS/mm with current density over 275 mA/mm, and the inset shows a good ION/IOFF ratio greater than 108. (b) Small signal gain at VDS = 15 V of the thin-channel BGO MOSFET with ft/fmax = 5.1/17.1 GHz. Reprinted from IEEE IMWS-AMP, 2018. Copyright of 2018 IEEE[64].
Download figure:
Standard image4.3. High performance nano-membrane β-Ga2O3 SBDs and FETs on foreign substrates
4.3.1. Field-plated lateral β-Ga2O3 SBDs on sapphire substrate
β-Ga2O3 crystal possesses an unique property that its (100) surface has a large lattice constant of 12.23 Å along [100] direction, which allows a facile cleavage into thin belts or nano-membranes[65]. Hence, by transferring β-Ga2O3 nano-membrane from its bulk substrate to a wider bandgap and higher thermal conductivity substrate can minimize low-thermal conductivity of β-Ga2O3 bulk substrate induced severe self-heating effect while maintaining its high breakdown characteristics. Importantly as a research route, it provides an effective methodology to investigate fundamental material property of β-Ga2O3 and fully explore device potentials without using many β-Ga2O3 epitaxy wafers. Hu et al. reported on the first high performance lateral β-Ga2O3 SBD on sapphire substrate by transferring high quality β-Ga2O3 nano-membrane channel from its low defect density bulk substrate[66]. Annealed Ti/Au (60/120 nm) is used as the cathode while Ni/Au (60/120 nm) is used as the anode metal and the β-Ga2O3 nano-membrane is with thickness around 400 nm. The SBDs have an on-current on/off ratio of 107–108 with turn-on voltage (Von) of 1 V determined by the linear extrapolation of the forward I–V. The Ron, sp of each SBD is determined to be Ron = 3.29, 5.94, 12.7, and 34.2 mΩ·cm2 for LSchottky-Ohmic = 4, 6, 11, and 15 μm, respectively. The off-state BV is measured to be 0.64 kV, 0.85 kV, 1.2 kV and 1.7 kV, yielding a power FOM of 0.124, 0.121, 0.113, and 0.09 GW/cm2 for LSchottky-Ohmic = 4, 6, 11, and 15 μm, respectively, by considering the FOM = BV2/Ron, sp. Device structure, forward I–V and reverse breakdown characteristics are shown in Fig. 18. Following the first lateral β-Ga2O3 SBD, Hu et al. also developed a field-plated lateral β-Ga2O3 SBD with record-high reverse blocking voltage of more than 3 kV and high DC power FOM of 500 MW/cm2[51]. In this study, an even thicker (650 nm) β-Ga2O3 nano-membrane channel is used to improve the on-current and hence reducing the Ron,sp and the field plate structure is used to mitigate the E crowding effect at the anode edge. The record-high BV of more than 3 kV is demonstrated on a SBD with LSchottky-Ohmic = 24 μm with low Ron,sp of 24.3 mΩ·cm2. In addition to the high BV of more than 3 kV, a record high power FOM of 0.5 GW/cm2 is also achieved on the SBD with LSchottky-Ohmic = 16 μm and BV = 2.25 kV. The device structure, reverse characteristics and benchmark comparisons between lateral and vertical SBDs are shown in Fig. 19.
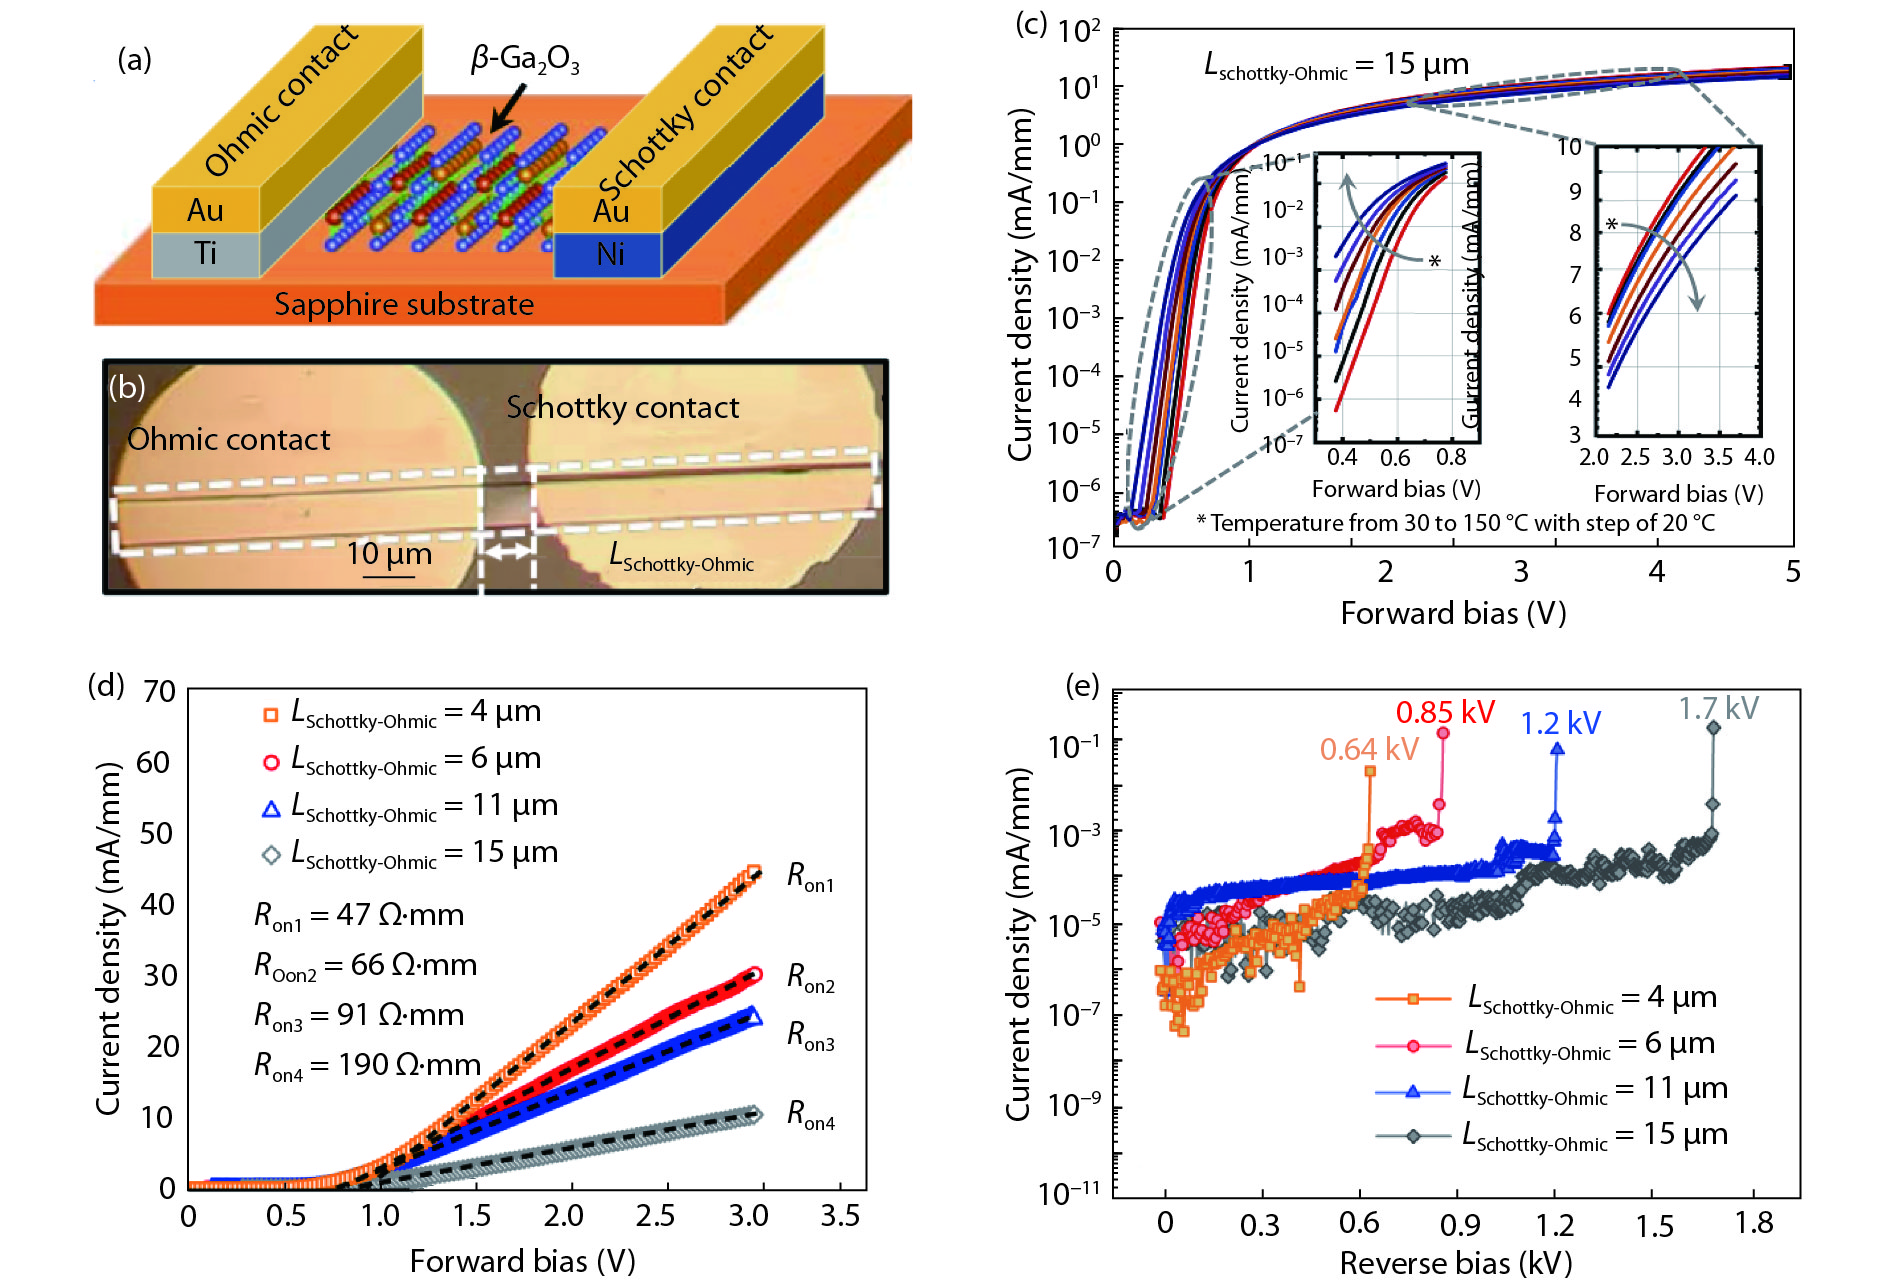
Fig. 18 (Color online) (a) Schematic-view and (b) top-view microscopy image of a fabricated lateral β-Ga2O3 SBD on sapphire substrate. (c) Log-scale forward characteristics of β-Ga2O3 SBD with LSchottky-Ohmic = 15 μm at the temperature range from 30 to 150 °C with 20 °C as a step. (d) Linear-scale forward I–V characteristics of β-Ga2O3 SBDs with various LSchottky−Ohmic. (e) Reverse I–V characteristics of lateral β-Ga2O3 SBDs with various LSchottky−Ohmic. Reprinted from IEEE JEDS 6, 815, 2018. Copyright of 2018 IEEE[66].
Download figure:
Standard image
Fig. 19 (Color online) (a) Tilted 3-D schematic-view and (b) top-view microscopy image of a fabricated lateral field-plated β-Ga2O3 SBD on Sapphire substrate. (c) Forward I–V and differential Ron–V characteristics in linear scale. The inset shows as-measured current dependence on the width of the SBD at a similar LAC of 14–18 μm. (d) Reverse I–V characteristics of lateral SBDs with field plate structure and various LAC. (e) DC RON,SP versus BV of some both lateral and vertical β-Ga2O3 SBDs. Reprinted from IEEE Electron Device Lett, 39, 1564, 2018. Copyright of 2018 IEEE[51].
Download figure:
Standard image4.3.2. High performance back-gate D/E-modes β-Ga2O3 on insulator (GOOI) FETs
Zhou et al. reported on achieving record-high on-current with a back-gated FETs based on β-Ga2O3 nano-membrane channels[67, 68]. Figs. 20(a) and 20(b) are the schematic of a GOOI FET and atomic force microscopy (AFM) image of a β-Ga2O3 surface after cleavage, which shows atomically flat and uniform within the whole nano-membrane. Device fabrication commenced with 6 mm by 6 mm (-201) β-Ga2O3 bulk substrate with Sn doping concentration of 3 × 1018 cm−3 and 8 × 1018 cm−3. Various β-Ga2O3 nano-membranes with thickness from 50 to 150 nm, confirmed by the AFM measurements, were chosen for the device fabrication. Fig. 21(a) presents the D-mode DC output characteristics (ID–VDS). Devices have a LCH of 0.3 μm, channel width (W) of 0.15 μm and channel thickness (t) of 70 nm for 8.0 × 1018 cm−3, and W = 0.6 μm and t = 100 nm for 3.0 × 1018 cm−3 device, respectively. A record high maximum ID (IDMAX) of 1.5 A/mm is obtained, which is more than 2 times of lower doping channel. The device also has a much lower Ron of 5 Ω·mm compared with that of 11 Ω·mm with 3.0 × 1018 cm−3 doping concentration. Fig. 21(b) is the log-scale ID–gm–VGS transfer characteristics of the same D-mode GOOI FET with 8.0 × 1018 cm−3 doping concentration. This D-mode GOOI FET has a threshold voltage (VT) of −135 V, extracted from the log-scale ID–VGS at VDS = 1 V and ID = 0.1 mA/mm. Figs. 21(c) and 21(d) depict the ID–VDS output and ID–gm–VGS transfer characteristics of an E-mode GOOI FET with LCH = 0.3 μm, t = 55 nm and W = 0.17 μm for 8.0 × 1018 cm−3, and t = 75 nm and W = 0.45 μm for 3.0 × 1018 cm−3 device also shown in Fig. 21(c) as black dashed curves for comparison. A record high IDMAX = 1.0 A/mm for higher doping channel is obtained, which is more than 80% higher than lower doping channel. E-mode GOOI FET has a VT of 2 V determined from the ID–VGS at VDS = 1 V and ID = 0.1 mA/mm. Further scaling the LCH shows no significant help in boosting the IDMAX, which is primarily limited by the high RC of low doping channel underneath the contact. The improved IDMAX of D/E-mode devices mainly originate from the higher doping concentration induced lower Rc rather than the simply LCH scaling. Finally, benefiting from its wide-bandgap and a low damage transfer process, both D/E-mode devices have achieved high on/off ratio of 1010 and low SS of 150–165 mV/dec for a 300 nm thick SiO2.
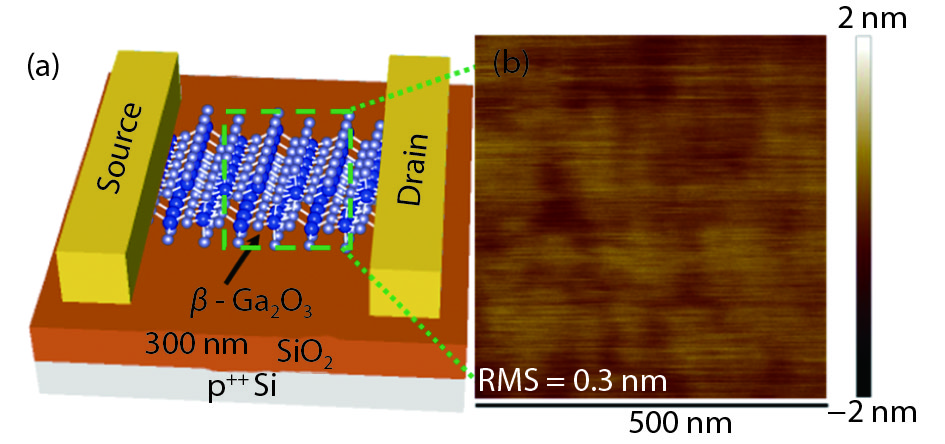
Fig. 20 (Color online) (a) Schematic view of a GOOI FET with a 300 nm SiO2 layer on Si substrate and (b) AFM image of the atomic flat β-Ga2O3 surface after cleavage. Reprinted from IEEE Electron Device Lett, 38, 103, 2017. Copyright of 2017 IEEE[68].
Download figure:
Standard image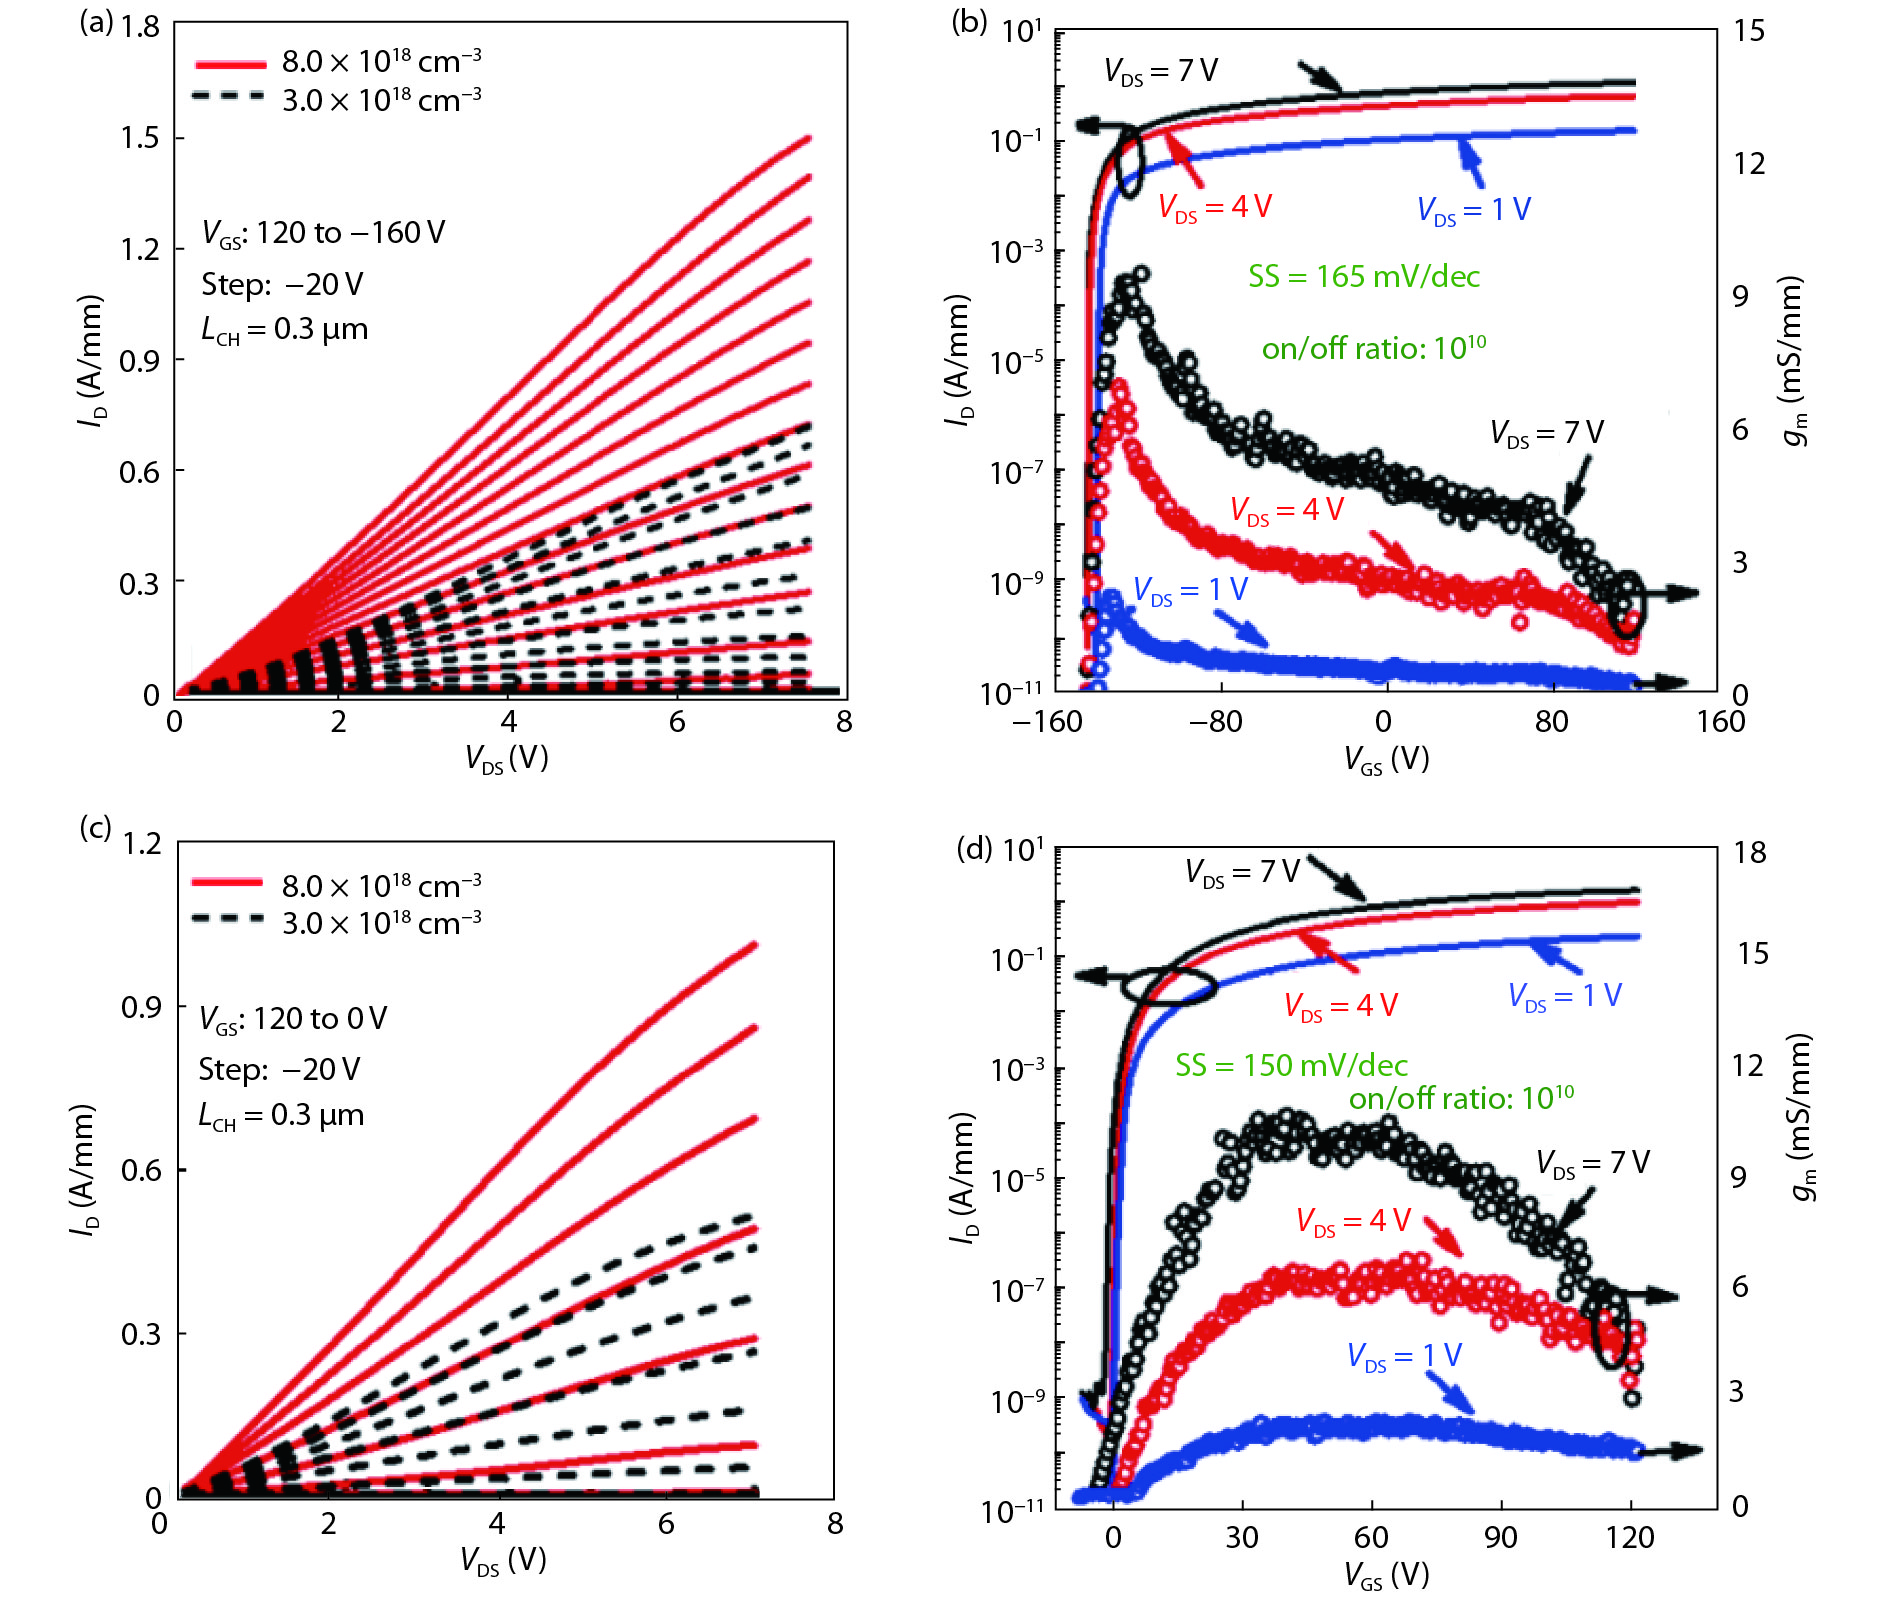
Fig. 21 (Color online) (a) and (c) are ID–VDS output characteristics of D- and E-mode GOOI FETs with 3.0 × 10¹⁸ and 8.0 × 1018 cm−3 doping channel, respectively. (b) and (d) are ID–gm–VGS transfer characteristics of D-mode and E-mode GOOI FETs with 8.0 × 1018 cm−3 doping channel, respectively. Record high IDMAX of 1.5 and 1.0 A/mm are demonstrated for D/E mode devices. Both D and E-mode devices have high on/off ratio of 1010 and low SS of 150–165 mV/dec for 300 nm SiO2. Reprinted from Appl Phys Lett, 111, 092102, 2017. Copyright of 2017 AIP[67].
Download figure:
Standard image4.3.3. VT dependence on the β-Ga2O3 Nano-membrane Thickness
It is found that the VT shifts from negative values in D-mode to positive values in E-mode by shrinking β-Ga2O3 nano-membrane thickness. Fig. 22(a) describes the thickness dependent representative ID–VGS characteristics. Obviously, the VT is shifted from negative to positive when the thickness is slowly reduced. Fig. 22(b) summarizes the extracted thickness dependent VT of 15 devices. Generally, they all follow the same trend as shown in Fig. 22(a). The determined thickness dependent VT may be valuable in the realization of high performance top gate E-mode GOOI FETs in the near future.

Fig. 22 (Color online) (a) Thickness dependent ID–VGS plots of various GOOI FETs from D-mode of thicker β-Ga2O3 to E-mode of thinner β-Ga2O3. (b) Thickness dependent VT extracted at VDS = 1 V of 15 devices. Reprinted from IEEE Electron Device Lett, 38, 103, 2017. Copyright of 2017 IEEE[68].
Download figure:
Standard imageThe significant VT shift with respect to different β-Ga2O3 nano-membrane thickness is due to the surface depletion of the unpassivated device surface, which has tremendous dangling bonds and surface states on the device surface[69]. This is the reason why E-mode GOOI FETs can also be realized in high doping β-Ga2O3 nano-membrane. The surface depletion effect could be verified by using ALD to deposit 15 nm Al2O3 on top to passivate the top surface. As shown in Fig. 23(a), the VT is significantly shifted to the left for more than 70 V after an ALD passivation, verifying the existence of top and bottom surface depletion on unpassivated GOOI FET surfaces. Based on the surface depletion, each surface depleted charge density (ns) can be estimated by using the TCAD C–V simulation to match the measured and simulated VT from E-mode devices with VT near zero. The ns is determined and simulated to be 1.2 × 1013 cm−2 and 2.2 × 1013 cm−2 for 3.0 × 1018 cm−3 and 8.0 × 1013 cm−3 nano-membranes with thickness of 80 nm and 55 nm, respectively. Higher ns for higher doping β-Ga2O3 nano-membrane is most likely related to the higher surface states with more Sn+4 dopants. Therefore, the actual C–V curve and ID–VGS curves are significantly shifted to the right compared with the ideal case without considering surface depletion. Fig. 23(b) shows the simulated C–V curve for E-mode GOOI FET and the VT from C–V simulation is in good agreement with the VT from ID–VGS characterization. Figs. 23(c) and 23(d) are the simulated band diagram of the E-mode GOOI FET at VGS = 0 V with lower doping and higher doping channels by considering surface depletion effect. The top and bottom depletion regions pull up the conduction band of β-Ga2O3 with very few carriers left behind in the nano-membrane, so that E-mode GOOI FET can be formed.

Fig. 23 (Color online) (a) ID–VGS comparison between GOOI FETs with and without ALD passivation for β-Ga2O3 nano-membrane with doping concentration of 3.0 × 1018 cm−3, (b) simulated C–V curve for E-mode GOOI FET at a β-Ga2O3 nano-membrane thickness of 80 nm and doping concentration of 3.0 × 1018 cm−3 after considering the top and bottom negative surface charge (ns = 1.2 × 1013 cm2) depletion effect. Band diagram and electron density distribution of E-mode GOOI FETs with surface negative charge depletion on (c) lower doping (ns = 1.2 × 1013 cm−2) and (d) high doping (ns = 2.2 × 1013 cm−2) β-Ga2O3 nano-membrane channels at VGS = 0 V. Reprinted from Appl Phys Lett, 111, 092102, 2017. Copyright of 2017 AIP[67].
Download figure:
Standard image4.3.4. Solutions to the severe self-heating effects on β-Ga2O3 FETs
Self-heating effect induced temperature increase and non-uniform distribution of dissipated power have emerged as one of the most dominant concerns in the degradation of the ID, output power density (P), as well as the gate leakage current, device variability, and reliability[70]. This effect would become severe in high power device with a low thermal conductivity (κ) substrate such as β-Ga2O3, whose κ is just 10–25 W/m·K, which has become one of major challenges to realize practical application. An effective approach to mitigate low κ problem is to utilize a higher κ substrate rather than the β-Ga2O3 native substrate through a potential wafer bonding technique. Nowadays, all the GOOI FETs were fabricated on the SiO2/Si substrate, however the κ of SiO2 is just 1.5 W/(m·K). For the thermal management of GOOI FETs, a higher κ substrate is urgently needed. Diamond has the highest thermal conductivity (κ = 1000–2200 W/(m·K)) among all available substrates; thus, it is of great interest to investigate the heat dissipation effect of β-Ga2O3 devices on diamond. Meanwhile, diamond is also a current blocking substrate for transferred β-Ga2O3 nano-membranes due to its wide bandgap of 5.47 eV. In this section, sapphire and diamond substrates are used as a thermal conductor for GOOI FETs to solve the severe self-heating effect and enhance the thermal dissipation and boost device performance[71, 72]. An ultra-fast, high-resolution thermos-reflectance (TR) imaging technique[73] is introduced and then applied to the top-gate GOOI FET to examine the reduced self-heating effect and local surface temperature increase magnitude on sapphire and diamond substrates compared with SiO2/Si substrate. After substituting SiO2/Si with sapphire and diamond substrates, the top-gate GOOI FET has 70% and 2 times higher IDMAX, ~ 3 times and 8 times lower device surface temperature change ΔT, and 3 times and 8 times lower thermal resistance (RT), respectively.
Figs. 24 (a)–24(c) are the device schematic and SEM images of fabricated GOOI FETs, respectively. Source and drain regions were defined by the VB6 EBL, followed by Ti/Al/Au (15/60/50 nm) metallization and lift-off processes. 15 nm of Al2O3 was deposited by ASM F-120 ALD at 180 °C with tri-methyl-aluminum (TMA) and H2O as precursors. Finally, Ni/Au (50/50 nm) is deposited as the gate electrode, followed with lift-off process.

Fig. 24 (Color online) Cross-section schematic view of a top-gate GOOI FET on (a) SiO2/Si and (b) sapphire and diamond substrates with different κ marked. 15 nm of Al2O3 is used as the gate dielectric, Ti/Al/Au (15/60/50 nm) is used as the source/drain electrodes, and Ni/Au (30/50 nm) is used the gate electrode. (c) False-colored SEM top-view of a GOOI FET with LG = 1 μm and LSD = 6 μm. Reprinted from ACS Omega 2,11, 2017. Copyright of 2017 ACS[71].
Download figure:
Standard imageFigs. 25(a), 25(b) and 25(c) show the well-behaved DC ID–VDS of three top-gate GOOI FETs with LSD of 6/6.5 μm, LG of 1 μm, and channel thickness of 73/75/74 nm on SiO2/Si, sapphire and diamond substrates, respectively. IDMAX of 960, 535 and 325 mA/mm for diamond, sapphire and SiO2/Si substrates are obtained. IDMAX of GOOI FET on diamond and sapphire substrates is around 3 times and 1.7 times of that on SiO2/Si substrate, originating from better transport properties at a lower device temperature. Fig. 25(d) is the ID–VDS comparison at a fixed VGS = 6 V. Figs. 25(e) and 25(f) depict the ID–VGS and gm–VGS of GOOI FETs on three substrates at VDS = 25 V. High on/off ratio of 109 and low SS of 65 mV/dec are achieved on both devices due to the wide bandgap and high-quality ALD Al2O3/β-Ga2O3 interface, yielding a low interface trap density (Dit) of 2.6 × 10¹¹ eV−1·cm−2 by the equation SS = 60 × (1 + qDit/Cox) mV/dec at room temperature, where Cox is the oxide capacitance. One interesting phenomenon is that the peak gm of diamond and sapphire substrate is 34 mS/mm and 21 mS/mm, which is around 2 times and 60% higher than the gm of SiO2/Si substrate. The extrinsic electron field-effect mobility (μFE) of GOOI FET on diamond, sapphire and SiO2/Si are roughly extracted to be 43, 30.2 and 21.7 cm2/(V·s), respectively, benefiting from the less SHE on diamond.
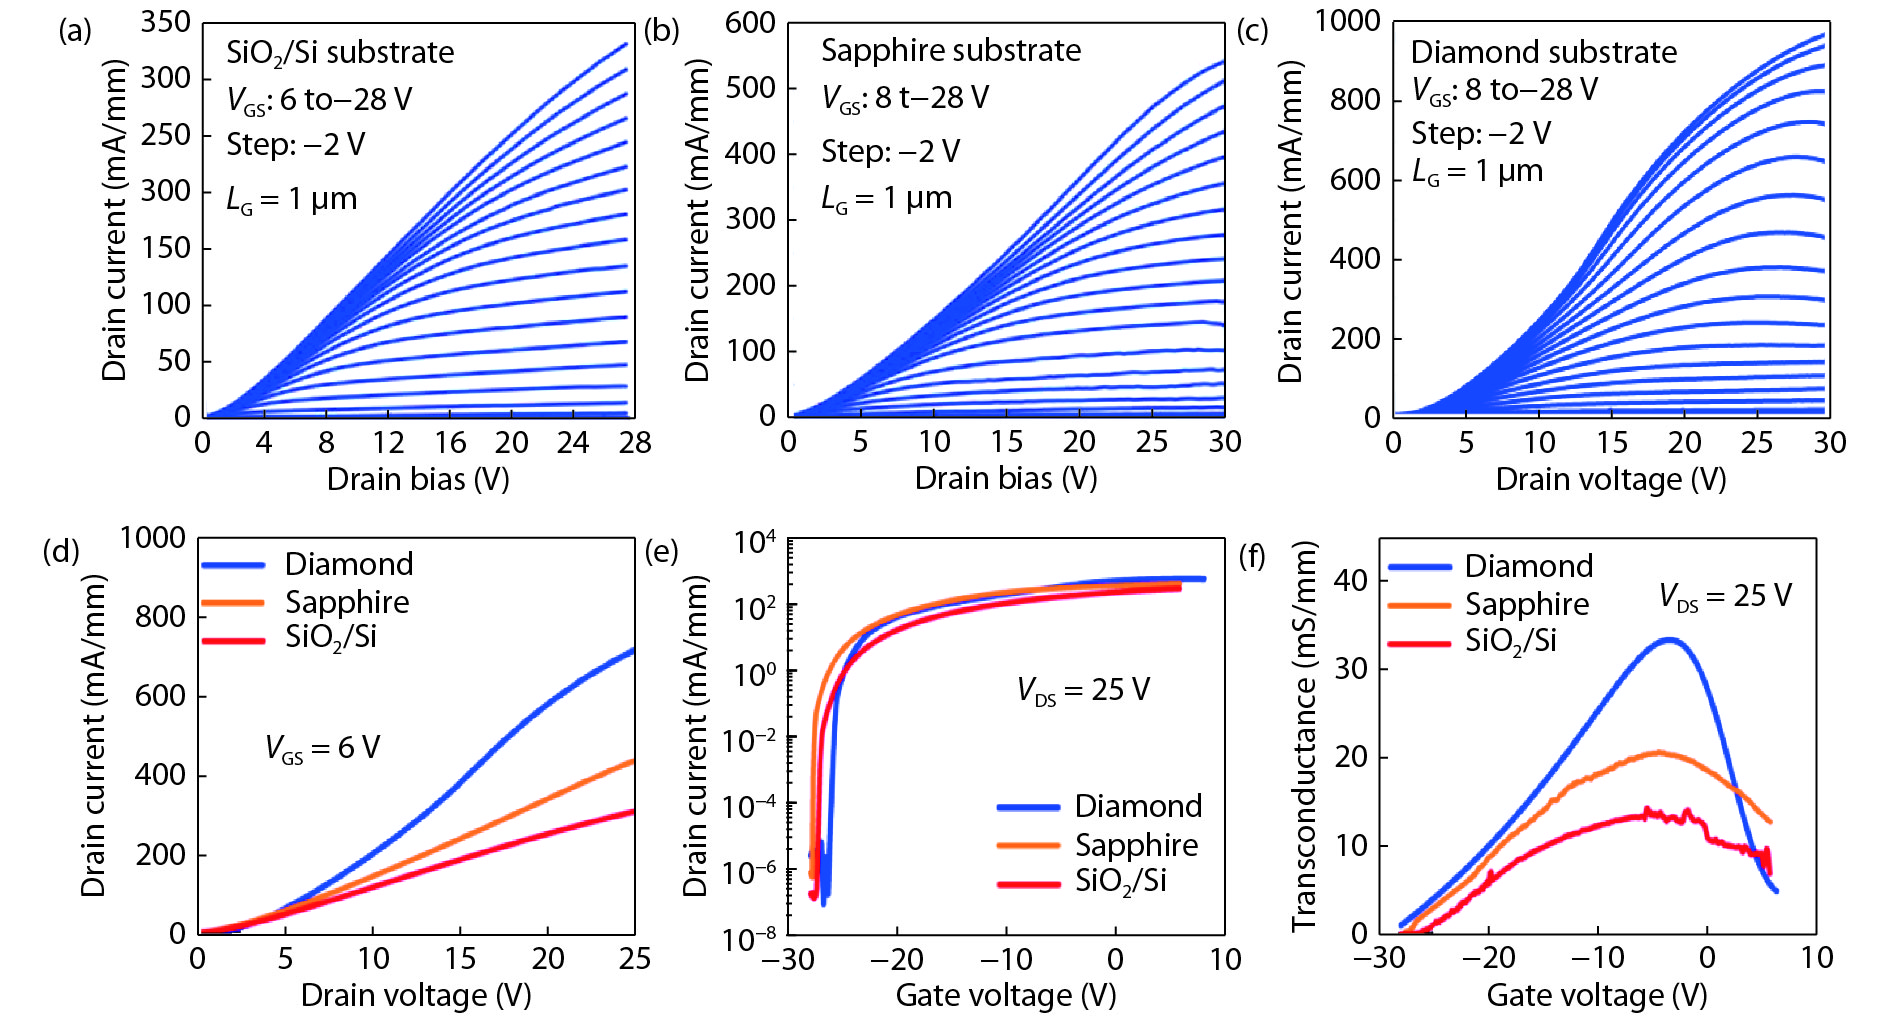
Fig. 25 (Color online) ID–VDS characteristics of GOOI FETs on (a) SiO2/Si, (b) sapphire and (c) diamond substrates with LSD = 6–6.5 μm and LG = 1 μm. A high IDMAX = 960 mA/mm is demonstrated on top-gate β-Ga2O3 GOOI FETs. Comparison of (d) ID−VDS (e) log-scale ID−VGS and (f) linear-scale gm−VGS of β-Ga2O3 FETs on a diamond, sapphire and SiO2/Si substrates. ID–VGS transfer characteristics of GOOI FETs on three substrates with high on/off ratio of 109 and low SS of 65 mV/dec, yielding a low Dit of 2.6 × 10¹¹ eV−1·cm−2. Higher gm shows higher electron μ on diamond due to the reduced device temperature. Reprinted from ACS Omega 2,11, 2017. Copyright of 2017 ACS[71] and 2018 IEEE[72].
Download figure:
Standard imageFigs. 26(a), 26(b) and 26(c) are the merged optical and TR thermal image views of GOOI FETs on SiO2/Si, sapphire and diamond substrates at steady state and different P conditions. As higher VDS is applied, the device is heated up simultaneously and the corresponding ΔT is increased. At P = 717 W/mm2 on the SiO2/Si substrate, the ΔT is measured to be 106 K, whereas in contrast the ΔT is just 43 and 21 K at a higher P = 917 W/mm2 and P = 1237 W/mm2 on the sapphire and diamond substrates, respectively. Fig. 26(d) depicts the measured and simulated ΔT versus P (W/mm2) for the Ga2O3 FETs on a diamond substrate, performed both by TR imaging and Raman thermography. Good agreement among these three methods can be observed, with the highest temperature measured by Raman thermography to be 164 °C (ΔT = 141 K) at DC output power of 6565 W/mm2 (64.7 W/mm or VDS = 35 V for this particular exfoliated FET geometry). Fig. 26(e) shows the good agreement of the TR measured and the simulated ΔT versus P (W/mm2) on different substrates. For both the measurement and simulation results, the clear observation is that at the same P, the GOOI FET on the diamond substrate has more than 8 times lower ΔT compared to that on SiO2/Si. The RT of diamond, sapphire and SiO2/Si substrates are calculated to be 1.71 × 10⁻², 4.62 × 10⁻² and 1.47 × 10⁻¹ mm2·K/W, respectively, through RT = ΔT/P. The reduced RT of GOOI FET on diamond and sapphire demonstrate that a higher κ substrate can be more effective in dissipating the heat on the devices. With less heat on the device, the temperature is lower so that the μ is higher to achieve a higher IDMAX of 960 mA/mm for a better device performance.
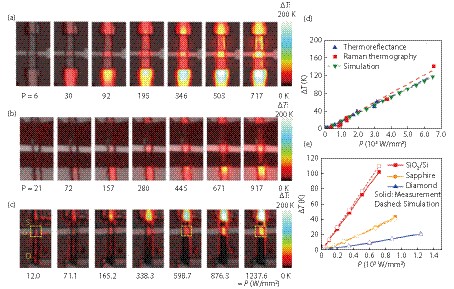
Fig. 26 (Color online) TR and charge-coupled device (CCD) camera merged images of GOOI FET on (a) SiO2/Si, (b) sapphire and (c) diamond substrates when device P is increased by increasing VDS at VGS = 0 V. (d) Comparison of measured or simulated ΔT versus P (W/mm2) characteristics of top-gate GOOI FETs on a diamond substrate using TR imaging, Raman thermography and the thermal simulations. (e) Measured by TR method and simulated ΔT versus P characteristics of top-gate GOOI FETs on different substrates. The ΔT of GOOI FET on the SiO2/Si substrate is more than 3 and 8 times of that on the sapphire and diamond substrates at the same P. As a result, the RT of GOOI FET on the sapphire substrate is 4.62 × 10⁻² and 1.71 × 10⁻² mm2·K/W, which is less than 1/3 and 1/8 of that on the SiO2/Si substrate. Reprinted from ACS Omega 2,11, 2017. Copyright of 2017 ACS[71].
Download figure:
Standard image4.3.5. β-Ga2O3 nano-membrane ferroelectric (FE)-FET with steep ss for wide bandgap logic application
High-temperature solid-state devices and circuits are required for many applications such as in aerospace, automotive, nuclear instrumentations and geothermal wells. Silicon-based complementary metal–oxide–semiconductor (CMOS) technology is not able to operate at such high temperatures, which is limited by its relatively small band gap of 1.12 eV. CMOS circuits using wide band gap semiconductors are promising in these high temperature logic applications. As for the logic application, steep SS is required so as to minimize the power supply so that power consumption and SHE are less severe. In this section, β-Ga2O3 FE-FETs with ferroelectric HZO as a gate dielectric stack is reviewed[74]. Fig. 27(a) shows the schematic diagram of β-Ga2O3 FE-FETs, which consists of a 86 nm thick β-Ga2O3 nanomembrane as the channel, a 3 nm amorphous Al2O3 layer and a 20 nm polycrystalline HZO layer as the gate dielectric, a n++ silicon substrate as the gate electrode, and a Ti/Au source/drain as the metal contacts. Fig. 27(b) shows the false-color SEM image of the fabricated β-Ga2O3 FE-FETs with four different channel lengths, capturing the β-Ga2O3 membrane and the Ti/Au electrodes.
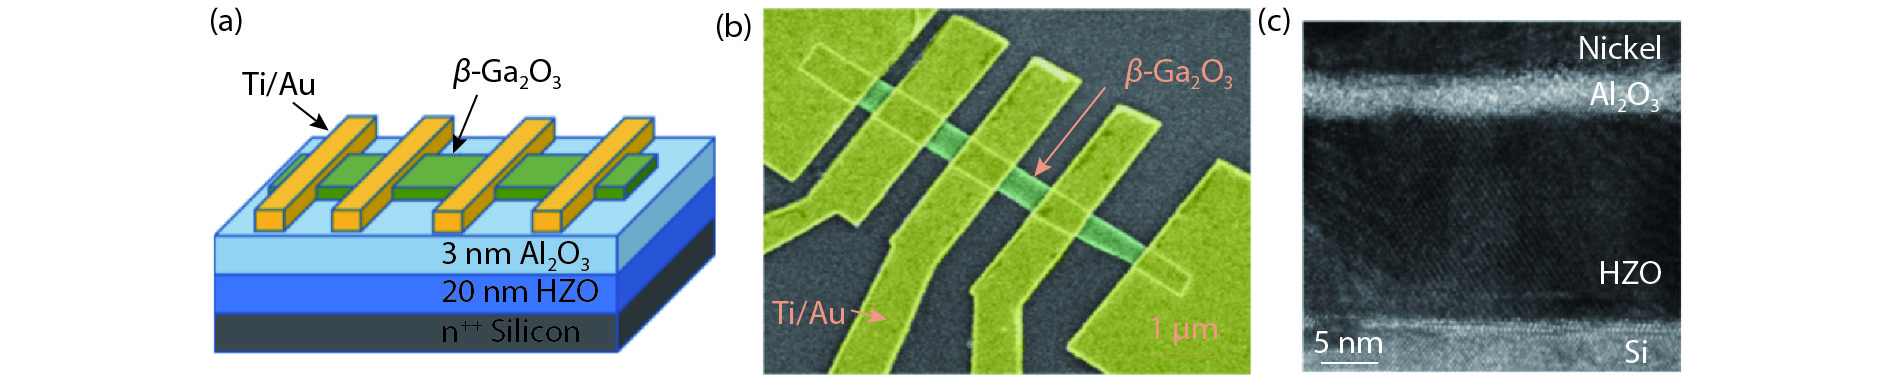
Fig. 27 (Color online) (a) Schematic view of β-Ga2O3 FE-FETs. The gate stack includes a heavily n-doped Si as the gate electrode, 20 nm HZO as the ferroelectric insulator, 3 nm Al2O3 as the capping layer. Ti/Au (30/60 nm) is used as the source/drain electrodes. Sn-doped n-type β-Ga2O3 (86 nm) is used as the channel. (b) Top-view false-color SEM image of representative β-Ga2O3 FE-FETs on the same membrane with different channel lengths. (c) Cross-sectional view of the HZO/Al2O3 gate stack, capturing the polycrystalline HZO and the amorphous Al2O3. Reprinted from ACS Omega 2,10, 2017. Copyright of 2017 ACS[74].
Download figure:
Standard imageFig. 28(a) shows the normalized ID–VGS characteristics in the log scale of a β-Ga2O3 FE-FET. The back-gate bias is swept from −0.4 to 2 V in 40 mV per step, whereas the VDS is biased at 0.1, 0.5, and 0.9 V. The whole sweep takes roughly 1 min. This device has a LCH of 0.5 μm and a thickness of 86 nm. This particular thickness is chosen to tune the VT slightly above zero. The ID−VGS characteristics were measured in bidirectional both forwardly (VGS from low to high) and reversely (VGS from high to low). SS is extracted as a function of ID for both forward sweep (SSmin,For) and reverse sweep (SSmin,Rev) at various VDS. Figs. 28(b)–28(d) show the SS–ID characteristics extracted from Fig. 28(a) at VDS = 0.1, 0.5, and 0.9 V, respectively. The device exhibits SSmin,For = 57.2 mV/dec and SSmin,Rev = 41.0 mV/dec at VDS = 0.1 V, SSmin,For = 53.1 mV/dec and SSmin,Rev = 34.3 mV/dec at VDS = 0.5 V, and SSmin,For = 55.0 mV/dec and SSmin,Rev = 34.4 mV/dec at VDS = 0.9 V. SS less than 60 mV/dec at room temperature is demonstrated for both forward and reverse VGS sweeps even at relatively high VDS. Ga2O3 MOSFETs with 15 nm Al2O3 as a gate dielectric exhibit a minimum SS = 118.8 mV/dec. SS–ID characteristics at different VDS are similar, slightly better at high VDS because of the larger impact of a Schottky barrier at lower VDS. Because of the large band gap of β-Ga2O3, the band-to-band tunneling current at high VDS is suppressed. Fig. 29(a) shows the ID–VGS characteristics in the linear scale of the same β-Ga2O3 FE-FET as in Fig. 28. VT is extracted by linear extrapolation at VDS = 0.1 V for both forward and reverse VGS sweeps. VT in the forward VGS sweep (VT, For) is extracted as 0.47 V, whereas VT in the reverse VGS sweep (VT, Rev) is extracted as 0.38 V. Hence, the E-mode operation with VT greater than zero for both forward and reverse VGS sweeps is demonstrated. A negligible hysteresis is obtained for both on-state (high VGS, as shown in Fig. 10(a)) and off-state (low VGS, as shown in Fig. 28(a)), except that when VGS is near the VT region. At the VT, low hysteresis is achieved to be 90 mV, calculated by using |VT, Rev − VT, For|, showing the great promise of using β-Ga2O3 for wide bandgap logic applications.
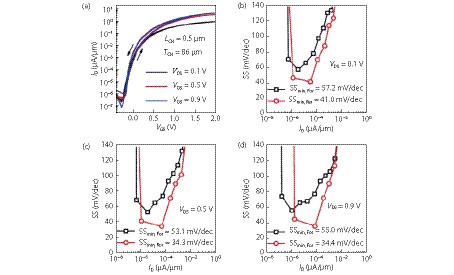
Fig. 28 (Color online) (a) ID–VGS characteristics in the log scale of a β-Ga2O3 FE-FET. This device has a channel length of 0.5 μm and a channel thickness of 86 nm. SS versus ID characteristics of the same device in (a) at (b) VDS = 0.1, (c) VDS = 0.5, and (d) VDS = 0.9 V. SS less than 60 mV/dec at room temperature is demonstrated for both forward and reverse VGS sweeps. Reprinted from ACS Omega 2,10, 2017. Copyright of 2017 ACS[74].
Download figure:
Standard image
Fig. 29 (Color online) (a) ID−VGS characteristics in the linear scale of the same β-Ga2O3 FE-FET as in Fig. 9. (b) ID−VDS characteristics of the same β-Ga2O3 FE-FET as in Fig. 9. Reprinted from ACS Omega 2,10, 2017. Copyright of 2017 ACS[74].
Download figure:
Standard image5. Conclusions
In conclusion, significant progresses have been achieved with remarkable power device performances even at this premature development stage, such as BV more than 3 kV of lateral Schottky Rectifiers, high current density 1.5/1 A/mm of D/E-modes FETs, BV of 1.8 kV for field-plated lateral MOSFET and fT/famx of 5.1/17.1 GHz, respectively. In addition to device performance, sufficient low defect density less than 103 cm−2 of melt-grown native substrate and very smooth surface with RMS roughness less than 0.5 nm of epitaxial β-Ga2O3 thin film on its native substrate have all been demonstrated. However, some open questions about how to realize p-type β-Ga2O3 and how to resolve the low thermal conductivity issue are yet to be established. Once resolving those aforementioned issues, the bright future of β-Ga2O3 devices as power electronic products are definitely coming soon.