


ABSTRACT
Extended time series of Solar Activity Indices (ESAI) extended the Greenwich series of sunspot area from the year 1874 back to 1821. The ESAI's yearly sunspot area in the northern and southern hemispheres from 1821 to 2013 is utilized to investigate characteristics of the north–south hemispherical asymmetry of sunspot activity. Periodical behavior of about 12 solar cycles is also confirmed from the ESAI data set to exist in dominant hemispheres, linear regression lines of yearly asymmetry values, and cumulative counts of yearly sunspot areas in the hemispheres for solar cycles. The period is also inferred to appear in both the cumulative difference in the yearly sunspot areas in the hemispheres over the entire time interval and in its statistical Student's t-test. The hemispherical bias of sunspot activity should be regarded as an impossible stochastic phenomenon over a long time period.
Export citation and abstract BibTeX RIS
1. INTRODUCTION
Solar activity events appear unevenly in the northern and southern hemispheres, which has been referred to as the north–south (N–S) asymmetry at least since the studies by Spörer (1894) and Maunder (1904; Norton et al. 2014). The N–S asymmetry of solar activity has been manifested in many studies using different features of solar activity (Newton & Milson 1955; Waldmeier 1971; Vizoso & Ballester 1990; Carbonell et al. 1993, 2007; Oliver & Ballester 1994, 1995; Atac & Ozguc 1996, 2006; Temmer et al. 2001, 2002, 2006; Joshi & Joshi 2004; Knaack et al. 2004; Badalyan et al. 2005; Ballester et al. 2005; Gigolashvili et al. 2005; Li et al. 2005; Chang 2008; Nagovitsyn et al. 2010; Bankoti et al. 2011; Goncalves et al. 2014; Xiang et al. 2014), and it is demonstrated to be a real phenomenon and not due to random fluctuations (Carbonell et al. 1993; Li et al. 2002; Temmer et al. 2006; Sykora & Rybak 2010). For example, Carbonell et al. (1993) demonstrated that the N–S asymmetry of sunspot areas was highly or marginally significant in most cases, and it could not be obtained from a random distribution. Vizoso & Ballester (1990), Li et al. (2002, 2009a, 2009b), Carbonell et al. (2007), and Norton et al. (2014) summarized the progress of studies on the hemispheric asymmetry of solar activity.
The N–S hemispherical asymmetry of solar activity clearly displays cyclical behavior (Waldmeier 1957; Verma 1993; Duchlev & Dermendjiev 1996; Pulkkinen et al. 1999; Li et al. 2002, 2009b). Vizoso & Ballester (1990) utilized a straight line to fit the yearly values of the N–S asymmetry of sunspot areas for each of cycles 12–21, and they found that for four cycles the slope of the fitting line (the linear regression) changes its sign, suggesting a periodic behavior of about eight solar cycles. Similarly, Atac & Ozguc (1996) used the same method to fit the yearly values of the N–S asymmetry of the flare index for cycles 17–22, confirming the eight-solar-cycle period. However, if some longer series of solar activity indexes are used, for example, the yearly values of the N–S asymmetry of the numbers of sunspot groups and sunspot area during cycles 8–22 were analyzed using the same fitting method, then cyclical behavior of eight cycles should be unscrambled in a different way, and a long characteristic timescale of about 12 solar cycles could be inferred to appear in the N–S hemispherical asymmetry of solar activity (Li et al. 2002). The uneven distribution of solar activity in the northern and southern hemispheres should lead to the appearance of a dominant hemisphere of solar activity for each solar cycle, and dominant hemispheres were found to regularly appear; alternate and mixed appearances of the north or south dominant hemispheres should display sustained periodic behavior of 12 solar cycles (Li et al. 2002). A long characteristic timescale was also shown by the so-called cumulative counts of solar activity indexes (Li et al. 2001), and even by the cumulative difference (CD) in sunspot activity, respectively, in the northern and southern hemispheres (Li et al. 2009b).
It should be pointed out that in the aforementioned studies, continuous and homogeneous records of sunspot activity in cycles 12–22, combined with other data in cycles 8–11, are utilized to investigate regularity in the N–S asymmetry of long-term solar activity. That is, no single and homogeneous record of sunspot activity longer than 12 cycles has been used to get a 12 cycle period.
Extended time series of Solar Activity Indices (ESAI) is a collection of long-term recorded data of solar activities, which assembles both observational and simulated sets to investigate solar magnetic variations and their influence on the Earth, and the ESAI extended the ordinary lengths of some traditional indices of solar activities, such as sunspot areas, polar faculae numbers, and so forth (Nagovitsyn et al. 2004a, 2004b, 2007). For example, the Greenwich series of sunspot area has been extended from the year 1874 back to 1821, so the series of sunspot area is available since solar cycle 7. Due to historical sunspot counts being somewhat contentious, the absolute sunspot area is preferred over the international sunspot number as a diagnostic for asymmetry (Norton et al. 2014). The single and homogeneous series of sunspot area is the most suitable data set for investigating the 12 cycle period that we have found at present. Here, ESAI's yearly hemispherical sunspot area from cycles 7–23 is used to further investigate periodical behavior in the N–S hemispherical asymmetry of sunspot activity.
2. REGULARITY OF THE N–S ASYMMETRY OF SOLAR ACTIVITY
2.1. Data
ESAI merged pre-Greenwich observational data sets (by Schwabe, Carrington, De La Rue, Sporer), post-Greenwich observations (by Gnevysheva), and the Greenwich general system of sunspot areas into one so that the Greenwich series of sunspot area could be extended from the year 1874 back to 1821, and the ESAI extension occupies a reasonable part of the total duration of the homogeneous series of sunspot areas (Nagovitsyn et al. 2004a, 2004b (a short variant of 2004a)). Here, the yearly sunspot area from 1821 to 2013 is utilized, covering 17 complete cycles (cycles 7–23). The ESAI database is located at http://www.gao.spb.ru/database/esai/. Figure 1 shows the yearly sunspot area in millionths of the solar hemisphere ( ), respectively, in the northern and southern hemispheres.

Figure 1. Yearly sunspot area, respectively, in the northern (the solid line) and southern (the dashed line) hemispheres from the years 1821–2013. The dotted lines are the minimum times of the sunspot cycles.
Download figure:
Standard image High-resolution image2.2. Regularity of Dominant Hemispheres for Solar Cycles
The normalized north–south hemispheric asymmetry of a solar activity index is usually used to reflect the biased distribution of solar activity in the two hemispheres and is generally defined as:  , where Nn and Ns stand for the value of the considered index corresponding to the northern and southern hemispheres, respectively (Newton & Milson 1955). We compute the averaged sunspot area, respectively, in the northern and southern hemispheres over each of the complete cycles, which is shown in Table 1, and then the asymmetry value of the mean sunspot area is calculated and also listed in the table.
Table 1. Activity of the Sunspot Area Averaged Over a Solar Cycle in the Hemispheres
| Cycle | NON | NOS | Asymmetry | Probability | Dominant |
|---|---|---|---|---|---|
| No. | Hemisphere | ||||
| 7 | 364 | 232 | 0.2214 |

|
north |
| 8 | 569 | 482 | 0.0827 |

|
north |
| 9 | 419 | 370 | 0.0621 |

|
north |
| 10 | 379 | 426 | −0.0583 |

|
south |
| 11 | 407 | 475 | −0.0770 |

|
south |
| 12 | 221 | 312 | −0.1707 |

|
south |
| 13 | 270 | 337 | −0.1103 |

|
south |
| 14 | 232 | 245 | −0.0272 |

|
⋯ |
| 15 | 361 | 296 | 0.0989 |

|
north |
| 16 | 381 | 325 | 0.0793 |

|
north |
| 17 | 462 | 451 | 0.0120 |

|
⋯ |
| 18 | 619 | 582 | 0.0308 |

|
⋯ |
| 19 | 856 | 638 | 0.1459 |

|
north |
| 20 | 482 | 337 | 0.1770 |

|
north |
| 21 | 623 | 640 | −0.0134 |

|
⋯ |
| 22 | 566 | 639 | −0.0605 |

|
south |
| 23 | 390 | 448 | −0.0692 |

|
south |
Download table as: ASCIITypeset image
In order to determine whether or not the asymmetry value is of statistically significant, a theoretical probability of the north–south asymmetry distribution is calculated. Considering a distribution of m objects in two classes (for example, the north and south hemispheres), the following binomial formula is utilized to derive the actual probability  of getting n objects in one class (the north or south hemisphere), and
  objects in the other (Carbonell et al. 1993; Li et al. 1998; Carbonell et al. 2007):
The probability of obtaining more than k objects in class 1 is
If the probability is less than 10%, the distribution should be regarded as a statistically important or marginally significant uneven distribution, and not due to random fluctuation, whereas if the probability is larger than 10%, the distribution should be considered to be equivalent for the two classes, and the asymmetry value is statistically unimportant (Vizoso & Ballester 1990; Li et al. 1998). With this method the dominant hemisphere for a solar cycle can be found, and it is listed in the last column of the table, where ellipses mean that sunspot activity is equivalent in the northern and southern hemispheres. The dominant hemisphere is also illustrated in Figure 2, and the figure clearly shows periodical behavior. When comparing cycle by cycle, the dominant hemispheres arranged from solar cycles 12–17 are found to be the same as those arranged from solar cycles 23–18 (in reverse order), with a "mirror" placed at the middle of cycles 17 and 18. Except for cycle 9, the dominant hemispheres from cycles 7–11 are the same as those from cycles 16–12 (in reverse order), with a "mirror" located between cycles 11 and 12, and the same as those from cycles 19–23. For cycle 9, equivalent solar activity is expected for the two hemispheres; however, the dominance of sunspot activity actually occurs in the northern hemisphere. Li et al. (2002) once clarified the dominant hemispheres for cycles 12–23 in their Figure 5. Here, Figure 2 is in agreement with and further enhances their result.

Figure 2. Sketch of the dominant hemisphere of the averaged sunspot area over a cycle in each of solar cycles 7–23. The asymmetry value for a cycle whose histogram is located within the two dotted horizontal lines is regarded as equivalence in the hemispheres without a dominant hemisphere. The symbol ? denotes that the inferred regularity is expected to be such a result, but the actual result obtained here contradicts it. The two bold vertical solid lines show a complete period of 12 solar activity cycles. The vertical dashed line cuts the period into two symmetrical parts.
Download figure:
Standard image High-resolution image2.3. Regularity of the Regression Lines of the Yearly Asymmetry Values for Solar Cycles
We calculate the N–S asymmetry value of the yearly averaged sunspot area, which is shown in Figure 3. Then, as in Vizoso & Ballester (1990) and Atac & Ozguc (1996), a linear fitting is taken for the yearly asymmetry values for each of cycles 7–23 separately, starting a cycle with its minimum year, which is also displayed in the figure. A similar figure was given by Li et al. (2002), but just for cycles 8–22 in their Figure 2. Their sunspot area data came from different sources, but here just single ESAI data are used. As the dominant hemispheres show, the fitting lines also present periodical behavior. The signs of the straight lines' slopes at cycles 12–17 are the same in turn as those from solar cycles 23–18, with a "mirror" placed between solar cycles 17 and 18. Except for cycle 10, the signs of the lines' slopes from cycles 7–11 are the same in turn as those from cycles 16–12, with a "mirror" between cycles 11 and 12, and the same from those for cycles 19–23. Based on this behavior, a negative sign is expected for cycle 10. The figure thus suggests a possible period of about 12 solar cycles. Here, the periodical behavior in Figure 3 is in agreement with and further enhances the results of Li et al. (2002).
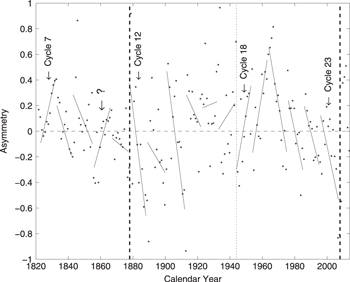
Figure 3. Fitting of a linear regression line to the yearly values (asterisks) of the N–S asymmetry of sunspot areas for each of solar cycles 7–23. The two bold vertical dashed lines show a complete period of 12 solar activity cycles. The vertical dotted line cuts the period into two symmetrical parts. The symbol ? denotes an exception to the inferred periodic behavior.
Download figure:
Standard image High-resolution image2.4. Regularity of the Cumulative Counts of Yearly Sunspot Area in the Hemispheres for Solar Cycles
Li et al. (2001) gave the cumulative counts of the quarterly sunspot group numbers for the northern and southern hemispheres in their Figure 1, and a long-term hemispheric variation of about 12 cycles was inferred to exist. The cumulative count of an index at a certain time point of a time series is the sum of the index starting from the first time point to the time point in question (Li et al. 2001). Similarly, the cumulative counts of yearly sunspot area in the two hemispheres are calculated separately here for each of cycles 7–23, and they are shown in Figure 4. The relationship between the paired lines of a solar cycle for cycles 12–17 is similar to that for cycles 23–18, with a "mirror" placed at the middle of cycles 17 and 18 (for details, please refer to Li et al. 2001), when comparing cycle by cycle. Except for cycle 9, the relationship between the paired lines of a cycle for cycles 7–11 is found to be similar to that for solar cycles 19–23. Therefore, here Figure 4 shows a periodical hemispherical variation of about 12 solar cycles, which is in agreement with and further enhances the result given by Li et al. (2001).

Figure 4. Cumulative counts of yearly sunspot areas in the northern (solid lines) and southern (dashed lines) hemispheres in each of cycles 7–23.
Download figure:
Standard image High-resolution image2.5. Regularity of the Cumulative Difference of Yearly Sunspot Area in the Hemispheres
Based on the concept of the cumulative index of asymmetry (Duchlev 2001), Li et al. (2009b) proposed a new parameter, the CD of sunspot activity respectively in the northern and southern hemispheres to reflect the long-term variation of the N–S hemispherical asymmetry of sunspot activity. The CD is defined as  , where
  and
and  designate the cumulative value of a solar activity index respectively in the northern and southern hemispheres (Li et al. 2009b). By counting the parameters of sunspot groups and sunspot areas, a characteristic timescale of about 12 solar cycles is found to exist in the parameters of the two (Li et al. 2009b). Shown here in Figure 5 is the CD of the yearly value of the northern and southern hemispheric sunspot areas. The CD line forms one and a half sine profiles, and thus a long-term hemispheric variation of about 12 cycles is inferred to exist. Comparing this figure with Figure 3 of Li et al. (2009b), the data of cycles 7–11 are added in this study to form a sine profile. Therefore, Figure 5 shows a long-term hemispheric variation of about 12 cycles, which is in agreement with and further enhances the result given by Li et al. (2009b).
As in Li et al. (2009b), the Student's t-test is used here to test the statistical significance of the CD of the yearly numbers of the northern and southern hemispheric areas of sunspots. Figure 6 displays the calculated Student's t-test values varying with the span of the CD data used (for details, please see Carbonell et al. 2007; Li et al. 2009b). The tabulated Student's t-test values at the 95% probability level are also shown in the figure to judge the statistical significance of the CD series. The calculated values periodically fluctuate around the tabulated-value line, suggesting that a long-term period of about 12 solar cycles should exist in the CD series, as displayed in Figure 4 of Li et al. (2009b).

Figure 5. Cumulative difference of the yearly value of the northern and southern hemispheric sunspot areas. The vertical dotted lines show minimum times of solar cycles.
Download figure:
Standard image High-resolution image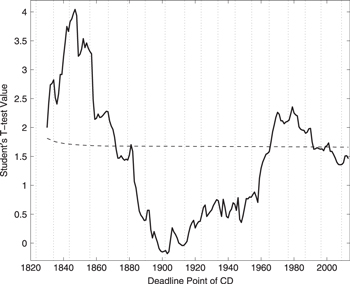
Figure 6. Student's t-test values of the CD distribution for the yearly mean northern and southern hemispheric areas of sunspots (the thick solid line), varying with data length, namely the ending time point of the CD data used. The thin dashed line is the corresponding tabulated values at 95% probability level. The vertical dotted lines show minimum times of solar cycles.
Download figure:
Standard image High-resolution image3. PERIODICITY
In order to further confirm the period of about 12 solar cycles, we performed a period analysis for the the above yearly asymmetry of sunspot areas, and Figure 7 shows the spectrum power. There is indeed a period summit at about 120 years.

Figure 7. Spectrum power of the yearly asymmetry value of sunspot areas.
Download figure:
Standard image High-resolution image
4. DISCUSSION AND CONCLUSIONS
ESAI provides a single and homogeneous series of sunspot area, which is suitable to investigate long-term period behavior of solar activity asymmetry. ESAI's yearly hemispherical sunspot area from the years 1821–2013, covering 17 complete solar cycles (cycles 7–23), is utilized in this study to investigate periodical behavior in the N–S hemispherical asymmetry of sunspot activity. The averaged hemispherical sunspot area in each of the cycles is computed, and the dominant hemispheres are noted for each cycle after a statistical significance test. They display obvious periodical behavior of 12 solar cycles, agreeing with and further enhancing the earlier result given by Li et al. (2002).
A linear fitting is performed on the yearly asymmetry values for each of the cycles. The fitted lines also show periodical behavior: in each of the four cycles the slope of the fitted line changes its sign, seemingly suggesting a periodic behavior of about eight solar cycles, as found by Ballester (1990) and Atac & Ozguc (1996). Of course, such periodic behavior could be explained to be 12 solar cycles in another way. Because this periodic behavior has a complete corresponding relation with that displayed by the dominant hemispheres, here we prefer a cycle length of 12 solar cycles. The present cycle, cycle 24, should be key in this judgement: if the slope of the fitting line for cycle 24 has the same sign as that for cycle 12, the periodic behavior can be inferred to be 12 cycles; otherwise, it should be 8 cycles.
In order to show periodic behavior in hemispherical solar activity, the cumulative counts of yearly sunspot area in the northern and southern hemispheres are also counted for each of the complete cycles. The relationship between the paired lines of a cycle seems to show a long-term hemispheric variation of about 12 cycles, which is in agreement with and further enhances the result given by Li et al. (2001).
The CD of the sunspot activity respectively in the northern and southern hemispheres (Li et al. 2009b) is calculated in this study, and the parameter also displays a long-term characteristic timescale of about 12 cycles. Further, the statistical Student's t-test of the parameter enhances the characteristic timescale. Therefore, the result given by Li et al. (2009b) is validated.
Hemispherical differences in solar activity exhibit a long-term tendency of a characteristic timescale of 12 cycles. Hemispherical solar activity shows differences not only in amplitude but also in phase for solar cycles. Li et al. (2010) investigated both relative phase shifts of the paired wings of butterfly diagrams and the phase lag of the hemispherical solar activity index, and a possible period of about eight cycles is inferred to exist in both. McIntosh et al. (2013) investigated the phase lag through cross-correlation of a 120 month window of the northern and southern sunspot area time series, finding a persistent phase lag that lasted roughly four cycles, in accordance with Li et al. (2010). Such a persistent phase lag can also be found in other ways (Zolotova et al. 2010; Deng et al. 2013). As pointed by Norton et al. (2014), if the N–S phase difference exhibits a long-term tendency, a memory of sorts, it should not be regarded as a stochastic phenomenon; thus, hemispherical solar activity is not stochastic. Within a solar cycle, the N–S asymmetry of solar activity can be strengthened by a relative phase shift or phase lag between the northern and southern hemispheres (Waldmeier 1971; Li et al. 2010). However, the cyclic variation of hemispherical solar activity seems to have little relation with the cyclic variation of its phase lag, because both show different long-term tendencies and different periodicity.
Periodical 11 year sunspot activity is generally thought to be the consequence of a dynamo buried in the solar interior (Babcock 1961). The hemispherical solar activity implies that the solar dynamo should act on the solar hemispheres with different strengths in solar cycle. At present, some dynamo models have been put forward to explain the hemispherical bias of sunspot activity (Goel & Choudhuri 2009; Belucz & Dikpati 2013; Olemskoy & Kitchatinov 2013; Norton et al. 2014; Shetye et al. 2015 and references therein), and in these models some new mechanisms are proposed, such as hemispheric coupling, greater inflows into active region belts in the dominant hemisphere, different hemispherical meridional circulation, random dependence of the poloidal field generation, and so on. Long-term hemispherical solar activity displays some regularity in amplitude and phase, which should force theoretical models to account for the regularity through these mechanisms. Further theoretical study is needed in the future.
Finally, it is important to note that the previously existing observational data are not over a long enough timescale to make the "regularity" completely convincing, and the data presented here illustrate it with exception(s). More extended sunspot area data are required.
The authors thank the referee for constructive suggestions and comments that improved the original version. Yearly sunspot area data used here were downloaded from the ESAI database. The authors express their deep thanks to the ESAI staff. This work is supported by the National Natural Science Foundation of China (11221063 and 11273057), the 973 programs 2012CB957801 and 2011CB811406, and Key Laboratory of Modern Astronomy and Astrophysics (Nanjing University).