


ABSTRACT
We present a spectroscopic abundance analysis of the old, super-metal-rich open cluster NGC 6253, with emphasis on its O abundance. High-dispersion, 7774 Å O i triplet region spectra of 47 stars were obtained using Hydra II on the CTIO Blanco 4 m. Radial velocity analysis confirms 39 stars consistent with single star membership, primarily at the turnoff. Thirty-six of these are included in our abundance analysis. Our differential analysis relative to the Sun yields primarily scaled-solar values, with weighted cluster averages of [O/H] = +0.440 ± 0.020, [Fe/H] = +0.445 ± 0.014, [Al/H] = +0.487 ± 0.020, [Si/H] = +0.504 ± 0.018, and [Ni/H] = +0.702 ± 0.018 (where the errors are  ). We discuss possible origins for the three known super-metal-rich clusters based upon their abundance patterns, Galactic locations, and space motions. The abundance patterns of NGC 6253 are very similar to those of NGC 6791 and NGC 6583. With the possible exception of oxygen, the abundances of these clusters are all close to scaled-solar, and they are similar to patterns seen in metal-rich disk dwarfs and giants. However, they also seem to differ from those of metal-rich bulge stars. We demonstrate that NGC 6253 is unusually oxygen rich (in [O/H]) for its 3.3 Gyr age. While we find [O/Fe] to be scaled-solar for NGC 6253, the more recently reported values for NGC 6791 show a large variation, from values close to scaled-solar down to values at least a factor of two below scaled-solar. We discuss the possibility that the scaled-solar [O/Fe] abundances of NGC 6253 and NGC 6791 might reflect a flattening of the Galactic [O/Fe] versus [Fe/H] relationship. This possibility may be consistent with disk star abundance data, which show an apparent "floor" at [O/Fe]
  for [Fe/H]
  , and with chemical evolution model results, which may predict such a flattening due to a decrease in supernova Fe yields at super-solar-metallicities. Orbit solutions for NGC 6791 allow that it may have formed in the inner disk and was then kicked out, but the origins of the other two much younger clusters remain mysterious. We re-evaluate the age of NGC 6583 in view of the evidence that the cluster is super-metal-rich, and confirm a probable age less than 1 Gyr (best range: 500–900 Myr). We also argue that it is unlikely the cluster is more than 3 kpc away (best range: 2–3 kpc) if the apparent turnoff, main sequence, and giants are all cluster members.
Export citation and abstract BibTeX RIS
1. INTRODUCTION
For more than two decades (e.g., Wheeler et al. 1989), it has been suggested that oxygen, the third most abundant element in the Galaxy, may be a superior tracer for examining Galactic chemical evolution. O has the advantage of originating predominately from one well-defined source: production through He burning in the cores of high-mass stars with lifetimes  yr, which subsequently eject O into the interstellar medium through SNe II. Furthermore, because O is produced by hydrostatic burning prior to the explosion, its yield is fairly secure and depends primarily on the progenitor rather than the details of the explosion (Wheeler et al. 1989). The fact that, compared to the ∼10 Gyr age of the Galaxy, O responds almost instantaneously to enrichment implies that the stellar O abundance has the potential to exhibit a robust correlation with Galactic age. In contrast, the more traditional elemental chronometer, Fe, is generated not only by short-lived high mass stars (with release via SNe II), but also by SNe Ia, which result from white dwarfs left at the end of the lives of low mass stars, on timescales of
  yr. Model calculations indicate that both sources have contributed roughly equally to Galactic Fe production over the lifetime of the Galaxy (Nomoto et al. 1997). Fe enrichment of the interstellar medium therefore crudely reflects a weighted average of the star formation history on timescales of 109 yr and higher. Furthermore, the Fe yield of SNe Ia is produced by radioactive decay of 56Ni during the explosion, and is thus very sensitive to the explosion details, with some scatter in yields expected (Howell et al. 2009). The considerations above may, in part, contribute to the inability of observational studies to discern any evidence of an age–metallicity relation for [Fe/H] among stars formed within the Galactic disk over the last 6 Gyr; see the discussions in Anthony-Twarog et al. (2010) and Maderak et al. (2013).
Unfortunately, progress in the interpretation of O abundance results has been slow due to (1) debate over the reliability of the various oxygen abundance indicators, and (2) the lack of large, reliable samples of stellar O abundances spanning significant ranges of both age and metallicity. The former issue has been discussed extensively (see Maderak et al. 2013, for a review). Abundance estimates for O traditionally rely upon measurements of two groups of lines, the [O i] lines at 6300 and 6363 Å or the O i near-infrared triplet at 7774 Å. The forbidden lines have generally been the preferred set because they are free of NLTE effects, with the 6300 Å line used more often than the 6363 Å line. Unfortunately, these lines are only strong in giants, where stellar evolutionary effects can modify the atmospheric abundance established by Galactic chemical evolution. While convective dredge-up on the red giant branch (RGB) is not expected to affect the surface oxygen abundance, other forms of mixing/processing have not been ruled out (Boesgaard et al. 1999; Schuler et al. 2006; Stasinska et al. 2010).
The solution to the problem of internal evolution is to restrict the sample to dwarfs, where the O i triplet is strong. Unfortunately, it is well-established that these lines are subject to NLTE effects (e.g., Takeda 2003; Shchukina et al. 2005), which lead to an artificial rise in LTE abundances for  6200 K (Takeda 2003; Schuler et al. 2006). In addition, a rise in triplet LTE abundances for
  5500 K that is not predicted by NLTE considerations has been demonstrated (Schuler et al. 2006; Shen et al. 2007; Maderak et al. 2013). The correct explanation for this overabundance trend has not yet been established (see, e.g., Shen et al. 2007; Maderak et al. 2013, for a discussions), but R. M. Maderak et al. (2015, in preparation) have found evidence that it is probably due to chromospheric activity (though other factors, such as photospheric spots, have not yet been completely ruled out). Regardless, the above works have demonstrated convincingly that there is no trend with Teff in the triplet NLTE abundance corrections for solar-gravity, near-solar metallicity dwarfs in the range 6200 K
  5500 K. Therefore, a purely differential analysis of solar-type dwarfs relative to the Sun can eliminate the dilemma over NLTE effects and yield the most reliable stellar O abundances possible.
With a trustworthy means of determining stellar O abundances established, further progress in understanding the chemical evolution of O is now possible. In the absence of stellar age information, the evolution of oxygen in the Galaxy can be traced using the [O/Fe] versus [Fe/H] trend, which is determined by the relative contributions of SN Ia and SN II to chemical enrichment. The slope of this trend for [Fe/H]  remains a matter of debate, despite being the focus of many stellar O abundance studies over the past twenty five years (see Maderak et al. 2013, for a review). For [Fe/H]
  , there is consensus for a linear decrease in [O/Fe] with increasing [Fe/H], with a slope of
  dex
dex![$_{[{\rm O}/{\rm Fe}]}$](https://content.cld.iop.org/journals/1538-3881/149/4/141/revision1/aj510411ieqn12.gif) per dex
per dex![$_{[{\rm Fe}/{\rm H}]}$](https://content.cld.iop.org/journals/1538-3881/149/4/141/revision1/aj510411ieqn13.gif) , but unresolved questions remain for both field stars and the key objects of this investigation, open clusters (OCs).
, but unresolved questions remain for both field stars and the key objects of this investigation, open clusters (OCs).
In contrast with individual field stars, OCs have the potential to supply statistically precise estimates of chemical abundances, distance, and age for one data point in the spatial and temporal evolution of the Galactic disk. The greatest improvement is in age estimation, a challenging if not impossible task for many field stars. A tantalizing early indicator of the potential of the OC population can be found in the work of King (1993, hereafter K93), which showed a strong [O/H] correlation with age over a 7 Gyr range in age, despite the absence of a significant trend in [Fe/H] and a range in [Fe/H] of less than 0.25 dex. However, large, uniform samples of spectroscopic abundances in OCs, particularly O abundances, covering a significant range in both age and metallicity have been lacking. The promising sample of K93 showed no convincing trend in [O/Fe] versus [Fe/H]. A trend of the expected linear form was later found by Friel et al. (2010), who reported O abundances for giants in 11 OCs spanning a range of ∼0.4 dex in [Fe/H]. However, the Friel et al. trend is offset ∼0.15 dex below that typically seen in field star samples, as demonstrated by Figure 6 of Friel et al. (2010), which includes the field star data of Bensby et al. (2005). As such, the problem of clearly establishing the [O/Fe] versus [Fe/H] trend for OCs has not yet been fully resolved. An analysis of O abundances for a statistically significant sample of OC dwarfs could prove invaluable in resolving most, if not all, of the issues discussed above.
Here we present a spectroscopic abundance analysis of the OC NGC 6253 as part of a study of OCs chosen specifically to examine the chemical evolution of galactic O by probing the OC range of parameter space in age and metallicity. NGC 6253 was initially selected because of its exceptionally high metallicity, which made it (at that time) one of only two star clusters known with iron abundances greater than twice solar. It also seemed that its age (3.3 Gyr; see Anthony-Twarog et al. 2010, for a detailed discussion) was roughly half that of the other cluster, NGC 6791 (age ∼8 Gyr). Thus, NGC 6253 provided an exceptional combination of age and metallicity. This unusual mix is perplexing in the context of the conventional understanding of Galactic chemical enrichment, wherein older clusters should have lower metal abundances than those formed more recently, although we again note the lack of an obvious [Fe/H] versus age relationship. Discerning how such an extraordinary cluster fits into the chemical evolution of the Galaxy could supply insight into a variety of topics. Indeed, this unique cluster has recently received increased attention, including studies focused on comprehensive BVRIJHK photometry and proper motion (Montalto et al. 2009), photometric variability (de Marchi et al. 2010), and a search for planetary transits (Montalto 2010). This paper is the third installment in our series of high-resolution spectroscopic studies of dwarfs in this extraordinary super-metal-rich OC. In Anthony-Twarog et al. (2010, hereafter AT10) we presented Fe and other non-Li abundances derived from the 6708 Å Li region. In Cummings et al. (2012) we presented the Li abundances themselves. And in the present work, we have derived abundances from the 7774 Å O triplet region, and have examined the cluster in the context of the apparent O versus age and [O/Fe] versus [Fe/H] relationships in the Galaxy. This paper is organized as follows: Section 2 describes our data, reductions, radial velocities (RVs) and membership determinations; Section 3 describes our abundance analysis; Section 4 compares our results to the literature and to the super-metal-rich clusters NGC 6791 and NGC 6583, including discussion of possible options for the chemical evolution of oxygen and the origin of all three clusters; and Section 5 summarizes our conclusions.
2. DATA
2.1. Observations and Reductions
Spectra of the 7774 Å O i triplet region of 47 stars in the field of NGC 6253 were acquired 2007 May 24, using the Hydra II multi-object spectrograph on the CTIO7
Blanco 4 m telescope. These spectra cover the range 7685–7950 Å, at a dispersion of 0.16 Å per pixel, and a resolution of 0.56 Å (i.e.,  at 7774 Å). In addition to the O i triplet, this region includes the 7835 Å Al i doublet, 5 Si i lines, 9 Fe i lines, and 6 Ni i lines that were selected from the Moore et al. (1966) solar atlas and visually cross-checked using the Delbouille et al. (1989) photometric solar atlas. We required that the lines were relatively isolated at the resolution of our data, and that they subsequently yielded abundances in reasonable agreement with the other lines of their respective species. The fiber configuration was the same as that used for the 6708 Å Li region observations made during the same observing run (AT10; Cummings et al. 2012). The configuration consisted mostly of stars at the main sequence turnoff (MSTO), and included 44 sky fibers for background subtraction. The stars observed were chosen based on the intermediate-band photometry and intermediate-to-broadband mapping of Twarog et al. (2003), primarily through the stars' locations in the color–magnitude diagram (CMD), as described in AT10. A total of 9 hr of integration were obtained in this configuration. All calibration spectra were taken in the same fiber configuration used for the objects. Spectra of two RV standards, HR 4540 and HR 8551, were also obtained.
Data reduction followed standard IRAF8
techniques, as described in AT10 and Maderak et al. (2013). The Laplacian Cosmic Ray removal routine of van Dokkum (2001) was employed. Flat-fielding and aperture tracing used well exposed dome flats, as opposed to the available quartz flats, to maintain consistency with the methods employed in our other works. No ThAr comparison spectra were available due to a contaminated ThAr lamp. The solar sky spectrum was used for the initial wavelength solution, which was then propagated to the etalon comparison spectra taken throughout the night. The etalon spectra were used to apply wavelength solutions to the object spectra. The solar sky spectrum was again used to evaluate the relative efficiencies of the fibers, to facilitate an accurate sky subtraction. Nine 1 hr cluster exposures were co-added to create the master object spectra, which were then continuum-fitted using a low-order polynomial spline; these spectra were subsequently used for direct EW measurements. Examples of our continuum-fitted, co-added master spectra of the Sun and a selection of NGC 6253 stars are shown in Figure 1. The signal-to-noise ratio (S/N) per pixel of our processed (and co-added) object spectra, as measured near the oxygen triplet, are given in Table 1; the median S/N of our spectra is ∼80. All apertures of a single solar sky exposure were co-added to create a master solar spectrum, with  per pixel (near the oxygen triplet), which was then used in deriving solar log gf values. EWs were measured using the IRAF routine splot.
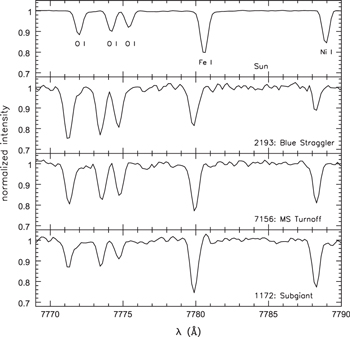
Figure 1. Examples of continuum-fitted co-added spectra.
Download figure:
Standard image High-resolution imageTable 1. Radial Velocities
| Star IDa | WEBDA ID | vrad | σμ | n | 3σ RV Memb. | P(μ)b | Memb. | S/Nc |
|---|---|---|---|---|---|---|---|---|
| (km s−1) | (lines) | per pixel | ||||||
| 179 | 3168 | −12.46 | 0.37 | 23 | nm | 98 | vr var. | 95 |
| 210 | 2561 | −30.03 | 0.58 | 32 | m | ⋯ | M | 95 |
| 219 | 2193 | −31.71 | 0.41 | 28 | m | ⋯ | M | 145 |
| 224 | 2864 | −32.19 | 0.32 | 32 | m | 92 | M | 120 |
| 236 | 7156 | −28.11 | 0.42 | 31 | m | ⋯ | M | 120 |
| 250 | 2131 | −34.08 | 0.35 | 31 | m | 92 | M | 125 |
| 251 | 2562 | −28.51 | 0.47 | 32 | m | 97 | M | 105 |
| 264 | 3212 | −4.06 | 0.83 | 11 | nm | ⋯ | NM | 45 |
| 290 | 1172 | −29.78 | 0.33 | 34 | m | 93 | M | 100 |
| 314 | 1704 | −29.19 | 0.38 | 34 | m | 96 | M | 125 |
| 353 | 1311 | −28.83 | 0.42 | 33 | m | 94 | M | 135 |
| 364 | 1888 | −33.83 | 0.41 | 30 | m | 94 | M | 120 |
| 389 | 7255 | −28.77 | 0.47 | 32 | m | 93 | M | 80 |
| 401 | 7267 | −32.22 | 0.42 | 29 | m | ⋯ | M | 115 |
| 426 | 4735 | −27.94 | 0.56 | 28 | m | 94 | M | 110 |
| 436 | 7284 | −27.78 | 0.41 | 30 | m | ⋯ | M | 105 |
| 451 | 7292 | −27.56 | 1.08 | 20 | m | 85 | M | 75 |
| 467 | 7303 | −19.70 | 0.56 | 23 | nm | ⋯ | vr var. | 60 |
| 503 | 7329 | −29.53 | 0.50 | 21 | m | ⋯ | M | 85 |
| 505 | 596 | −28.17 | 0.82 | 19 | m | 94 | M | 65 |
| 565 | 7370 | −28.95 | 0.52 | 30 | m | 85 | M | 90 |
| 575 | 7377 | −28.69 | 0.48 | 22 | m | ⋯ | M | 60 |
| 594 | 7390 | −30.58 | 0.49 | 26 | m | ⋯ | M | 85 |
| 628 | 3141 | −28.67 | 0.45 | 31 | m | 83 | M | 100 |
| 645 | 7427 | −29.93 | 0.41 | 30 | m | ⋯ | M | 85 |
| 671 | 3643 | −29.93 | 0.68 | 22 | m | 79 | M | 70 |
| 676 | 7448 | −62.80 | 0.58 | 23 | nm | 63 | NM | 60 |
| 709 | 7470 | −33.31 | 0.48 | 23 | m | ⋯ | M | 80 |
| 726 | 4293 | −28.99 | 0.41 | 26 | m | 91 | M | 105 |
| 738 | 7486 | −29.04 | 0.45 | 23 | m | 86 | M | 85 |
| 754 | 7495 | −69.72 | 0.63 | 24 | nm | ⋯ | vr var. | 85 |
| 758 | 1474 | −29.09 | 0.40 | 30 | m | 91 | M | 80 |
| 770 | 7505 | −30.90 | 0.57 | 18 | m | 88 | M | 50 |
| 777 | 7511 | −28.04 | 0.70 | 24 | m | 87 | M | 45 |
| 874 | 7584 | −29.30 | 0.40 | 23 | m | 90 | M | 85 |
| 932 | 7627 | −28.80 | 0.53 | 21 | m | ⋯ | M | 65 |
| 951 | 7638 | −29.16 | 0.63 | 12 | m | 3 | NM | 45 |
| 983 | 7662 | −42.39 | 0.62 | 21 | nm | 30 | NM | 65 |
| 985 | 7664 | −30.35 | 0.41 | 27 | m | 87 | M | 75 |
| 998 | 7672 | 23.50 | 0.53 | 14 | nm | 86 | NM | 45 |
| 1003 | 1691 | −29.20 | 0.39 | 22 | m | 51 | M | 65 |
| 1004 | 7676 | −31.37 | 0.87 | 21 | m | 54 | M | 55 |
| 1027 | 7694 | −24.67 | 0.50 | 27 | m | 77 | M | 65 |
| 1057 | 7718 | −26.40 | 0.51 | 19 | m | ⋯ | M | 70 |
| 1060 | 7720 | 51.02 | 0.80 | 14 | nm | ⋯ | NM | 45 |
| 1175 | 7806 | −30.00 | 0.52 | 29 | m | ⋯ | M | 70 |
| 1204 | 7822 | −30.12 | 0.77 | 9 | m | 80 | M | 20 |
aTwarog et al. (2003). bMontalto et al. (2009). cMeasured near the 7774 Å O i triplet; rounded to the nearest 5.
Download table as: ASCIITypeset image
2.2. Radial Velocities
RVs for the cluster objects and RV standards were determined directly from  , using as many as 36 spectral lines per star (laboratory wavelengths were taken from the Kurucz Atomic Line Database9
; Kurucz & Bell 1995), and a heliocentric correction was applied using the IRAF routine dopcor. The solar sky spectrum provided an initial wavelength solution, and the RV standards were then used to correct the object spectra onto an absolute scale, as will now be described. We found 7.57 ± 0.24 and 56.61 ± 0.34 km s−1 for HR 4540 and HR 8551, respectively, where the errors are the standard deviation of the mean. Recent CORAVEL studies report 4.1 ± 0.3 km s−1 for HR 4540 (Nordstrom et al. 2004) and 54.16 ± 0.01 km s−1 for HR 8551 (Famaey et al. 2005). The mean offset of our initial RV scale was therefore 2.96 km s−1, but with a deviation of ±0.51 km s−1, substantially larger than our errors or those of CORAVEL values. The Sixth Catalog of Fundamental Stars gives 4.4 km s−1 for HR 4540 (Wielen et al. 1999) and 53.8 km s−1 for HR 8551 (Wielen et al. 1999), with no errors reported. These values yielded a mean offset of 2.99 km s−1 for our RVs, with the deviation of ±0.18 km s−1 being within our errors, but without an indication of the internal consistency of their values. While the two offsets were nearly identical, our concern was the characterization of the error. Thus, we adopted 2.98 ± 0.35 km s−1 (where the error is simply the average of the deviations) as the correction used to place our object RVs onto an absolute scale.
, using as many as 36 spectral lines per star (laboratory wavelengths were taken from the Kurucz Atomic Line Database9
; Kurucz & Bell 1995), and a heliocentric correction was applied using the IRAF routine dopcor. The solar sky spectrum provided an initial wavelength solution, and the RV standards were then used to correct the object spectra onto an absolute scale, as will now be described. We found 7.57 ± 0.24 and 56.61 ± 0.34 km s−1 for HR 4540 and HR 8551, respectively, where the errors are the standard deviation of the mean. Recent CORAVEL studies report 4.1 ± 0.3 km s−1 for HR 4540 (Nordstrom et al. 2004) and 54.16 ± 0.01 km s−1 for HR 8551 (Famaey et al. 2005). The mean offset of our initial RV scale was therefore 2.96 km s−1, but with a deviation of ±0.51 km s−1, substantially larger than our errors or those of CORAVEL values. The Sixth Catalog of Fundamental Stars gives 4.4 km s−1 for HR 4540 (Wielen et al. 1999) and 53.8 km s−1 for HR 8551 (Wielen et al. 1999), with no errors reported. These values yielded a mean offset of 2.99 km s−1 for our RVs, with the deviation of ±0.18 km s−1 being within our errors, but without an indication of the internal consistency of their values. While the two offsets were nearly identical, our concern was the characterization of the error. Thus, we adopted 2.98 ± 0.35 km s−1 (where the error is simply the average of the deviations) as the correction used to place our object RVs onto an absolute scale.
We have used the ordinal number from the photometric catalog of Twarog et al. (2003) as the ID system for NGC 6253. In Table 1 we have also listed the IDs adopted by the WEBDA10
database, which was the source of the ID system used in AT10. The WEBDA ID system for NGC 6253 is itself an extension of that from Bragaglia et al. (1997). Table 1 lists our absolute-scale RVs, along with their measurement statistics, and the proper-motion membership probabilities ( ) of Montalto et al. (2009) for the stars common to both studies. Note that an additional systematic error of 0.35 km s−1 applies to our RVs, as discussed above. A histogram of our RV data is presented in Figure 2. The central envelope of the distribution includes 39 stars, but one of these, 951, has
  , and we have designated it as a possible non-member. The remaining 38 have a mean RV of −29.60 km s−1, with a standard deviation (σ) of 1.91 km s−1, and a standard error of the mean (
 ) of 0.31 km s−1. No additional stars are within the
  limits. Our RV membership assignments are given in Table 1. The average is in strikingly good agreement with our value of −29.41 ± 0.16 km s−1 (
 ) from AT10. Our final membership assignments, subject to the condition
  , are given in Table 1, and are ultimately identical to those found in AT10. Stars designated as cluster member RV variables in AT10, based on multi-epoch RV data, are so noted in Table 1. These results, and their striking consistency with those of AT10, can be taken as an independent determination, since the present results were derived from a separate wavelength region using a different method of analysis.

Figure 2. Radial velocity distribution of the stars in Table 1.
Download figure:
Standard image High-resolution imageWe can also compare our cluster average to those from two recent studies of giants in NGC 6253. Carretta et al. (2007, hereafter C07) studied 5 giants, and the RV results for these stars yield an average of −28.26 ± 0.6 km s−1 (as calculated by AT10) when one star with an outlying value of −20.6 km s−1 is excluded. Sestito et al. (2007, hereafter S07) studied 7 giants, which show significant scatter in RV. The four stars with the most similar RVs give an average of −29.71 ± 0.79 km s−1 (as calculated by AT10). While the value of C07 differs by  (where the errors from each value have been combined in quadrature) from our present value, the S07 value is in excellent agreement with ours, and all three results are in fact consistent within the
  limits.
3. ABUNDANCE ANALYSIS
3.1. Methods
Our abundance analysis included 36 of the 38 stars consistent with single-star membership: 30 MS turnoff stars, 5 subgiants, and one blue straggler. The other two members (251, 1204) were omitted because the S/N of their spectra were too low for confident measurements of EWs. We have employed MOOG (Sneden 1973, 2013 version) with the driver abfind to calculate LTE abundances from our measured EWs. We used Kurucz (1979) model atmospheres with the atmospheric parameters determined in AT10. Solar log gf values were derived by requiring our measured solar EWs to yield abundances which matched an adopted set of solar abundances taken from Asplund et al. (2005). For oxygen, we adopt the "traditional," higher value  , noting that we have done so irrespective of the solar oxygen abundance debate, because the precise value adopted is unimportant in a differential analysis. Our adopted solar abundances are given in Table 2.
Table 2. Line List
| Solar | |||||
|---|---|---|---|---|---|
| Species | λ (Å) | EP (eV) | Abund.a | EW (mÅ) | log gf |
| O i | 7771.944 | 9.15 | 8.93 | 70.5 | 0.344 |
| 7774.166 | 9.15 | ⋯ | 61.8 | 0.204 | |
| 7775.388 | 9.15 | ⋯ | 48.1 | −0.054 | |
| Al i | 7835.309 | 4.02 | 6.37 | 50.0 | −0.519 |
| 7836.134 | 4.02 | ⋯ | 66.2 | −0.315 | |
| Si i | 7760.628 | 6.21 | 7.51 | 24.2 | −1.170 |
| 7849.966 | 6.19 | ⋯ | 63.0 | −0.580 | |
| 7918.384 | 5.95 | ⋯ | 92.9 | −0.380 | |
| 7925.852 | 6.22 | ⋯ | 23.2 | −1.180 | |
| 7944.001 | 5.98 | ⋯ | 126.5 | −0.033 | |
| Fe i | 7719.038 | 5.03 | 7.45 | 29.6 | −1.021 |
| 7745.500 | 5.09 | ⋯ | 28.9 | −0.990 | |
| 7746.587 | 5.06 | ⋯ | 17.1 | −1.316 | |
| 7780.552 | 4.47 | ⋯ | 132.5 | 0.079 | |
| 7802.473 | 5.09 | ⋯ | 16.1 | −1.324 | |
| 7807.952 | 4.99 | ⋯ | 61.5 | −0.467 | |
| 7844.555 | 4.84 | ⋯ | 13.0 | −1.680 | |
| 7937.131 | 4.31 | ⋯ | 165.4 | 0.232 | |
| 7941.094 | 3.27 | ⋯ | 43.0 | −2.470 | |
| Fe ii | 7711.723 | 3.90 | ⋯ | 49.8 | −2.453 |
| Ni i | 7714.314 | 1.94 | 6.23 | 118.2 | −1.490 |
| 7715.583 | 3.70 | ⋯ | 69.7 | −0.598 | |
| 7727.613 | 3.68 | ⋯ | 92.5 | −0.220 | |
| 7788.936 | 1.95 | ⋯ | 91.7 | −1.930 | |
| 7797.586 | 3.90 | ⋯ | 80.7 | −0.222 | |
| 7826.766 | 3.70 | ⋯ | 13.4 | −1.826 | |
aAdopted from Asplund et al. (2005), except for the case of O, as noted in the text.
Download table as: ASCIITypeset image
Table 2 shows our line list and includes our measured solar EW (typical measurement errors are  mÅ), and our derived log gf values. The excitation potentials (EP) for each line are also given. The errors in our EW measurements were calculated using the Deliyannis et al. (1993) implementation of the ideas presented in Cayrel (1988), which takes into account the spectral dispersion, the FWHM of the line, and the measured
  local to the line. For our cluster stars, lines with
  were not considered sufficiently reliable and have not been reported, and lines with obvious irregularities have similarly not been reported. Our EW data are given in Table 3 for O i, Al i, and Si i, and in Table 4 for Fe i, Fe ii, and Ni i. Table 5 presents our average elemental abundances ([X/H]) for each star, along with atmospheric parameters. The abundance averages and errors were calculated in linear space, then transformed to logarithmic space, and the reported errors in the logarithmic values correspond to the linear-space
  values.
Table 3. Equivalent Width Data: O, Al, and Si
| O i | Al i | Si i | ||||||||
|---|---|---|---|---|---|---|---|---|---|---|
| ID | 7772 | 7774 | 7775 | 7835 | 7836 | 7761 | 7850 | 7918 | 7926 | 7944 |
| 451 | 119.6 | 116.1 | 81.1 | 80.1 | 107.9 | 53.8 | 102.2 | 109.9 | ⋯ | ⋯ |
| 1027 | 84.0 | 71.2 | 53.9 | 85.7 | 78.8 | ⋯ | ⋯ | ⋯ | 98.3 | 173.2 |
| 874 | 94.5 | ⋯ | 80.1 | 66.9 | 91.0 | ⋯ | 94.2 | 89.7 | ⋯ | 125.9 |
| 426 | 98.7 | 95.1 | 89.3 | 82.5 | 87.6 | 57.7 | 76.8 | 93.0 | ⋯ | 157.6 |
| 726 | 110.0 | ⋯ | 67.6 | 80.5 | 121.8 | 48.9 | 88.9 | 124.0 | ⋯ | 158.8 |
| 594 | 97.2 | 96.4 | 65.1 | 61.2 | 87.5 | ⋯ | 81.7 | 110.4 | ⋯ | 139.3 |
| 932 | 121.3 | ⋯ | 74.9 | ⋯ | 125.8 | ⋯ | 106.4 | ⋯ | ⋯ | 150.8 |
| 503 | 128.4 | 102.4 | 70.7 | 75.8 | 90.3 | ⋯ | 94.7 | 106.4 | ⋯ | 117.1 |
| 671 | 119.3 | 116.4 | 87.9 | ⋯ | ⋯ | ⋯ | 84.0 | 89.8 | ⋯ | 173.1 |
| 436 | 111.6 | 96.6 | 78.1 | ⋯ | 90.1 | 38.3 | 81.9 | 105.5 | ⋯ | 135.1 |
| 236 | 127.8 | 116.3 | 98.7 | 70.2 | 85.9 | 46.4 | 106.1 | 129.3 | ⋯ | 155.2 |
| 628 | 119.8 | ⋯ | 81.2 | ⋯ | 89.4 | ⋯ | 111.7 | 133.7 | 41.4 | 164.8 |
| 224 | 96.4 | 80.8 | 66.1 | 104.5 | 105.6 | 32.7 | 91.8 | 141.7 | ⋯ | 170.3 |
| 219 | 178.4 | 157.3 | 133.9 | ⋯ | 62.2 | 34.9 | 71.2 | 106.6 | 32.4 | 125.6 |
| 250 | 123.9 | 111.4 | 95.7 | 74.3 | 103.1 | 38.9 | 86.1 | 128.0 | ⋯ | 144.0 |
| 364 | 94.1 | 91.6 | 79.9 | 62.8 | 108.6 | 41.1 | 91.1 | 113.6 | ⋯ | 151.7 |
| 314 | 73.0 | 70.7 | 51.3 | 85.4 | 107.1 | 40.6 | 95.3 | 137.5 | ⋯ | 180.7 |
| 1003 | 75.1 | 65.5 | ⋯ | 76.7 | 99.9 | ⋯ | 102.8 | 135.9 | ⋯ | ⋯ |
| 565 | 112.7 | ⋯ | 85.2 | 77.3 | 105.4 | 33.2 | 113.0 | 107.0 | ⋯ | 160.3 |
| 758 | 116.4 | 111.1 | 81.7 | 59.9 | 80.4 | 39.7 | 89.3 | 113.9 | ⋯ | 163.3 |
| 709 | 120.6 | ⋯ | 88.6 | 62.4 | 84.0 | ⋯ | 98.5 | 111.7 | ⋯ | 155.5 |
| 353 | 53.0 | ⋯ | 36.0 | 88.4 | 126.4 | 32.3 | 85.6 | 144.1 | ⋯ | 174.8 |
| 290 | 77.8 | 69.6 | 54.0 | 84.1 | 102.7 | 32.1 | 93.8 | 137.4 | ⋯ | 157.8 |
| 401 | 108.7 | ⋯ | 99.6 | 69.1 | 90.6 | 43.2 | 88.7 | 92.1 | ⋯ | 135.9 |
| 645 | 119.8 | 115.9 | 90.7 | 68.2 | 88.5 | 35.1 | 65.2 | 110.0 | ⋯ | 150.5 |
| 505 | 91.3 | ⋯ | 84.5 | ⋯ | ⋯ | 48.3 | 81.2 | 99.0 | ⋯ | ⋯ |
| 985 | 101.1 | ⋯ | 63.0 | 78.5 | 104.9 | ⋯ | 124.5 | 152.3 | 47.6 | 160.1 |
| 389 | 91.6 | 86.7 | 85.0 | ⋯ | 101.9 | ⋯ | 98.2 | 126.5 | ⋯ | 173.6 |
| 1057 | 85.2 | ⋯ | 80.5 | 58.3 | 93.2 | ⋯ | ⋯ | 87.2 | ⋯ | 181.6 |
| 777 | ⋯ | 101.0 | 78.1 | 77.4 | 88.7 | ⋯ | 100.7 | 98.1 | 47.3 | 146.6 |
| 770 | 110.3 | 90.9 | 85.5 | 60.5 | ⋯ | ⋯ | 120.8 | 104.0 | ⋯ | 145.5 |
| 738 | 106.9 | 102.0 | 77.2 | 82.6 | 97.4 | ⋯ | 99.3 | 114.3 | 56.2 | 161.3 |
| 575 | 116.5 | 102.5 | 100.9 | ⋯ | 76.1 | ⋯ | 100.9 | 93.6 | ⋯ | 127.5 |
| 210 | ⋯ | 71.5 | 56.3 | 93.0 | 102.6 | 55.1 | ⋯ | 130.9 | ⋯ | 161.4 |
| 1175 | 73.7 | ⋯ | 55.9 | 99.6 | 119.1 | ⋯ | 110.6 | 141.3 | ⋯ | 207.0 |
| 1004 | ⋯ | ⋯ | ⋯ | ⋯ | ⋯ | ⋯ | 125.1 | 109.9 | 44.6 | 159.0 |
Download table as: ASCIITypeset image
Table 4. Equivalent Width Data: Fe and Ni
| Fe i | Fe ii | Ni i | ||||||||||||||
|---|---|---|---|---|---|---|---|---|---|---|---|---|---|---|---|---|
| ID | 7719 | 7746 | 7747 | 7781 | 7802 | 7808 | 7845 | 7937 | 7941 | 7712 | 7714 | 7716 | 7728 | 7789 | 7798 | 7827 |
| 451 | ⋯ | ⋯ | ⋯ | 129.2 | 25.1 | 87.9 | ⋯ | ⋯ | ⋯ | 75.0 | 115.6 | ⋯ | ⋯ | 94.4 | 111.3 | 28.3 |
| 1027 | ⋯ | 35.3 | 32.2 | 177.9 | 42.3 | 86.1 | ⋯ | 158.8 | 40.8 | 68.5 | ⋯ | ⋯ | 137.9 | 88.3 | 117.6 | ⋯ |
| 874 | ⋯ | 29.8 | 26.3 | 170.3 | ⋯ | 85.9 | ⋯ | 184.5 | 48.6 | 60.7 | 175.4 | 103.4 | 133.6 | 100.2 | 119.1 | ⋯ |
| 426 | 47.6 | 38.7 | ⋯ | 140.5 | 30.7 | 62.6 | ⋯ | 165.3 | 60.8 | 63.2 | 137.4 | 90.2 | 106.4 | 109.2 | 94.0 | 22.6 |
| 726 | ⋯ | 29.3 | ⋯ | 156.5 | 30.1 | 72.4 | ⋯ | 157.9 | 39.3 | 62.6 | 158.7 | 98.2 | 100.7 | 110.9 | 113.7 | ⋯ |
| 594 | ⋯ | 41.9 | 43.3 | 146.5 | ⋯ | 67.4 | ⋯ | ⋯ | 37.2 | 82.9 | 121.7 | 93.5 | 103.2 | 102.3 | 85.0 | ⋯ |
| 932 | ⋯ | 39.4 | ⋯ | 145.7 | 30.4 | 93.1 | ⋯ | 165.1 | 66.8 | ⋯ | ⋯ | 111.9 | 136.5 | 105.1 | 127.2 | ⋯ |
| 503 | ⋯ | 46.4 | ⋯ | 142.0 | ⋯ | 62.0 | ⋯ | 154.5 | ⋯ | 87.4 | 147.6 | 89.9 | 117.2 | 94.1 | 90.4 | ⋯ |
| 671 | ⋯ | ⋯ | ⋯ | 143.5 | ⋯ | 69.5 | ⋯ | 140.3 | 35.7 | 53.2 | ⋯ | 83.4 | 103.4 | 100.9 | 109.0 | ⋯ |
| 436 | 26.9 | 26.4 | 21.2 | 148.9 | 27.9 | 64.5 | ⋯ | 151.8 | 49.0 | 74.4 | 143.7 | 83.9 | 101.2 | 105.1 | 100.7 | 18.9 |
| 236 | ⋯ | 32.3 | 37.3 | 148.4 | 29.9 | 89.1 | ⋯ | 147.9 | ⋯ | 84.9 | 168.4 | ⋯ | 109.0 | 108.6 | 108.2 | 19.3 |
| 628 | 65.4 | 32.2 | 146.2 | 27.8 | 82.0 | 27.8 | 173.4 | 37.7 | 59.0 | 147.6 | 79.5 | 123.3 | 107.0 | 79.1 | 22.2 | |
| 224 | 35.9 | 46.5 | 36.3 | 165.6 | 19.4 | 81.9 | ⋯ | 173.6 | 57.3 | 62.6 | 170.5 | 102.0 | 118.4 | 121.7 | 105.4 | 37.6 |
| 219 | ⋯ | 19.1 | 14.3 | 127.1 | ⋯ | 70.3 | 15.9 | 127.4 | 23.3 | 84.5 | 112.3 | ⋯ | 107.3 | ⋯ | 74.3 | ⋯ |
| 250 | 35.4 | 35.0 | 38.7 | 136.2 | 24.8 | 74.3 | ⋯ | 147.3 | 46.7 | 83.7 | 129.7 | 77.0 | 119.3 | 113.3 | 107.5 | 18.7 |
| 364 | ⋯ | 59.3 | 38.0 | 153.2 | 17.4 | 78.9 | ⋯ | 171.4 | 40.4 | 68.4 | 153.2 | 81.2 | 110.0 | 114.1 | 93.6 | 20.2 |
| 314 | 45.0 | 50.4 | 35.6 | 169.5 | 23.2 | 78.0 | 22.8 | 203.8 | 75.5 | 58.6 | 204.9 | 104.4 | 122.6 | 141.0 | 106.8 | 24.6 |
| 1003 | ⋯ | 32.1 | ⋯ | 164.3 | 35.8 | 78.5 | ⋯ | 161.5 | ⋯ | 65.8 | 143.1 | 108.8 | 138.2 | 114.2 | 109.3 | ⋯ |
| 565 | 38.2 | 29.3 | 25.7 | 147.5 | 32.3 | 80.2 | ⋯ | 149.1 | 55.8 | 71.2 | 146.2 | 65.5 | 92.7 | 110.4 | ⋯ | 25.6 |
| 758 | ⋯ | 27.6 | 29.7 | 131.6 | 28.1 | 69.5 | ⋯ | 154.1 | ⋯ | 58.1 | 140.2 | 90.0 | 104.2 | 107.6 | 94.0 | 41.1 |
| 709 | ⋯ | ⋯ | 44.5 | 138.9 | 26.2 | 89.5 | ⋯ | 156.7 | 42.2 | 56.6 | 178.1 | 103.7 | ⋯ | 97.2 | 90.9 | ⋯ |
| 353 | 45.0 | 64.0 | 39.7 | 171.2 | 25.4 | 93.2 | 29.4 | 223.0 | 67.9 | 51.8 | 222.2 | 114.6 | ⋯ | 146.1 | 104.6 | 42.1 |
| 290 | ⋯ | 39.4 | 37.7 | 154.3 | 27.5 | 83.3 | 22.8 | 190.3 | 60.1 | 64.6 | 183.6 | 115.1 | 117.4 | 136.5 | 114.0 | 27.5 |
| 401 | ⋯ | 27.6 | 22.6 | 142.5 | 23.9 | 66.1 | ⋯ | 152.5 | ⋯ | 80.3 | 141.8 | 75.8 | 124.4 | 106.9 | ⋯ | ⋯ |
| 645 | 43.4 | 55.4 | 25.4 | 135.4 | ⋯ | 77.3 | 137.5 | 51.1 | 56.1 | 117.0 | 88.9 | 119.5 | 94.8 | 86.7 | 32.1 | |
| 505 | ⋯ | ⋯ | 35.8 | 106.8 | ⋯ | 92.0 | ⋯ | 177.7 | ⋯ | ⋯ | 109.1 | ⋯ | 97.8 | 112.5 | ⋯ | 32.9 |
| 985 | ⋯ | ⋯ | 31.4 | 187.3 | ⋯ | 98.6 | ⋯ | 155.5 | 62.8 | 78.8 | 155.2 | 104.8 | 95.3 | 118.2 | 86.4 | 22.1 |
| 389 | ⋯ | 31.6 | 28.1 | 150.1 | 20.1 | 69.5 | 27.7 | 164.2 | 56.6 | 76.0 | 166.5 | 100.4 | 121.2 | 113.0 | 105.8 | 22.9 |
| 1057 | 63.3 | ⋯ | ⋯ | 213.2 | 31.9 | 71.7 | ⋯ | 149.2 | ⋯ | 46.3 | 174.1 | 111.0 | ⋯ | 113.5 | 108.0 | ⋯ |
| 777 | ⋯ | 52.0 | 31.0 | 162.6 | 34.1 | ⋯ | ⋯ | 196.1 | ⋯ | ⋯ | ⋯ | 131.7 | 129.9 | 93.4 | ⋯ | |
| 770 | ⋯ | ⋯ | ⋯ | 171.1 | ⋯ | 73.4 | ⋯ | 150.3 | 58.7 | 56.2 | ⋯ | 111.7 | 103.9 | 107.0 | 107.6 | ⋯ |
| 738 | ⋯ | 27.7 | 30.8 | 147.6 | ⋯ | 63.0 | ⋯ | 185.4 | 41.6 | 80.3 | 106.8 | ⋯ | 110.2 | 97.5 | 100.6 | ⋯ |
| 575 | ⋯ | 43.7 | ⋯ | 128.9 | ⋯ | 96.1 | ⋯ | 136.8 | 41.3 | 63.1 | 119.9 | 80.7 | ⋯ | 114.1 | 115.2 | ⋯ |
| 210 | 43.9 | 64.0 | 26.6 | 142.9 | ⋯ | 83.6 | 23.4 | 169.5 | 48.0 | 62.4 | 189.7 | 90.7 | 121.9 | 136.9 | 105.6 | 28.8 |
| 1175 | ⋯ | 52.4 | 28.1 | 186.8 | 49.0 | 100.0 | 34.8 | 172.9 | 68.3 | 42.0 | 175.0 | 114.9 | 132.4 | 117.9 | 120.2 | 42.9 |
| 1004 | ⋯ | ⋯ | ⋯ | 174.7 | ⋯ | 83.5 | ⋯ | 205.0 | 39.6 | ⋯ | ⋯ | ⋯ | 105.2 | 124.5 | 76.4 | 41.7 |
Download table as: ASCIITypeset image
Table 5. Abundance Averages by Star
| ID | O i | n |

|
Al i | n |

|
Si i | n |

|
Fe i | n |
 ± ± |
Ni i | n |
 ± ± |
Teff | log g | vt |
|---|---|---|---|---|---|---|---|---|---|---|---|---|---|---|---|---|---|---|
| 210 | 0.015 | 2 | 0.015 | 0.587 | 2 |

|
0.554 | 3 |

|
0.360 | 8 |

|
0.652 | 6 |

|
5725 | 3.74 | 1.22 |
| 219 | 0.577 | 3 |

|
0.210 | 1 | ⋯ | 0.294 | 5 |

|
0.241 | 7 |

|
0.324 | 3 |

|
6421 | 3.82 | 1.67 |
| 224 | 0.437 | 3 |

|
0.655 | 2 |

|
0.553 | 4 |

|
0.296 | 8 |

|
0.537 | 6 |

|
5572 | 3.72 | 1.12 |
| 236 | 0.533 | 3 | 0.003 | 0.380 | 2 | 0.000 | 0.521 | 4 |

|
0.413 | 6 |

|
0.540 | 5 |

|
5913 | 3.77 | 1.33 |
| 250 | 0.427 | 3 | 0.009 | 0.531 | 2 |

|
0.413 | 4 |

|
0.326 | 8 |

|
0.453 | 6 |

|
5975 | 3.84 | 1.29 |
| 290 | 0.374 | 3 |

|
0.465 | 2 |

|
0.527 | 4 |

|
0.282 | 8 |

|
0.625 | 6 |

|
5435 | 3.71 | 1.02 |
| 314 | 0.507 | 3 |

|
0.466 | 2 |

|
0.655 | 4 |

|
0.315 | 9 |

|
0.625 | 6 |

|
5323 | 3.70 | 0.95 |
| 353 | 0.230 | 2 | 0.020 | 0.583 | 2 |

|
0.672 | 4 |

|
0.411 | 9 |

|
0.757 | 5 |

|
5218 | 3.70 | 0.86 |
| 364 | 0.302 | 3 |

|
0.490 | 2 |

|
0.405 | 4 |

|
0.435 | 7 |

|
0.468 | 6 |

|
5837 | 3.90 | 1.10 |
| 364 | 0.235 | 3 |

|
0.570 | 1 | ⋯ | 0.585 | 3 |

|
0.354 | 8 |

|
0.670 | 6 |

|
5897 | 3.92 | 1.12 |
| 401 | 0.446 | 2 |

|
0.416 | 2 |

|
0.313 | 4 |

|
0.279 | 6 |

|
0.556 | 4 |

|
5952 | 3.94 | 1.14 |
| 426 | 0.333 | 3 |

|
0.476 | 2 |

|
0.407 | 4 |

|
0.389 | 7 |

|
0.483 | 6 |

|
5910 | 3.97 | 1.07 |
| 436 | 0.366 | 3 |

|
0.430 | 1 | ⋯ | 0.300 | 4 | 0.007 | 0.253 | 8 |

|
0.465 | 6 |

|
5881 | 3.98 | 1.03 |
| 451 | 0.370 | 3 |

|
0.604 | 2 |

|
0.503 | 3 |

|
0.497 | 3 |

|
0.540 | 4 |

|
6038 | 4.03 | 1.09 |
| 503 | 0.533 | 3 |

|
0.430 | 2 | 0.010 | 0.329 | 3 |

|
0.350 | 4 |

|
0.567 | 5 |

|
5859 | 4.07 | 0.90 |
| 505 | 0.239 | 2 |

|
⋯ | ⋯ | ⋯ | 0.345 | 3 |

|
0.527 | 4 |

|
0.513 | 4 |

|
5972 | 4.07 | 0.99 |
| 565 | 0.500 | 2 | 0.000 | 0.534 | 2 |

|
0.473 | 4 |

|
0.381 | 8 |

|
0.508 | 5 |

|
5894 | 4.11 | 0.87 |
| 575 | 0.465 | 3 |

|
0.280 | 1 | ⋯ | 0.341 | 3 |

|
0.475 | 5 |

|
0.678 | 4 |

|
6021 | 4.12 | 0.96 |
| 594 | 0.129 | 3 |

|
0.370 | 2 |

|
0.347 | 3 | 0.012 | 0.499 | 5 |

|
0.545 | 5 |

|
6055 | 4.13 | 0.97 |
| 628 | 0.546 | 2 |

|
0.400 | 1 | ⋯ | 0.566 | 4 |

|
0.524 | 8 |

|
0.583 | 6 |

|
5888 | 4.16 | 0.80 |
| 645 | 0.612 | 3 |

|
0.376 | 2 |

|
0.300 | 4 |

|
0.423 | 7 |

|
0.550 | 6 |

|
5920 | 4.17 | 0.81 |
| 671 | 0.601 | 3 |

|
⋯ | ⋯ | ⋯ | 0.398 | 3 |

|
0.284 | 4 |

|
0.599 | 4 |

|
5926 | 4.18 | 0.81 |
| 709 | 0.650 | 2 | 0.020 | 0.296 | 2 |

|
0.457 | 3 |

|
0.494 | 6 |

|
0.807 | 4 |

|
5865 | 4.21 | 0.72 |
| 726 | 0.349 | 2 |

|
0.672 | 2 |

|
0.474 | 4 |

|
0.375 | 6 |

|
0.794 | 5 |

|
5933 | 4.21 | 0.77 |
| 738 | 0.299 | 3 |

|
0.550 | 2 | 0.020 | 0.525 | 4 |

|
0.418 | 6 |

|
0.566 | 4 |

|
6061 | 4.22 | 0.86 |
| 758 | 0.612 | 3 |

|
0.256 | 2 |

|
0.422 | 4 |

|
0.320 | 6 |

|
0.668 | 6 |

|
5875 | 4.23 | 0.70 |
| 770 | 0.496 | 3 |

|
0.240 | 1 | ⋯ | 0.566 | 3 |

|
0.495 | 4 |

|
0.791 | 4 |

|
5894 | 4.24 | 0.70 |
| 777 | 0.367 | 2 |

|
0.446 | 2 |

|
0.413 | 4 |

|
0.606 | 5 |

|
0.905 | 3 |

|
5995 | 4.24 | 0.78 |
| 874 | 0.389 | 2 |

|
0.373 | 2 |

|
0.282 | 3 |

|
0.482 | 6 |

|
0.916 | 5 |

|
5910 | 4.27 | 0.68 |
| 932 | 0.529 | 2 |

|
0.840 | 1 | ⋯ | 0.521 | 2 |

|
0.562 | 6 |

|
0.948 | 4 |

|
5913 | 4.28 | 0.67 |
| 985 | 0.408 | 2 |

|
0.487 | 2 |

|
0.697 | 4 |

|
0.618 | 5 |

|
0.691 | 6 |

|
5812 | 4.30 | 0.56 |
| 1003 | 0.055 | 2 | 0.015 | 0.461 | 2 |

|
0.601 | 2 |

|
0.468 | 5 |

|
0.867 | 5 |

|
5849 | 4.31 | 0.58 |
| 1004 | ⋯ | ⋯ | ⋯ | ⋯ | ⋯ | ⋯ | 0.595 | 4 |

|
0.594 | 4 |

|
0.778 | 4 |

|
5972 | 4.31 | 0.67 |
| 1027 | 0.144 | 3 |

|
0.419 | 2 |

|
0.426 | 2 |

|
0.517 | 7 |

|
0.799 | 3 |

|
5856 | 4.31 | 0.58 |
| 1057 | 0.566 | 2 |

|
0.274 | 2 |

|
⋯ | ⋯ | ⋯ | 0.601 | 5 |

|
0.873 | 4 |

|
5725 | 4.32 | 0.46 |
| 1175 | 0.096 | 2 |

|
0.710 | 2 | 0.010 | 0.705 | 3 |

|
0.701 | 8 |

|
0.961 | 6 |

|
5849 | 4.35 | 0.52 |
Download table as: ASCIITypeset image
3.2. Cluster Averages
Our average cluster abundances (discussed below) were computed using all individual line measurements of a given species from all stars, weighted linearly by the inverse of the abundance error for each line. Our averaging and statistical error computation procedures are discussed in detail in Maderak et al. (2013). We stress that our averages were taken in linear space and that an average of logarithmic abundances is systematically lower, although the two do converge when the scatter is small.
As discussed in the Introduction, careful consideration of NLTE effects is needed to identify the regime in which the O triplet yields reliable abundances, i.e., abundances that are suitable for inclusion in the cluster average. For the present case, it was necessary to consider whether it is appropriate to use a differential analysis for triplet abundances in stars of non-solar gravity. Figure 1 of Takeda (2003) demonstrates an increasing NLTE effect for lower gravities, and it suggests, for the gravity range of our turnoff sample, a potential positive systematic error ∼0.05 dex in our differential values, which is small. The figure does indicate that, for these gravities, the NLTE correction is roughly constant between 5500 K and 6000 K, as is the case for near-solar gravities. The top panel of Figure 3 shows the average [O/H] versus Teff for each star, where the error bars represent  . A linear least-squares fit to the [O/H] versus Teff data for the turnoff stars between 5700 and 6100 K yields a slope that is consistent with zero. As discussed in the Introduction, for solar-gravity dwarfs we would expect increasing LTE abundances for
  K due to non-LTE effects. The one and only star in this Teff range, 219, is a blue straggler at 6421 K with gravity very similar to the turnoff stars, and triplet EWs ∼150 mÅ. For this case, Figure 1 of Takeda (2003) predicts an NLTE increase of ∼0.15 dex above the turnoff stars, and [O/H] for this star is almost exactly 0.15 dex above the turnoff average. While this value is within the scatter of the turnoff abundances, it is also consistent with the expected NLTE effects.

Figure 3. [O/H] and [Fe/H] vs. Teff for the stars in Table 3. The dashed lines indicate the cluster average, and the dotted lines indicate the standard deviation of the mean ( ).
).
Download figure:
Standard image High-resolution imageAs also discussed in the Introduction, solar-gravity dwarfs have been found to exhibit increasing abundances for  K, possibly due to chromospheric and spot effects (see the discussion and references in Maderak et al. 2013). In the present case, the stars in this Teff range are subgiants, and with temperature-gravity combinations such that Figure 1 of Takeda (2003) predicts a negligible NLTE offset relative to the turnoff stars. Thus, we should see any overabundances due to atmospheric or other effects. The lack of any obvious overabundance trend in Figure 3 for
  K therefore indicates either: (1) that our sample does not go cool enough to reveal such a trend; or (2) that whatever phenomenon causes the perceived increase in cool dwarfs (e.g., chromospheric activity) simply does not occur in these subgiants.
We have used Takeda (2003) as a specific reference for the behavior of the NLTE corrections. However, it should be noted that while Figure 4 of Takeda (2003) shows that the general behavior of the NLTE corrections from several authors is similar, the particular values do not completely agree. Thus, while the calculations are useful in gauging the relative error of working with stars of non-solar gravity and temperature (as nicely demonstrated for the specific case of 219, discussed above), a differential analysis with respect to the Sun is expected to be more reliable than applying the NLTE corrections calculated by any particular study.
The purpose of the above considerations, in addition to establishing the validity of our analysis for the turnoff stars in our sample, is to identify the maximum sample suitable for inclusion in our cluster average. While including the subgiants below 5600 K does not affect the average, it is not yet understood whether or not the phenomenon causing the overabundance trend observed for dwarfs in the same Teff range affects subgiants as well. Given this uncertainty, and in order to establish as much consistency as possible with our other works, we have omitted the subgiants from the [O/H] cluster average. Including only the turnoff stars, we report our average in Table 6 (where the errors are  ).
).
Table 6. Cluster Averages
| Δ[X/H] | ||||||||||
|---|---|---|---|---|---|---|---|---|---|---|
| Species | [X/H] | n |
 ± ± |
[X/Fe] |
 ± ± |
Avg of Logs |

|

|

|

|
| lines | δ = +0.04 | δ = +100 | δ = +0.3 | δ = −0.3 | ||||||
| O i | 0.440 | 74 |

|
−0.005 |

|
0.391 | +0.119 | −0.112 | +0.056 | +0.023 |
| Al i | 0.487 | 59 |

|
0.042 |

|
0.462 | −0.039 | +0.034 | −0.069 | +0.041 |
| Si i | 0.504 | 123 |

|
0.059 |

|
0.447 | −0.018 | +0.003 | −0.061 | +0.044 |
| Fe i | 0.445 | 226 |

|
⋯ | ⋯ | 0.386 | −0.090 | +0.052 | −0.052 | +0.067 |
| Fe ii | 0.426 | 32 |

|
−0.019 | ⋯ | 0.389 | ⋯ | ⋯ | ⋯ | ⋯ |
| Ni i | 0.702 | 177 |

|
0.257 |

|
0.611 | −0.113 | +0.066 | −0.043 | +0.118 |
Download table as: ASCIITypeset image
The analyses of Fe, Al, Si, and Ni are presumed to be free from significant complications, such as those considered above for O. The average [Fe/H] versus Teff for each star is plotted in the bottom panel of Figure 3, and analogous plots for Al, Si, and Ni are presented in Figure 4. We have included all stars in the cluster averages for these four species and report the results for all species in Table 4. The errors for each [X/Fe] are simply the logarithmic  from both species added in quadrature (we note that logarithmic errors are simply percentage errors, and so it is mathematically valid to add them directly). We have also included in Table 6 the average of the logarithmic abundances, to allow direct comparison with studies which calculate average abundances in that way. As expected, these are always lower, mostly by 0.03–0.05 dex, though the full range is 0.025–0.091 dex. Table 6 shows the cluster [Fe/H] average as derived from Fe i lines and separately from the Fe ii line. We are suspicious of the continuum placement near the one and only available Fe ii line (at 7712 Å) due to surrounding strong lines. This line could in principle provide a useful check on our gravities, but we question the accuracy of doing so star-by-star. Instead we note that the average Fe ii abundance differs from that of Fe i by a mere 0.02 dex, which is well within the errors and suggests no significant systematic error due to errors in gravities.
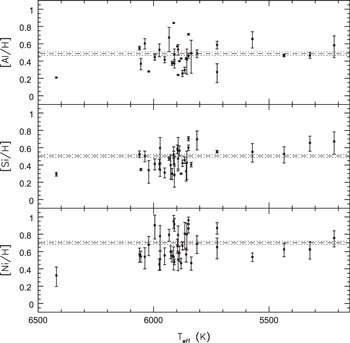
Figure 4. [Al/H], [Si/H], and [Ni/H] vs. Teff for the stars in Table 3. The dashed lines indicate the cluster average, and the dotted lines indicate  .
.
Download figure:
Standard image High-resolution imageThe primary source of possible systematic error in our cluster averages is a systematic error in the  values of the stars in our sample, the most tractable cause of which would be the error in cluster reddening. Such a systematic error in
  would translate into a shift in our Teff scale. Furthermore, because our procedure for determining
  and vt is dependent on Teff (see AT10 and Maderak et al. 2013, for details), an error in Teff leads to errors in those parameters as well. We have evaluated the systematic error due to these dependent errors in atmospheric parameters by adding 0.04, the uncertainty in the cluster reddening (AT10), to the
  of all stars, then re-deriving our cluster averages according to the procedure previously described. The resulting error is presented in Table 6. To demonstrate the sensitivity of our abundances to possible independent errors in the atmospheric parameters used, we have evaluated the effects of changing Teff,
  , and vt by +100 K, +0.3 dex, and −0.3 km s−1, respectively. Each parameter was changed separately for all stars and the modified cluster averages re-derived. Table 6 shows the results. We have not performed this evaluation for Fe ii, given the questionable accuracy of the available line, as noted above. Note that the sensitivity of O to Teff is not surprising, given the high EP (9 eV) of the triplet lines.
4. DISCUSSION
4.1. Comparisons with Other Work; Abundance Patterns
The reported abundance ratios of Fe, O, Si, Ni, and Al from the three previous studies of NGC 6253 are summarized in Table 7. AT10 reported average abundances of ![$[{\rm Fe}/{\rm H}]\;=+0.43\pm 0.01$](https://content.cld.iop.org/journals/1538-3881/149/4/141/revision1/aj510411ieqn219.gif) ,
, ![$[{\rm Si}/{\rm H}]=+0.43_{-0.04}^{+0.03}$](https://content.cld.iop.org/journals/1538-3881/149/4/141/revision1/aj510411ieqn220.gif) , and
, and ![$[{\rm Ni}/{\rm H}]\;=+0.53\pm 0.02$](https://content.cld.iop.org/journals/1538-3881/149/4/141/revision1/aj510411ieqn221.gif) for the same sample of turnoff members analyzed in the present study (using the wavelength region containing the 6708 Å Li i line). In addition, the AT10 giants give [Fe/H] =
for the same sample of turnoff members analyzed in the present study (using the wavelength region containing the 6708 Å Li i line). In addition, the AT10 giants give [Fe/H] =  . Our present values of [Fe/H] = +0.445 ± 0.014 and [Si/H] = +0.50 ± 0.02 are in excellent agreement with AT10. However, our present value of [Ni/H] = +0.702 ± 0.018 is 0.16 dex higher than that of AT10. This difference is difficult to explain, but not excessive in the context of study-to-study differences (see below). It is also possible that there may be issues with using one or more of the Ni i lines in the 7774 Å region to determine Ni abundances.
Table 7. Comparison of NGC 6253, 6791, and 6583 Abundances
| Cluster | [Fe/H] | [O/Fe] | [Si/Fe] | [Ni/Fe] | [Al/Fe] | Stars | Typea |
|---|---|---|---|---|---|---|---|
| NGC 6253 | |||||||
| Present | 0.445 ± 0.014 | −0.005 ± 0.024 | 0.059 ± 0.023 | 0.257 ± 0.023 | 0.042 ± 0.024 | 36 | MSTO |
| Anthony-Twarog et al. (2010) | 0.43 ± 0.01 | ⋯ | 0.00 ± 0.04 | 0.10 ± 0.02 | ⋯ | 38 | MSTO |
| Carretta et al. (2007) | 0.46 ± 0.03 | −0.18 ± 0.06 | 0.09 ± 0.06 | −0.05 ± 0.00 | −0.08 ± 0.12 | 4 | RC |
| Sestito et al. (2007) | 0.39 ± 0.08 | ⋯ | 0.02 ± 0.08 | 0.08 ± 0.07 | ⋯ | 5 | SGB/RGB |
| NGC 6791 | |||||||
| Peterson & Green (1998) | 0.4 ± 0.1 | 0.0 | 0.2 ± 0.1 | 0.0 ± 0.1 | 0.0 ± 0.2 | 1 | BHB |
| Worthey & Jowett (2003) | 0.320 ± 0.023 | ⋯ | ⋯ | ⋯ | ⋯ | 16 | RGB |
| Carraro et al. (2006) | 0.39 ± 0.01 | ⋯ | 0.02 ± 0.03 | −0.01 ± 0.03 | −0.15 ± 0.03 | 10 | RGB |
| Origlia et al. (2006) | 0.35 ± 0.02 | −0.07 ± 0.03 | 0.02 ± 0.05 | ⋯ | 0.05 ± 0.02 | 6 | RGB |
| Carretta et al. (2007) | 0.47 ± 0.07 | −0.31 ± 0.08 | −0.01 ± 0.10 | −0.07 ± 0.07 | −0.21 ± 0.09 | 4 | RC |
| Boesgaard et al. (2009) | 0.30 ± 0.08 | ⋯ | 0.11 ± 0.03 | 0.17 ± 0.06 | ⋯ | 2 | MSTO |
| Geisler et al. (2012) | 0.42 ± 0.01 | 0.08 ± 0.02b | ⋯ | ⋯ | ⋯ | 21 | RBG/AGB |
| Bragaglia et al. (2014) | 0.33 ± 0.02 | −0.10 ± 0.03c | ⋯ | 0.12 ± 0.02 | ⋯ | 15 | MSTO/SGB |
| Cunha et al. (2015) | 0.34 ± 0.06 | 0.01 ± 0.06 | ⋯ | ⋯ | ⋯ | 11 | RGB |
| Boesgaard et al. (2014) | 0.30 ± 0.04 | −0.06 ± 0.02 | 0.07 ± 0.05 | 0.04 ± 0.02 | ⋯ | 8 | MSTO |
| NGC 6583 | |||||||
| Magrini et al. (2010) | 0.37 ± 0.03 | ⋯ | 0.01 ± 0.05 | 0.06 ± 0.04 | 0.11 ± 0.02 | 2 | RGB |
| Diskd |

|
−0.2 to 0.1 | 0 to 0.25 | −0.05 to 0.2 | −0.05 to 0.2 | ⋯ | ⋯ |
| Bulgee |

|
−0.1 to 0.25 | 0.05 to 0.25 | ⋯ | 0.2 to 0.45 | ⋯ | ⋯ |
aMSTO—main sequence turnoff, RC—red clump, SGB—subgiant branch, RGB—red giant branch, BHB—blue horizontal branch, AGB—asymptotic giant branch. bAs discussed in the text, Geisler et al. (2012) report a range of −0.1–0.25 in [O/Fe]. cAs noted in the text, this is the mean of the stellar values reported by Bragaglia et al. (2014). dBased on C07, except for the case of [O/Fe], which is based on both C07 and R13. eBased on F07.
Download table as: ASCIITypeset image
S07 performed an EW analysis of 5 subgiants and giants in NGC 6253, done differentially with respect to the Sun, and thus similar to our present analysis in that respect. They report ![$[{\rm Fe}/{\rm H}]=+0.39\pm 0.08$](https://content.cld.iop.org/journals/1538-3881/149/4/141/revision1/aj510411ieqn225.gif) ,
, ![$[{\rm Si}/{\rm Fe}]=+0.02\pm 0.08$](https://content.cld.iop.org/journals/1538-3881/149/4/141/revision1/aj510411ieqn226.gif) , and
, and ![$[{\rm Ni}/{\rm Fe}]=+0.08\pm 0.07$](https://content.cld.iop.org/journals/1538-3881/149/4/141/revision1/aj510411ieqn227.gif) (where the errors are rms). Their values of [Fe/H] and [Si/Fe] agree well with ours. The difference of 0.18 dex in [Ni/Fe] between our study and theirs is
(where the errors are rms). Their values of [Fe/H] and [Si/Fe] agree well with ours. The difference of 0.18 dex in [Ni/Fe] between our study and theirs is  (where the errors from each have been combined in quadrature, as will be done for each such comparison hereafter); however, their value is in excellent agreement with the value from AT10. It should be noted that there are significant differences between the S07 analysis and ours, which complicate a direct comparison (see the discussion in AT10). These include the stellar types used (giants versus the turnoff stars used here), and their methods of determining atmospheric parameters. For example, if the giants in AT10 are compared to the same giants in S07 using S07's methods for determining atmospheric parameters, then the [Fe/H] found in AT10 is raised by ∼0.15 dex.
Using spectral synthesis of 4 clump giants, C07 reported ![$[{\rm O}/{\rm Fe}]=-0.18\pm 0.06$](https://content.cld.iop.org/journals/1538-3881/149/4/141/revision1/aj510411ieqn229.gif) ,
, ![$[{\rm Fe}/{\rm H}]=+0.46\pm 0.03$](https://content.cld.iop.org/journals/1538-3881/149/4/141/revision1/aj510411ieqn230.gif) ,
, ![$[{\rm Al}/{\rm Fe}]\;=-0.08\pm 0.12$](https://content.cld.iop.org/journals/1538-3881/149/4/141/revision1/aj510411ieqn231.gif) ,
, ![$[{\rm Si}/{\rm Fe}]=+0.09\pm 0.06$](https://content.cld.iop.org/journals/1538-3881/149/4/141/revision1/aj510411ieqn232.gif) , and
, and ![$[{\rm Ni}/{\rm Fe}]\;=-0.05\pm 0.00$](https://content.cld.iop.org/journals/1538-3881/149/4/141/revision1/aj510411ieqn233.gif) (where the errors are rms). Their values for [Fe/H] and [Si/Fe] are in excellent agreement with our results, and their value of [Al/Fe] is consistent within the errors. In contrast, their [O/Fe] is over 2.5σ different from ours, and their [Ni/Fe] differs by even more than that. However, the same issues that complicate a comparison with S07 are again present in this case. AT10 reports [Fe/H] for three of the four giants used by C07, and adjustment of the AT10 values in accordance with the atmospheric parameter prescriptions of C07 would raise the AT10 [Fe/H] average for these three stars by ∼0.15 dex (see AT10 for a detailed discussion). For O, C07 use the forbidden 6300 Å line with careful consideration of the Ni i blend. However, if one compares their value with the average of our logarithmic abundances and allows for a possible systematic error of 0.05 dex in our value (see the discussion in Section 3.2) the difference is ≲0.1 dex,
(where the errors are rms). Their values for [Fe/H] and [Si/Fe] are in excellent agreement with our results, and their value of [Al/Fe] is consistent within the errors. In contrast, their [O/Fe] is over 2.5σ different from ours, and their [Ni/Fe] differs by even more than that. However, the same issues that complicate a comparison with S07 are again present in this case. AT10 reports [Fe/H] for three of the four giants used by C07, and adjustment of the AT10 values in accordance with the atmospheric parameter prescriptions of C07 would raise the AT10 [Fe/H] average for these three stars by ∼0.15 dex (see AT10 for a detailed discussion). For O, C07 use the forbidden 6300 Å line with careful consideration of the Ni i blend. However, if one compares their value with the average of our logarithmic abundances and allows for a possible systematic error of 0.05 dex in our value (see the discussion in Section 3.2) the difference is ≲0.1 dex,  in [O/H] (theirs being lower than ours). On the other hand, the difference would be worsened if they used a higher [Ni/Fe] such as our present value (which is 0.3 dex higher than theirs), thereby lowering their derived [O/H].
Could the lower O abundance reported by C07 be evidence of evolutionary effects in these NGC 6253 giants? To address this possibility, we have examined a sequence of stellar evolutionary models for a  star of the appropriate metallicity, generated by the Clemson-Beirut stellar evolution code (The et al. 2000). These models were evolved up to the beginning of core He burning, using "standard" assumptions (see the Introduction). The surface abundance of 16O is completely unchanged by the evolution of the model. Thus, these standard models do not account for the dwarf-giant discrepancy seen here; to our knowledge, there are no stellar evolution models that do predict changes in surface O abundance on the RGB. However, as noted in the Introduction, non-standard mechanisms have not been ruled out. Whatever the true source of the discrepancy with C07, we stress our larger sample statistics and reiterate that unevolved stars are in principle more reliable, though it is quite possible that the oxygen abundances of the C07 giants have not been affected by any evolutionary effects.
In summary, the full range of [Fe/H] values from the four high-resolution studies of NGC 6253 is only +0.39 to +0.46. Of these, the two studies of giants give +0.39 ± 0.08, +0.46 ± 0.03, and the two studies of dwarfs (from AT10 and the present study) give +0.43 ± 0.01 and +0.445 ± 0.014. The remarkable similarity between these results is both striking and nearly unique. Only studies of the Hyades have yielded results as remarkably consistent as these, and the full range of high-quality metallicities for the Hyades is actually greater (Maderak et al. 2013, C. P. Deliyannis et al. 2015, in preparation). The cluster's oxygen abundance is roughly scaled-solar, though C07's slightly sub-scaled-solar [O/Fe] value is consistent with those of the disk dwarfs and giants compiled in C07 (see their Figure 6). The cluster's Si and Al abundances are also roughly scaled-solar, and are consistent with those of the dwarfs and giants compiled in C07. Our super-scaled-solar Ni abundance is discrepant with those of previous studies, including AT10, which show scaled-solar values. But interestingly, the dwarfs and giants compiled in C07 show some evidence of trending toward super-scaled-solar values with increasing metallicity, though not to quite as high as our present value. We note, however, that comparisons to the compiled field star data in C07 are subject to the caveat that relatively few of those stars have [Fe/H]  .
.
Both the C07 and S07 studies also derived abundances of several other elements, though not the same set, including light elements, α-elements, the s-process element Ba, and the r-process element Eu. The majority of the elemental abundances reported by C07 and S07 are scaled-solar. However, C07 report a cluster average of [Na/Fe] = +0.21 ± 0.02, while the average [Na/Fe] value of the five stars analyzed by S07 is +0.20 ± 0.04, based on a LTE analysis, and +0.07 ± 0.04, based on a NLTE analysis (where the errors on the S07 values are  ). Also, though C07 reports a cluster average of
 ![$[{\rm Mg}/{\rm Fe}]=+0.01\pm 0.03$](https://content.cld.iop.org/journals/1538-3881/149/4/141/revision1/aj510411ieqn238.gif) , the average [Mg/Fe] of the 5 stars in S07 is +0.30 ± 0.07 (again, the error in the S07 value is
, the average [Mg/Fe] of the 5 stars in S07 is +0.30 ± 0.07 (again, the error in the S07 value is  ). If [Na/Fe] and [Mg/Fe] are truly are super-scaled-solar in NGC 6253, this would be similar to the bulge giants of Fulbright et al. (2007, hereafter F07), which range from
  to
to  in both [Na/Fe] and [Mg/Fe] for [Fe/H]
  , in contrast to the disk-like abundance patterns of the other species.
The consistency between our present Al abundance for turnoff stars and the C07 Al abundance for NGC 6253 giants stands in contrast with a reported Al enhancement in Hyades giants over Hyades dwarfs (Schuler et al. 2009), a result which may reflect an apparently general trend of Al enhancement in OC giants (Jacobson et al. 2007). However, standard stellar evolution models for the Hyades predict no change in Al for giants versus dwarfs (Schuler et al. 2009)note that they used the Clemson-Beirut code, from which we have cited results above for the case of O). Both Jacobson et al. (2007) and Schuler et al. (2009) attribute at least part of the discrepancy to NLTE effects, which have not been calculated for Al in giants of super-solar metallicity. The possibility of NLTE effects seems at first a reasonable solution to the problem, until one considers that we have used the Al doublet at 7835 and 7836 Å while C07 used the Al doublet at 6696 and 6698 Å but Jacobson et al. (2007) also used the 6696/98 Å doublet, and Schuler et al. (2009) used both doublets, which in that case gave consistent results for both dwarfs and the giants. This inconsistent behavior of the two doublets worsens the conundrum. A direct comparison is of course further complicated by the fact that if the problem is not well-understood for Hyades metallicity, then it may be even less-well understood for the super-metal-rich regime of NGC 6253. At present we can only reiterate the need, as noted by Schuler et al. (2009), for the appropriate NLTE calculations, which may shed light on this convoluted situation.
4.2. Elemental Abundance Comparisons Between NGC 6253, NGC 6791, NGC 6583, Disk Stars, and Bulge Stars
Three super-metal-rich OCs are known: NGC 6253, NGC 6791, and NGC 6583. These clusters span a large range of ages, from ∼1 Gyr (NGC 6583) to ∼3 Gyr (NGC 6253) to ∼8 Gyr (NGC 6791). Whereas NGC 6791's super-metal-richness has been known for well over a decade (see Peterson & Green 1998, for the first high-resolution spectroscopic study), and NGC 6253's has been suspected for well over a decade (Bragaglia et al. 1997, from photometry), NGC 6583 has joined this distinctive group only recently, based on the high-resolution spectroscopic study of two of its giants (Magrini et al. 2010). See also the discussion in AT10 about spectroscopic and photometric evidence for the super-high metallicity of the first two clusters. Some bulge stars reach iron abundances as high as these three clusters (e.g., F07), but such high iron in local disk stars is rather rare. In trying to ascertain the origin of these remarkable clusters, it might be helpful to determine the degree to which the abundance patterns of the three clusters are similar, and/or to identify possible differences.
Table 7 summarizes the abundance ratios of Fe, O, Si, Ni, and Al reported by a number of studies for these three clusters; the number and type of stars used in each study is also included. We have also included representative abundance ranges for the disk and for the bulge for [Fe/H]  , based on the C07 compilation and the results of F07, respectively. We have plotted the O, Al, Si, and Ni abundance data from Table 7 in Figure 5. For NGC 6791, all of the studies listed, except one, used high-resolution spectroscopic data of a variety of objects, including a blue horizontal branch star, red clump stars, red giants, and turnoff stars. The consensus is that [Fe/H] is approximately
  , with the full range of published values in Table 7 going from
  to
to  . Although this is a larger range than that for NGC 6253, it is clear that NGC 6791's Fe abundance is robustly high and is similar to that of NGC 6253, if perhaps just slightly lower. The single study of two cluster giants in NGC 6583 provides [Fe/H] = 0.37 ± 0.03 (Magrini et al. 2010) for the cluster, which is consistent with the range defined by NGC 6253 and NGC 6791. Note that Anthony-Twarog et al. (2007) found evidence (from intermediate-band photometry) that NGC 6253 might be of order 0.1 dex more metal-rich than NGC 6791, giving rise to the possible distinction that NGC 6253 is the most metal-rich star cluster known.
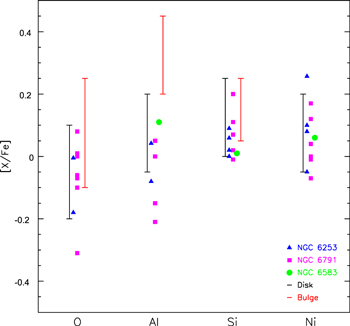
Figure 5. Plot of the [X/Fe] abundance data from Table 7 for O, Al, Si, and Ni; see Table 7 for references. The abundances of NGC 6253, 6791, and 6583 are represented by blue triangles, magenta squares, and green circles, respectively. The black and red error bars show representative abundance ranges for [Fe/H]  for the disk and bulge, respectively.
Download figure:
Standard image High-resolution imageSix out of the seven reported [O/Fe] abundances for NGC 6791 fall within ±0.1 dex of scaled-solar (see Table 7 for references), strongly suggesting that [O/Fe] in NGC 6791 is near scaled-solar. Note that while Bragaglia et al. (2014) reports [O/Fe] = −0.2 (see their Section 4.2), the mean of the stellar [O/Fe] values reported in their Table 3 is −0.10 ± 0.03 (where the error is  ), and A. Bragaglia et al. (2014, private communication) have confirmed that this slightly higher value is the correct one. Geisler et al. (2012) reported a range of −0.10 to
  for their sample of NGC 6791 stars, and from their sample of stellar O abundances we have calculated an average of 0.08 ± 0.02 (where the error is
  ), as given in our Table 7. Geisler et al. (2012) interpret their large range in oxygen abundances as reflecting the presence of multiple stellar populations in that cluster. We note that the range in [O/Fe] for the individual cluster stars reported by Geisler et al. (2012) is in fact larger than the typical abundance errors. However, in both Bragaglia et al. (2014) and Boesgaard et al. (2014), the range in the individual [O/Fe] abundances reported is comparable to or less than the typical abundance errors, which is consistent with a single population; in the latter, the full range in the stellar [O/Fe] is only 0.12 dex. The [O/Fe] reported by C07 for NGC 6791 is ∼0.3 dex below scaled-solar. While we may note that C07 have reported the highest [Fe/H] for NGC 6791, 0.12 dex above the median of the reported [Fe/H] values, this would account for only part of the difference between the C07 [O/Fe] and all of the other reported [O/Fe] values; the details provided by C07 regarding their O abundance analysis (see the above discussion of their O abundance result for NGC 6253) also do not provide a clear explanation for the difference. We note that the C07 stars in both NGC 6253 and NGC 6791 are red clump stars, and thus are more evolved than the stars in any of the other studies cited in Table 7. This raises the question of whether additional mixing could have occurred in the stars in C07's sample, thus lowering their surface O abundances; this possibility remains speculative, however, due to the lack of stellar evolution models that include the effects of non-standard mixing mechanisms (as discussed above). If the C07 [O/Fe] abundance scale were raised by 0.2–0.3 dex, this would bring their [O/Fe] results for both NGC 6253 and NGC 6791 to within ±0.1 dex of solar, thus placing all reported [O/Fe] values for both NGC 6253 and NGC 6791 within this near-scaled-solar range. While the two reported O abundances for NGC 6253 do not yet allow us to conclude that [O/Fe] in NGC 6253 is also securely near-scaled-solar, the reported abundances for NGC 6253 and NGC 6791 may indicate that [O/Fe] is scaled-solar in the super-metal-rich regime. In Section 4.3, we discuss the reported [O/Fe] values for both clusters in the context of the apparent [O/Fe] versus [Fe/H] relationship in the Galaxy.
Four of the studies of [Si/Fe] in NGC 6791 are consistent with a scaled-solar or marginally super-scaled-solar value (C07; Carraro et al. 2006; Origlia et al. 2006; Boesgaard et al. 2014), as is the one reported value for NGC 6583 (Magrini et al. 2010), though the other two studies of NGC 6791 (Boesgaard et al. 2009; Peterson & Green 1998) hint at a very slight super-scaled-solar abundance; the disk dwarfs and giants in C07 are consistent with such a slight overabundance. The three previous studies of [Si/Fe] in NGC 6253 (AT10; C07; S07) and also the one study for NGC 6583 (Magrini et al. 2010) all find values consistent with scaled-solar, though our own result for NGC 6253 hints at a slightly higher [Si/Fe]. Thus, all three clusters have scaled-solar [Si/Fe] or perhaps just slightly higher.
Most reported values of [Ni/Fe] for all three clusters are consistent with scaled-solar or marginally super-scaled-solar. Although, two studies for NGC 6791 are slightly higher, ![$[{\rm Ni}/{\rm Fe}]=+0.17\pm 0.06$](https://content.cld.iop.org/journals/1538-3881/149/4/141/revision1/aj510411ieqn251.gif) and +0.12 ± 0.02 (Boesgaard et al. 2009; Bragaglia et al. 2014), as are the values for NGC 6253 from AT10 (+0.10 ± 0.02) and the present study (+0.257 ± 0.023). The disk dwarfs and giants in C07 are consistent with a slightly super-scaled-solar abundance.
and +0.12 ± 0.02 (Boesgaard et al. 2009; Bragaglia et al. 2014), as are the values for NGC 6253 from AT10 (+0.10 ± 0.02) and the present study (+0.257 ± 0.023). The disk dwarfs and giants in C07 are consistent with a slightly super-scaled-solar abundance.
Most reported values of [Al/Fe] are near scaled-solar for all three clusters. The present result for NGC 6253 is marginally super-scaled-solar, while that of C07 is consistent with scaled-solar given the errors. The one reported value for NGC 6538 of +0.11 ± 0.02 is marginally super-scaled-solar and is technically a  result. One of the four values for NGC 6791, −0.21 ± 0.09 from C07, is only marginally (barely
  ) sub-scaled-solar. In comparison, the disk dwarfs and giants in the C07 compilation are consistent with a slightly super-scaled-solar abundance.
Overall, the evidence to date suggests that the apparent elemental abundance patterns of all three clusters, are similar to each other, are similar to (i.e., extrapolations of) patterns seen in disk dwarfs and giants, and are close to scaled-solar. Furthermore, the apparent slight differences from scaled-solar are consistent with patterns seen in disk dwarfs and giants. In contrast, comparison of the abundances of NGC 6253, 6583, and 6791 to those of the F07 bulge stars with [Fe/H]  (which are few) reveals more differences than similarities: in [O/Fe], the reported values for NGC 6253 and 6791 range from −0.31 to +0.08, with all but two within ±0.1 dex of scaled-solar, whereas the F07 stars are between −0.1 and +0.25, and thus are significantly higher, though with some overlap; in
 ![$[{\rm Na}/{\rm Fe}]$](https://content.cld.iop.org/journals/1538-3881/149/4/141/revision1/aj510411ieqn255.gif) , the reported values for NGC 6253 and 6791 (C07; S07; see the averages we have calculated above using the S07 values) range from +0.07 to +0.21, while the F07 stars are between +0.2 and +0.35, with which the clusters would be consistent, though at the low end, if the NLTE value of +0.07 were dropped; in [Mg/Fe], the reported values for the three clusters range from −0.05 to +0.30 (C07; S07; Magrini et al. 2010, see the averages we have calculated above using the S07 values) and the F07 stars are between +0.15 and +0.40, which is reasonably consistent with, though somewhat higher than, the clusters; in [Al/Fe], the three clusters range from −0.21 to +0.11 (see Table 5), whereas the F07 stars are all substantially higher, with values between +0.30 and +0.55; in [Si/Fe], the three clusters range from −0.01 to +0.20 (see Table 5), whereas the F07 stars are somewhat higher and with only marginal overlap, with values between +0.15 and +0.35; and in both [Ca/Fe] and [Ti/Fe], the three clusters have values between −0.20 and approximately solar (C07; S07; Magrini et al. 2010), while the F07 stars have values between −0.1 and +0.25, but the overlap in each depends on just one of the F07 stars, and thus the bulge stars are again significantly higher. In short, of all seven species, only the abundances of Na and Mg can be interpreted as being modestly consistent between the clusters and the bulge stars, while the bulge stars have (at least) significantly higher abundances in the other five species.
, the reported values for NGC 6253 and 6791 (C07; S07; see the averages we have calculated above using the S07 values) range from +0.07 to +0.21, while the F07 stars are between +0.2 and +0.35, with which the clusters would be consistent, though at the low end, if the NLTE value of +0.07 were dropped; in [Mg/Fe], the reported values for the three clusters range from −0.05 to +0.30 (C07; S07; Magrini et al. 2010, see the averages we have calculated above using the S07 values) and the F07 stars are between +0.15 and +0.40, which is reasonably consistent with, though somewhat higher than, the clusters; in [Al/Fe], the three clusters range from −0.21 to +0.11 (see Table 5), whereas the F07 stars are all substantially higher, with values between +0.30 and +0.55; in [Si/Fe], the three clusters range from −0.01 to +0.20 (see Table 5), whereas the F07 stars are somewhat higher and with only marginal overlap, with values between +0.15 and +0.35; and in both [Ca/Fe] and [Ti/Fe], the three clusters have values between −0.20 and approximately solar (C07; S07; Magrini et al. 2010), while the F07 stars have values between −0.1 and +0.25, but the overlap in each depends on just one of the F07 stars, and thus the bulge stars are again significantly higher. In short, of all seven species, only the abundances of Na and Mg can be interpreted as being modestly consistent between the clusters and the bulge stars, while the bulge stars have (at least) significantly higher abundances in the other five species.
4.3. NGC 6253 and NGC 6791 in the Context of the Chemical Evolution of Oxygen
Based upon the spectroscopic abundances detailed above, there is little question that NGC 6253 is 2.5 to 3 times more metal-rich that the Sun, not just in Fe but, within the uncertainties, across the board for all elements measured. Since the [Fe/H] abundance distribution for OCs younger than 7 Gyr within 1.5 kpc of the Sun produces an average [Fe/H] equal to solar with a dispersion of only 0.10 dex (Twarog et al. 1997) and no trend with age, NGC 6253 is more than three sigma away from the mean for any age. Furthermore, this is true even if the comparison is expanded beyond the solar neighborhood, as demonstrated by Figure 7 of Friel et al. (2010), which shows [Fe/H] versus age based on OC data (both from their own study and others in the literature; see references therein) which thoroughly sample  = 7–14 kpc (with a few at even larger RG). The data included in Figure 7 of Friel et al. (2010) indicate a median OC [Fe/H] near or slightly below solar, a dispersion of ∼0.15, and no clear trend with age. NGC 6253, represented in the figure by both the C07 and S07 results, is clearly well above the scatter at all ages and RG.
In the upper panel of Figure 6, we compare our NGC 6253 oxygen results to the OC sample of K93 in the age domain. Our results for the Hyades and NGC 752 (Maderak et al. 2013) indicate that our abundance scale is consistent with that of K93, differing by −0.016 ± 0.069 on average. Given the [O/H] versus age relationship found by K93, we see that NGC 6253 is extraordinarily oxygen-rich for its age. Furthermore, we note that this would still be true even for the substantially lower ![$[{\rm O}/{\rm H}]$](https://content.cld.iop.org/journals/1538-3881/149/4/141/revision1/aj510411ieqn257.gif) reported by C07. The upper panel of Figure 6 also shows additional OC dwarf triplet abundances from the literature, which are surprisingly few and consist almost entirely of clusters of Hyades age or younger (Schuler et al. 2004; Ford et al. 2005; King & Schuler 2005; Schuler et al. 2006; Shen et al. 2007; Maderak et al. 2013). These additional clusters imply significant scatter in the oxygen abundances of young clusters, but nonetheless are consistent with the K93 relationship. In the lower panel of Figure 6, we add OC giant O abundances from Friel et al. (2010) and from the Bologna OC Chemical Evolution group (Gratton & Contarini 1994; Carretta et al. 2005; C07), which nicely sample the OC age range from 1–10 Gyr; the lower panel also includes all reported literature values to date for NGC 6791 (discussed above and again below). Based primarily on the Friel et al. (2010) sample, it appears that the scatter for old clusters is substantial, with an evenly populated dispersion across the represented age range. But, the old clusters still exhibit a substantially lower average, with almost no clusters overlapping the young cluster range in [O/H]. It is possible that some of the scatter arises from the fact that several of the Friel et al. (2010) clusters are represented by only 1 star each. Regardless, our present [O/H] for NGC 6253 remains much higher than any of these old clusters, except possibly NGC 6791. Nonetheless, even C07's [O/H] for NGC 6253, which is somewhat lower than our own, is still among the highest values in Figure 6.
reported by C07. The upper panel of Figure 6 also shows additional OC dwarf triplet abundances from the literature, which are surprisingly few and consist almost entirely of clusters of Hyades age or younger (Schuler et al. 2004; Ford et al. 2005; King & Schuler 2005; Schuler et al. 2006; Shen et al. 2007; Maderak et al. 2013). These additional clusters imply significant scatter in the oxygen abundances of young clusters, but nonetheless are consistent with the K93 relationship. In the lower panel of Figure 6, we add OC giant O abundances from Friel et al. (2010) and from the Bologna OC Chemical Evolution group (Gratton & Contarini 1994; Carretta et al. 2005; C07), which nicely sample the OC age range from 1–10 Gyr; the lower panel also includes all reported literature values to date for NGC 6791 (discussed above and again below). Based primarily on the Friel et al. (2010) sample, it appears that the scatter for old clusters is substantial, with an evenly populated dispersion across the represented age range. But, the old clusters still exhibit a substantially lower average, with almost no clusters overlapping the young cluster range in [O/H]. It is possible that some of the scatter arises from the fact that several of the Friel et al. (2010) clusters are represented by only 1 star each. Regardless, our present [O/H] for NGC 6253 remains much higher than any of these old clusters, except possibly NGC 6791. Nonetheless, even C07's [O/H] for NGC 6253, which is somewhat lower than our own, is still among the highest values in Figure 6.
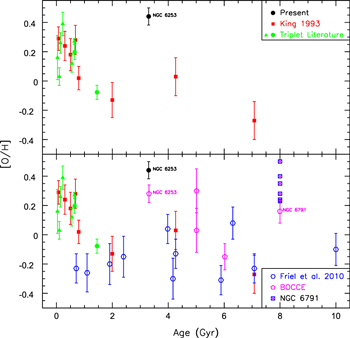
Figure 6. [O/H] vs. Age for the present NGC 6253 result (black circle), the sample of K93 (red squares), additional OC triplet abundances from the literature (green triangles; see references in the text; Maderak et al. (2013) values are distinguished as green circles). In the lower panel we add the OC giant abundances of Friel et al. (2010; blue hexagons) and of the BOCCE group (magenta pentagons; see references in the text), in addition to all values reported to date for NGC 6791 (blue squares with magenta crosses); see Table 7 for references.
Download figure:
Standard image High-resolution imageTo provide further context for both NGC 6253's high O abundance and its high Fe abundance, in Figure 7 we plot ![$[{\rm O}/{\rm Fe}]$](https://content.cld.iop.org/journals/1538-3881/149/4/141/revision1/aj510411ieqn258.gif) versus [Fe/H] for all available literature values for both NGC 6253 and NGC 6791 (see Table 7 for details), along with disk dwarf abundance results from Ramirez et al. (2013, hereafter R13), and have also included the bulge giant abundance results from F07. R13's O abundances were derived from an NLTE analysis of the triplet in field dwarfs and giants within 200 pc of the Sun. They also derived thin disk, thick disk, and halo kinematic membership probabilities for each star. For our Figure 7, we have made selection cuts similar to those that R13 made for their Figure A1: thin disk and thick disk stars are selected to have respective membership probabilities of 50% or greater, giants are excluded by selecting only stars with
versus [Fe/H] for all available literature values for both NGC 6253 and NGC 6791 (see Table 7 for details), along with disk dwarf abundance results from Ramirez et al. (2013, hereafter R13), and have also included the bulge giant abundance results from F07. R13's O abundances were derived from an NLTE analysis of the triplet in field dwarfs and giants within 200 pc of the Sun. They also derived thin disk, thick disk, and halo kinematic membership probabilities for each star. For our Figure 7, we have made selection cuts similar to those that R13 made for their Figure A1: thin disk and thick disk stars are selected to have respective membership probabilities of 50% or greater, giants are excluded by selecting only stars with  , and stars with
  K are excluded due to the triplet overabundance trend (see our discussion above). We note that R13 excluded only stars with
  K. Furthermore, we have plotted Fe abundances derived from Fe ii lines only, which reduces the scatter in the resulting trend, as R13 noted. In the case of the F07 results, we have plotted the average of their Fe i and Fe ii abundances for each star.

Figure 7. [O/Fe] vs. [Fe/H] for all available literature values to date for NGC 6253 (blue triangles) and NGC 6791 (open magenta squares), and for the thin disk dwarfs (red squares) and thick disk dwarfs (closed black circles) from Ramirez et al. (2013), and for the bulge giants from Fulbright et al. (2007, open black circles); see Table 7 and Section 4.3, respectively, for details. The parallel dashed lines show a linear extrapolation of the apparent scatter in the disk dwarf trend, thus representing the approximate limits of a continuation of the apparent linear trend seen for [Fe/H]  .
.
Download figure:
Standard image High-resolution imageAs seen in our Figure 7, from [Fe/H] = −0.5 to ∼0 the R13 abundance data exhibit a clear trend of declining [O/Fe] (as expected, see the discussion in the introduction), from a high of ∼+0.4 to a low of ∼−0.1, with an overall scatter of approximately 0.2 dex in [O/Fe]. The dashed lines trace the approximate median trend of the stars at the limits of the apparent scatter for [Fe/H]  , and are meant to represent the approximate limits of a linear continuation of the apparent [O/Fe] versus [Fe/H] trend exhibited for [Fe/H] < 0. The behavior of the scatter for [Fe/H] > 0 reveals an intriguing feature. Whereas the horizontal scatter is comparable to or exceeds the width between the dashed lines throughout the entire metallicity range shown, this is only true of the vertical scatter for [Fe/H] < 0. For [Fe/H] > 0, in contrast, the vertical scatter decreases steadily as [Fe/H] increases from solar to
  and, most strikingly, there is a clear "floor" at [O/Fe] = −0.1. A possible interpretation is that this indicates a "flattening" of the [O/Fe] versus [Fe/H] relation for super-solar metallicity. This apparent flattening is arguably seen in other field star samples. For example, the field star abundance data compiled by C07, which include both dwarfs and giants and includes data up to [Fe/H] = ∼+0.35, can be interpreted as exhibiting a similar flattening for [Fe/H] > 0, but with the floor occurring at [O/Fe] = −0.2 instead of −0.1. However, neither the R13 sample nor the C07 compilation are inconsistent with a continuation of the roughly linear trend observed at sub-solar metallicities. As discussed above, most of the reported [O/Fe] abundances for NGC 6253 and NGC 6791 fall between −0.1 and +0.1, and thus can be interpreted as supporting a flattening, or even a reversal, of the trend. However, it must be acknowledged that the median [O/Fe] values for each cluster are consistent with both scenarios (flattening versus continuing). Thus, while the reported abundances for these two clusters may hint at the form of the [O/Fe] versus [Fe/H] trend at super-high-metallicity, they do not yet reveal it with clarity.
Given the issues raised by the above discussion, the pertinent questions are: what do the available theoretical models predict for the behavior of the [O/Fe] versus [Fe/H] relationship at metallicities above solar? And, do super-metal-rich clusters such as NGC 6253 and NGC 6791 necessarily reflect the same chemical origin and evolution history as the disk stars which define the apparent [O/Fe] versus [Fe/H] relationship? The most relevant chemical evolution model results for the [O/Fe] versus [Fe/H] relationship at metallicities above solar were produced by Kobayashi et al. (2006), who computed [X/Fe] versus [Fe/H] relationships for the elements C though Zn for metallicities up to [Fe/H] ∼ +0.2. The predicted [O/Fe] versus [Fe/H] relationship, presented in their Figure 28, appears to have a modestly positive second derivative for [Fe/H] > −1; i.e., the trend can be interpreted as exhibit some flattening. The Kobayashi et al. (2006) model results reach [O/Fe]  for [Fe/H]
  , in good agreement with the trend exhibited by the abundance data compiled by C07, though modestly discrepant from that exhibited by the R13 sample (which as noted above has an apparent floor at [O/Fe] = −0.1). If the slope of the predicted relationship at [Fe/H] ∼ +0.2 were extended, it would reach [O/Fe] ∼ −0.2 at [Fe/H] ≈ +0.4. As implied in the above discussion of the [O/Fe] ratios reported at metallicities comparable to NGC 6253, [O/Fe] ∼ −0.2 is consistent with both interpretations (flattening versus a continuation of the linear trend) of the behavior of the observed relationship, given the scatter exhibited by the R13 thin and thick disk dwarf abundances (and also, for example, by the C07 compilation). Any further flattening of the predicted trend would marginally support the interpretation that the observed abundances exhibit flattening substantial enough to allow a solar [O/Fe] at the metallicity of NGC 6253. Unfortunately, the Kobayashi et al. (2006) results do not allow resolution of this question.
The tantalizing ambiguity that has arisen from the available abundance data and chemical evolution models begs the question of whether a further flattening of the trend is plausible. A flattening of the [O/Fe] versus [Fe/H] relationship implies an increasing O yield and/or decreasing Fe yield from supernovae with increasing metallicity. Regarding O, the production of which is dominated by SNe II, the theoretical Type II yields produced by Woosley & Weaver (1995) indicate that the O yield increases by 15% from [Fe/H] = −1 to solar. In the case of Fe, SNe Ia and SNe II are estimated to contribute 50% each to Galactic Fe production, as noted in the Introduction. For SNe II, the Woosley & Weaver (1995) yields indicate that the Fe yield increases by a factor of 5.7 from [Fe/H] = −1 to solar. While it might be reasonable to assume that the Type II O and Fe yields continue to increase with metallicity for [Fe/H] > 0, further speculation is unfounded due to the lack of Type II yields for super-solar metallicity.
In the case of Type Ia production of Fe, theoretical predictions for the change in yield for super-solar metallicity do exist. The principal source of the Fe produced by SNe Ia is the radioactive decay of 56Ni, which is synthesized during the explosion, to 56Fe (Kuchner et al. 1994). Timmes et al. (2003) argue from statistical nuclear equilibrium that the 56Ni yield of SNe Ia should decrease with increasing metallicity, due to the preferential synthesis of stable species/isotopes, principally 58Ni and 54Fe, in a neutron-rich explosion rather than the unstable 56Ni. This effect would decrease the 56Fe yield by  at a metallicity 3 times solar, compared to the yield at solar metallicity. Timmes et al. (2003) demonstrated that such an effect is independent of the detailed physics of the explosion. Bravo et al. (2010) also examined the dependence of ejected 56Ni mass on metallicity. They argue that the material processed during the explosion does not burn fully to statistical nuclear equilibrium, and also that metallicity is only an intermediary parameter rather than the true cause of the correlation between ejected 56Ni mass and metallicity. Nonetheless, they actually found a steeper decrease in ejected 56Ni mass with metallicity, resulting in a
  decrease (in 56Ni mass) at a metallicity 3 times solar (compared to the yield at solar metallicity). The yield of 56Fe would therefore also be decreased by this amount.
Howell et al. (2009) investigated the metallicity dependence of the ejected 56Ni mass by measuring the bolometric luminosity of SNe Ia in external galaxies, an approach possible because the decay of 56Ni to 56Fe is the source of Type Ia luminosity. They assumed that the gradient-corrected metallicity of the host could be used as a proxy for the metallicity of the progenitor. They found that Ni mass does indeed decrease with metallicity, although the theoretical argument of Timmes et al. (2003) could account for only a small portion of the scatter. However, Timmes et al. (2003) have noted that the proposed metallicity effect would only dominate at "several times" solar metallicity. Thus, the Howell et al. (2009) sample, which the authors acknowledge does not include data for significantly super-solar metallicities, is not likely to reveal the predicted metallicity effect.
Quantitative investigation of the metallicity dependence of the Fe yield from SNe Ia is not yet possible due to the lack of chemical evolution models which include the super-solar metallicity regime. However, we may note from Figure 1 of Timmes et al. (2003) that the predicted metallicity effect becomes significant only near solar metallicity (and becomes more substantial at higher metallicities), while the apparent flattening of [O/Fe] in the R13 data and the C07 compilation also occurs near solar metalicity. Furthermore, we would expect to see a similar positive change in slope in analogous [X/Fe] relationships, as is exhibited in Figure 6 of C07, and exemplified in particular by the [Na/Fe] data seen there. In short, it seems that the predicted metallicity effect could be a plausible basis for flattening in the [O/Fe] versus [Fe/H] relationship at super-solar metallicity. However, the 50% contribution to galactic Fe by SNe II must be kept in mind, and the lack of knowledge of Type II yields for super-solar metallicities makes it impossible to predict whether the Type Ia metallicity effect would actually be able to significantly alter the [O/Fe] versus [Fe/H] relationship. Given the growing body of cluster abundances that probe the super-solar metallicity regime, appropriate supernova and chemical evolution models are urgently needed if we are to understand both the enrichment history that might give rise to such super-solar metallicity objects and how those objects fit into the chemical evolution of the galaxy as a whole. Of particular relevance to the present case is knowledge of how metal-rich the supernova progenitor population must be to explain the abundance patterns of such clusters as NGC 6253 and NGC 6791.
There are additional intriguing issues to consider. A possible explanation for the high metallicities and abundance patterns of clusters such as NGC 6253 and NGC 6791 is that they originated in the more metal-rich environments closer to the galactic bulge. This possibility will be discussed in detail in the following subsections. If that is the case, then these clusters cannot be understood merely as an extension to higher metallicity of the [O/Fe] versus [Fe/H] relationship exhibited by the stars of the Galactic disk. Instead, the extension of the trend (whatever its exact form) and the super-metal-rich clusters would both independently reflect supernova enrichment in high metallicity environments; i.e., the observed [O/Fe] versus [Fe/H] relationship would be characteristic of chemical evolution in the high metallicity regime. The alternative, for example, is to attempt to explain the [O/Fe] values of both NGC 6253 and NGC 6791, if truly consistent, by invoking fine-tuned contributions from both SNe II and SNe Ia in a localized environment. But this would require a double-coincidence, namely having completely disparate progenitor populations (with different enrichment timescales) present in two different localized environments, and at two substantially different times in Galactic history. The "convergent evolution" argument we have proposed above is not only much more plausible, but furthermore alleviates the otherwise perplexing question of how two clusters that differ in age by 5 Gyr can have similar (if not completely consistent) [O/Fe] values; i.e., the environment in which a cluster formed, rather than its age, is the dominant factor in determining its abundances. There is an intriguing corollary to this argument: if the [O/Fe] ratios of NGC 6253 and NGC 6791 are truly approximately solar and also indicative of supernova enrichment in a high-metallicity environment, then [O/Fe] values substantially below scaled solar, e.g., C07's value for NGC 6791, would imply a unique origin in an idiosyncratic, localized environment.
4.4. On the Origin of the Super-metal-rich Star Clusters
The ultra-high metallicity of NGC 6791 is no longer a singular oddity. Our Galaxy seems to have produced at least three such OCs, and given that the number of OCs within the Galactrocentric radius ( = 8.5 kpc) that have confident metallicity determinations remains small (e.g., Magrini et al. 2010), one can expect that discoveries of additional super-metal-rich clusters are forthcoming. The already interesting questions of how, where, and when these clusters originated therefore become crucial to our understanding of the evolution of the Galaxy itself.
Regarding "when," the age of NGC 6791 is now confidently known to be near 8 Gyr (see the detailed discussion in AT10). So, the Milky Way was somehow able to produce a super-high-metallicity cluster at an early stage in the development of the disk. In AT10, we determined the age of NGC 6253 to be about 3 Gyr, consistent with Bragaglia et al. (1997), Bragaglia & Tosi (2006), Twarog et al. (2003) and even Piatti et al. (1998), whose somewhat higher age had a large error bar. Carraro et al. (2005) find that NGC 6583 is only about 1 Gyr old. The Milky Way seems to have been able to produce clusters of super-high-metallicity at a variety of ages, including at relatively recent times.
The origin of these three clusters becomes enigmatic when one considers the clusters' Galactic positions. Figure 8(a) shows the locations of NGC 6253 (blue), NGC 6583 (green), and NGC 6791 (red) against the four-arm Galactic model of Steiman-Cameron et al. (2010; see also Steiman-Cameron 2010). The gray shading represents the vertically integrated [C ii] 158  volume emissivity required to fit COBE observations of that line. The same spiral geometry is found using [N ii] 205
  emission data. These two lines are very important coolants of the interstellar medium. Their emissions are strongly concentrated in the spiral arms, and they offer perhaps the strongest arm/inter-arm contrast of any spiral tracer. The central bar in Figure 8 represents the maximum radial extent of the Galactic bar that is consistent with COBE data. The orange circles indicate
  = 3, 5, and 8 kpc. Figures 8(b)–(d) show the past few orbits of NGC 6791, based on Figure 3 of Bedin et al. (2006) and Figure 2 of Jilkova et al. (2012); these two orbit determinations are discussed below. The orbits plotted in Figure 8 show that NGC 6791 is now on its way to the inner disk. Whereas chemical evolution models can produce super-high-metallicity in the inner disk (
 4–5 kpc) and some models can do so even at least as early as 6 Gyr ago (e.g., Magrini et al. 2009 for
  3–4 kpc), all three clusters lie at substantially greater Galactocentric distances than these: 8.1, 6.8, and 6.5 kpc for NGC 6791, NGC 6253, and NGC 6583, respectively; their distances from the Sun are 4.0 ± 0.6 kpc, 1.735 ± 0.12 kpc, and 2.1 kpc (the stated errors are represented by the lines attached to the cluster points in Figure 8; note that the blue line is is smaller than the blue point, and the red line is just barely larger than the red point). For NGC 6583, the distance could be as high as ∼3 kpc (see the
  Gyr) OCs with reliable metallicities within 1 kpc of the Sun (RG = 8–9) have metallicities much closer to solar (e.g., Boesgaard 1989; Twarog et al. 1997), and in no case larger than that of the Hyades ([Fe/H] = +0.15), yet the iron abundance in chemical evolution models such as those of Magrini et al. (2009) continues to increase for RG = 4–9 kpc as the Galaxy ages.
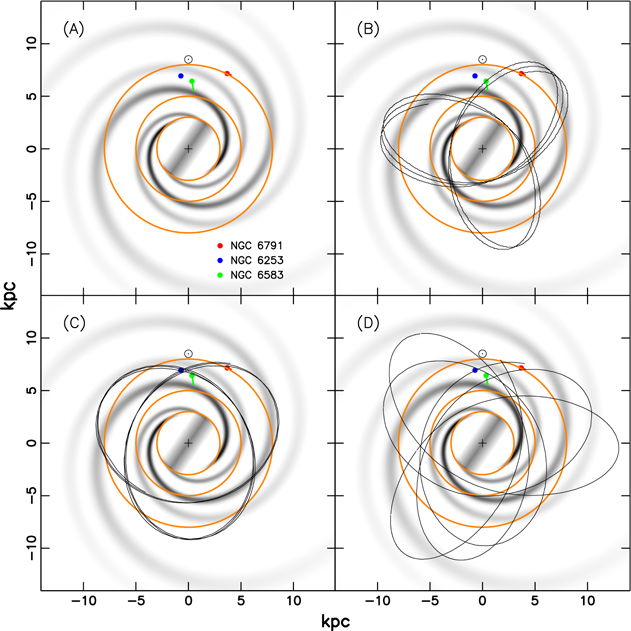
Figure 8. Panel a shows the locations of NGC 6253 (blue), NGC 6583 (green), and NGC 6791 (red) against the four-arm Galactic model of Steiman-Cameron et al. (2010). The lines attached to the cluster points represent the error in the cluster distances; note that for NGC 6253 (blue), the line is smaller than the point. The gray shading indicates the local C ii volume emissivity, while the central bar shows the maximum radial extent for the Galactic bar that is consistent with COBE C ii observations. The plus sign indicates the Galactic center, and the ⊙ symbol indicates the position of the Sun, assumed at RG = 8.5. The orange circles indicate  = 3, 5, and 8 kpc. Panels (b)-(d) show the last few orbits of NGC 6791 from (b) the axisymmetric model potential of B06, (c) the axisymmetric model potential of J12, and (d) a more realistic model potential of J12 that includes a bar and spiral arms.
Download figure:
Standard image High-resolution imageIn the case of NGC 6791, a plausible solution to the metallicity-versus-galactocentric distance conundrum has emerged from the proper motion study of Bedin et al. (2006, hereafter B06), which is based on data from the Hubble Space Telescope. Both B06 and Jilkova et al. (2012, hereafter J12) have determined orbits for the cluster, in each case by integrating the orbit in a model Galactic potential for 1 Gyr into the past. Note that additional orbit calculations for NGC 6791 were done by C06 and Wu et al. (2009). Both B06 and J12 use the same cluster proper motion and RV, but differ slightly in their assumptions about the Galactocentric distance RG for the Sun and about the motion ( ) of the Local Standard of Rest. B06 used a time-independent axisymmetric Galactic potential, and found an orbit with a perigalacticon of about 3 kpc, an apogalacticon of about 10 kpc, and an eccentricity of about 0.5 (Figure 8(b)); B06 noted that these characteristics are not very sensitive to the uncertainties in the cluster distance. Figure 8(c) shows the orbit that J12 found using an axisymmetric potential. Their orbit is substantially less elongated orbit than that of B06, with a perigalacticon near 5 kpc, an apogalacticon of 9 kpc, and eccentricity of 0.3; the errors in the observed distance and kinematic values cause variations of only a few percent in these orbital parameters. J12 also calculated orbits for a more realistic, time-dependent potential which incorporated both a bar and spiral arms (example in Figure 8(d)). The size and orientation of the bar used in this model potential were similar to the those found by Steiman-Cameron et al. (2010) and depicted in our Figure 8. J12 integrated their time-dependent potential for 1000 sets of initial conditions, which were generated by assuming that the errors in the observed proper-motion values reflect normal distributions. This last model (and the B06 model) have perigalacticon values that fall within the range in which chemical evolution models can produce super-high-metallicity at an earlier Galactic age than that of NGC 6791 (
 3–4 kpc). J12 suggest that the cluster could have formed in the central regions of the disk and then migrated outward. Note that the possible radial migration of the cluster is supported by the orbit depicted in Figure 8(d), which reflects a time-dependent potential, but not by the orbits depicted in Figures 8(b) and (c), which reflect time-independent potentials.
The question then is how NGC 6791 got onto its present orbit. One possibility is that the central Galactic bar kicked it, possibly aided by the spiral arms, a combination which has been found to cause more efficient stellar migration in simulations (see the discussion in J12). This possibility has been tested through further simulations by J12, using the same potential model as for their NGC 6791 orbit determination (though made stronger to account for possible weakening of the non-axisymetric components in the time since the formation of the cluster) and using initial cluster orbital radii distributed from 3–5 kpc with varying initial azimuths. 104 initial orbits were followed. They integrated each orbit forward in time for 8 Gyr (the approximate age of NGC 6791) and compared the distribution of results to their own determination of the current cluster orbit. Using the probability distributions generated via this Monte Carlo approach, J12 find a 0.4% probability that NGC 6791 could have formed in the inner regions of the disk and then subsequently migrated outward. They suggest that this non-zero probability merits further investigation with more sophisticated models. One possible interpretation of such a low (but non-zero) probability is that many super-metal-rich clusters exist at small RG, and NGC 6791 is one of those very few that got kicked out. While these are interesting and encouraging possibilities, questions remain, e.g., regarding the longevity of the non-axisymetric components of the Galactic potential. J12 note however that their results may only place an upper limit on the Galactic potential required, due to the possible contribution of other migration mechanisms (see Schonrich & Binney 2009, for another discussion of possible rapid radial migration). In summary, it appears that while a plausible explanation exists for both NGC 6791's current orbit and super-metal-rich nature, the work to date is inconclusive.
Do either of NGC 6253 or NGC 6583 also lie on eccentric orbits? Present evidence is confounding. The Montalto et al. (2009) study of NGC 6253 was limited to relative proper motions, because of the absence of background galaxies, which are necessary to place proper motions on an absolute scale. Thus, while the study provides considerable information about cluster membership, no orbit was determined. The more recent study of Magrini et al. (2010, hereafter M10) does provide absolute proper motions for both NGC 6253 and NGC 6583, based on the UCAC3 catalog, and also presents computed orbits for these and other clusters. Two points are worth noting. First, the errors in the proper motions of NGC 6253 are nearly as large as the proper motions themselves, and the proper motion errors of NGC 6583 are twice as large as the proper motions. By contrast, the proper motion errors in the B06 HST study of NGC 6791 are only 23% and 5% (in  , respectively) of the stated proper motions. Second, details on the challenging problem of tying the ICRS data to the fainter cluster data (Tycho-2 stars have a faint limit near V = 11) remain forthcoming (see the discussion in M10). That said, the M10 orbits for NGC 6253 and NGC 6583 are more typical of OCs, though with non-negligible eccentricity. They find that NGC 6253 moves from RG = 5.4–8.0 kpc, and NGC 6583 goes from RG = 5.9–6.8 kpc. As discussed above, the difficulties in producing super-high-metallicities at large RG are formidable, and are also complicated by the constraint to keep near-solar abundances at RG = 8.5 kpc. Thus, if the M10 orbits are robust, the origins of NGC 6253 and NGC 6583 remain shrouded in mystery. Even if eccentric orbits are possible for these two clusters, their smaller ages (compared to NGC 6791) present an additional difficulty. The scenario described above for NGC 6791, namely that NGC 6791 formed at low RG but then got kicked out, is even more problematic for NGC 6253 and NGC 6583 because of their ages (3 and 1 Gyr, respectively). Such a mechanism (which we stress is already problematic due to the issues outlined above for the case of NGC 6791) has had less time to act effectively in the case of these two younger clusters, especially for NGC 6583. Note that the Galactic latitude of NGC 6583 is
  , placing it firmly within the Disk. This suggests that any (rapid) radial migration that the cluster might have conceivably experienced has not (yet) moved it out of the plane of the Disk. By contrast, note that b = +10
 9 for NGC 6791, consistent with the possibility that an earlier gravitational encounter kicked the cluster out from small RG to larger RG, and possibly also slightly out of the Galactic plane. The latitude of NGC 6253,
  , does not imply any obvious conclusions, placing the cluster very close to the Disk or even within it.
Could NGC 6583 be substantially older than 1 Gyr, potentially alleviating this problem? In deriving an age of 1 Gyr, Carraro et al. (2005, hereafter C05) had only VI data available, and furthermore assumed a solar metallicity for the cluster. C05 found that a solar metallicity isochrone fit the cluster data reasonably well, and furthermore found that both more metal-poor and more metal-rich isochrones fit more poorly. However, M10 found that two presumed cluster members are super-metal-rich, which could imply a different age for the cluster, and also found a somewhat different reddening for the cluster based on the spectroscopic Teff values inferred from ionization balance. In view of these two new pieces of information, we review the turnoff age of the cluster in
5. SUMMARY AND CONCLUSIONS
Using high-dispersion CTIO/Hydra spectra, we have presented an abundance analysis of 36 stars consistent with single-star membership (based upon our derived RVs) in the super-metal-rich OC NGC 6253, with emphasis on the O abundance. The stars include 30 turnoff stars, 5 subgiants, and one blue straggler. EWs were measured for lines of O, Fe, Al, Si, and Ni, and abundances were derived in a strictly differential analysis with respect to the Sun (using solar  values) using the atmospheric parameters determined in AT10. Given that our sample consists primarily of dwarfs (at the MSTO), such a differential analysis yields reliable results. The cluster average for each species was calculated in linear space, using the values from all individual line measurements, weighted by the abundance error of each line measurement. The number of stars in our sample is at least 70% larger than in any other study, except AT10, of any of the three known super-metal-rich clusters (NGC 6253, NGC 6791, and NGC 6583). Our results are therefore some of the most reliable elemental abundances available at high metallicity. In the case of the 7774 Å O i triplet, recent improvements in understanding the behavior of NLTE effects and additional low-temperature complications (perhaps due to stellar activity) have allowed us to deliver reliable oxygen abundances. Our principal conclusions may be summarized as follows.
- 1.Our RV analysis has confirmed 38 stars consistent with single-star membership (out of 47 stars observed), giving a cluster average of −29.60 ± 0.31 km s−1, where the error is
 . Our values have been placed on an absolute scale using RV standards. This result is in striking agreement with the independent result from AT10.
 - 2.We have reported [Fe/H] = +0.445 ± 0.014, with scaled-solar values of [Al/H] = +0.487 ± 0.020 and [Si/H] = +0.504 ± 0.018, all in very good agreement with other studies. The value [Ni/H] = +0.702 ± 0.018 is substantially higher than those of other studies; the reasons for this difference are not clear.
- 3.We have reported [O/H] = +0.440 ± 0.020, using the turnoff stars only, and noting that use of a differential analysis for the range of gravities of these stars may have introduced a systematic error of dex (that is, raising the abundance). Our value is 0.16 dex higher than that of C07, which was based on a sample of 4 red clump stars, but may be within the errors when differences between our analysis and theirs are taken into account.
- 4.The [O/H] of NGC 6253 differs from those of other OCs of similar age, indicating that it may be inappropriate to place it in the context of the chemical evolution of the local disk. However, our scaled-solar [O/Fe] for NGC 6253 and the reported [O/Fe] values for NGC 6791 (all but one of which are within ±0.1 dex of scaled-solar) are consistent with an apparent flattening of the [O/Fe] versus [Fe/H] relationship that might occur at high metallicity. This possibility is suggested by disk star abundance samples, at least some of which exhibit a clear "floor" at [O/Fe] or for [Fe/H] > 0. This possibility is also consistent with some chemical evolution model results, which may show a gradual flattening of the [O/Fe] versus [Fe/H] relationship for [Fe/H] . Such a flattening could be the result of decreasing Fe yields from SNe Ia with increasing metallicity for [Fe/H] > 0, as predicted by some theoretical supernova yield calculations. The magnitude and cause of this possible metallicity dependence are not yet completely clear. Unfortunately, the paucity of reported abundances at high metallicity and the lack of chemical evolution models and theoretical supernova yields for substantially super-solar metallicity make our interpretation speculative.
- 5.We have compared the abundance patterns of Fe, Al, Si, and Ni for all three known super-metal-rich OCs, namely NGC 6791, NGC 6253, and NGC 6583. In summary, we find that they are similar to each other, they are similar to extrapolations of patterns seen in disk dwarfs and giants, and they are generally close to scaled-solar. In addition, a comparison between these clusters and the bulge stars of F07 show more differences than similarities. We have discussed the results of these comparisons in light of what is known of the space motions of these clusters. As discussed by Bedin et al. (2006), NGC 6791 has an eccentric orbit, which allows the possibility that it formed in the inner disk, where a super-high metallicity is possible even at early times, and then migrated outward, perhaps as a result of interaction with the central bar. Jilkova et al. (2012) investigated this possibility, and found that the probability of this scenario was non-zero, albeit very low. Unfortunately, no such potentially pleasing explanation is yet available for the other two much younger clusters, which have had much less time (especially NGC 6583) to migrate to their present locations, and which may have more circular orbits (M10). The origins of NGC 6523 and NGC 6583 remain perplexing.
- 6.We have re-examined C05's result that NGC 6583 is about 1 Gyr old, in view of the evidence from M10 that this cluster is super-metal-rich, and have also re-examined its distance from us and its position in the Galaxy. If the apparent MSTO, and two red giants (M10) are all cluster members, then it is difficult to see how NGC 6583 could be much older than ∼1 Gyr. We find the probable age to be 500–900 Myr. The most likely distance (from us) is 2–3 kpc.


The authors thank the staff at Cerro Tololo Inter-American Observatory for their invaluable assistance in obtaining the observations that form the basis of this study. The authors thank Lih Sin The for providing stellar evolutionary model results from the Clemson-Beirut code. The authors thank Imants Platais for insightful discussions. The authors thank the anonymous referee for helpful suggestions. R.M.M. acknowledges the Indiana Space Grant Consortium for support through a Graduate Fellowship. C.P.D. acknowledges support from the NSF through grants AST-0607567, AST-1009672 and AST-1211699. B.J.A.T. and B.A.T. are grateful to the Astronomy Department at Indiana University for hospitality during their Fall 2008 stay, and to the University of Kansas for sabbatical support; they also acknowledge support from the NSF through grant AST-1211621. J.R.K. acknowledges support for this work from NSF grants AST-0239518 and AST-0908342.
APPENDIX: AGE AND DISTANCE OF NGC 6583
The origin of the super-metal-rich (M10) cluster NGC 6583 is incompatible with current understanding of the Milky Way's ability to produce such a high metallicity if the cluster is as young as 1 Gyr (C05) and stays at  = 5.9–6.8 kpc as it orbits the Milky Way (M10; see Section 4.4). It is thus of interest to re-examine the cluster's age, especially in view of the new information, provided by M10, that the cluster is super-metal-rich; could the cluster be substantially older? Below, we will refer to this as the cluster youth problem.
Having no independent information available about relevant parameters such as cluster reddening, C05 determined a turnoff age of ∼1 Gyr. This age was based solely on the high quality of the fit of Padova isochrones (Girardi et al. 2000) to their VI photometry for main sequence, turnoff, and evolved stars (see their Figure A1). This fit also resulted in  ,
,  , and solar metallicity.
A number of factors can influence the values obtained, including, for example, the specific physical assumptions in the models that produce the isochrones, and the color-Teff calibration(s), both of which affect the shape of the isochrones and their location in the CMD. These factors cause systematic differences between different sets of isochrones; therefore, the "best-looking" fit does not necessarily provide the most reliable results. Another relevant factor is the manner in which the data are compared to the isochrones: it is rare to get a good fit to all parts of the CMD simultaneously, so the choice of the CMD-region(s) that is(are) given the most weight will affect the values derived. Different regions may have different advantages and disadvantages. For example, small numbers of stars at the turnoff may be problematic (but then even smaller numbers of more evolved stars can also be a problem), as are uncertainties about membership, binarity, and rapid rotation. The last two of these can move stars off of the single star fiducial sequence. Finally, it is ideal when parameters such as reddening, [Fe/H], and [α/Fe] can be determined independently (and reliably) and the values are then assumed as given in the isochrone fits. We address some of these issues in turn.
A.1. Importance of the Turnoff
By using data only from the inner 2' (diameter) of the cluster, C05 were hoping to minimize non-member contamination, and tried to fit the turnoff and giants simultaneously. Their Figure A1 shows that the giants were indeed fit well. But, one could argue that a ∼1 Gyr old cluster should have very few if any stars at the turnoff right above the radiative contraction portion of the isochrone at the hook of the turnoff (see, for example, the Hyades fits in Perryman et al. 1998, hereafter P98). Thus, the isochrone they chose may be too faint at the turnoff. Note also that there is no obvious gap in the CMD morphology near the turnoff that would correspond to this rapidly evolving phase. Although, such gaps can be difficult to identify in poorly populated clusters, especially with binaries shifting fainter stars to above the gap, and additionally with field star contamination; see, e.g., the case of NGC 5822 (Carraro et al. 2011) for a similarly aged cluster, but with solar metallicity. If instead one fits the turnoff in a manner similar to that of P98, keeping the radiative portion of the isochrone above the observed stars by choosing a younger isochrone, then NGC 6583 youth problem is compounded further.
A.2. Importance of the Metallicity
M10 obtained spectra for 4 giants in the central 2' region. They found two (stars 46 and 62) to have similar RVs and considered them to be members (red disks in Figure A1 ). Perhaps surprisingly, the other two (stars 12 and 82) had different RVs, and M10 considered them to be non-members (red disks with X's in Figure A1). Temperatures for the two members were determined from ionization balance, which implied an upward revision of the C05 reddening by AV = 0.60, and abundances of several elements were derived. Strikingly, the two members showed a super-metal-rich (average) abundance of [Fe/H] = +0.37 ± 0.03 (where the error is σ).

Figure A1. Various isochrone fits to the C05 VI photometry of NGC 6583; shown are values of  that would be derived from
  using Cardelli et al. (1989). In all cases, [Fe/H] = +0.37 and scaled-solar α-element abundances have been assumed. (a) Isochrones that have been fit to the left edge of the main sequence near
  17.5 to 18.5, assuming
  ; these yield
  . (b) Isochrones that fit the MS almost (but not quite) as well, assuming an increased reddening of
  . (c) and (d) Isochrone fits assuming
  and 0.94, respectively.
Download figure:
Standard image High-resolution image
C05 indicate that metal-poor and metal-rich isochrones did not fit as well as the solar-metallicity ones they used. Given the M10 result of super-metal-rich abundances, this underscores the uncertainties associated with trusting results from quality of fit alone (although C05 had no other choice at the time). Figure A2
shows Yale-Yonsei isochrones (Yi et al. 2003) with Green color calibration for solar metallicity (dashed lines) versus [Fe/H] = +0.37 (and scaled-solar α-element abundances, solid lines) at ages 500 Myr (upper) and 1 Gyr (lower). The systematic difference in  is 0.35 mag, as for example evaluated near
  (Figure A1), with the solar metallicity isochrone being fainter. This places the cluster approximately 17% farther away than the 2.1 kpc determined by C05 and assumed by M10. Although this is closer to the Galactic center, it is still quite a long way from the
  3 to 5 kpc range in which super-high metallicities can be produced. Also, for a given reddening, Figure A2 shows that the high-metallicity isochrones imply a younger age (by roughly 20% near 1 Gyr), exacerbating the cluster youth problem. On the other hand, the shapes of the isochrones are not drastically different, so in the absence of a good reddening, quality of fit alone would result in an age closer to 1 Gyr. Below, we will adopt M10's [Fe/H] = +0.37 (and scaled-solar alpha abundances) for our isochrones.
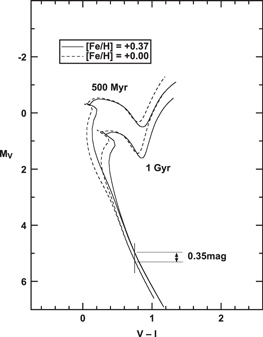
Figure A2. Yale-Yonsei isochrones with Green–color calibration for solar metallicity (dashed lines) vs. [Fe/H] = +0.37 (and scaled-solar α-element abundances, solid lines) at ages 500 Myr (upper) and 1 Gyr (lower).
Download figure:
Standard image High-resolution image
A.3. Importance of Membership
The photometry of C05 does suggest that in the inner 2', the majority of the bluer stars from V = 13.5 down to about as faint as V = 19 are consistent with a cluster main sequence; fainter than that, the main sequence gets lost.
The photometry might also suggest that in the inner 2', a high percentage of stars that seem to be photometric member giants should, in fact, be members. M10's conclusion that two of four stars observed spectroscopically are non-members is thus rather distressing, and brings into question what role the remaining giants should play, if any, in fitting isochrones to the photometry. In particular, what role should the three stars fainter than the two members (open circles, near  in Figure A1) and the star cooler than the two members (with V,
  near 14.6, 1.8) play? What if 50% of these four stars are also non-members? These are small number statistics, and so M10's conclusions cannot necessarily be extended to the other four stars in question. Nonetheless, the membership of these four is uncertain. We have thus attempted to find a good isochrone fit primarily in the turnoff region and the visible MS, and have used the two M10 member giants (and none of the other giants) only as a check. Note that M10 considered the two member giants as having evolved past the red clump, on their way to the AGB.
We should point out the possibility that the two M10 non-members may, in fact, be member binaries. If the secondary were to contribute a negligible flux to the spectrum (which can be checked in the spectra using, for example, IRAF's fxcor), then reliable effective temperatures and abundances could be determined for the primaries. If a super-metal-rich [Fe/H] comparable to the two M10 members was found for either of the M10 non-members, it would nearly certainly imply membership. This could be checked further from the reddening inferred from the derived Teff. M10 made no comment on these possibilities. If we knew that one or both of these stars was a member (even a binary or multiple member), it might lend confidence to placing greater importance on more of the giants in order to find isochrone fits.
A.4. Importance of Reddening
We begin by assuming C05's value of  . If we use the reddening relations of Cardelli et al. (1989) instead of the relation of Dean et al. (1978) used by C05, we find
  instead of the value 0.51 found by C05. Figure A1 shows the
  values that would be derived using the Cardelli et al. (1989) relations. Figure A1(a) shows isochrones that have been well-fit to the left edge of the main sequence near
  17.5–18.5, using
  . The 900 Myr isochrone follows most of the kink in the turnoff region rather well, but is arguably slightly too faint at the top of the turnoff (the C05 fit was even fainter). As argued above, the radiative contraction portion of the turnoff should be above any observed stars. Furthermore, one of the M10 members is slightly too red. This could, for example, be an issue for the color calibration at the red end; nonetheless, we will continue to consider the isochrones at face value.
These two problems can potentially be improved upon by using a younger isochrone (thereby exacerbating the cluster youth problem) which has a relatively brighter turnoff and also a wider subgiant (Hertzsprung gap) region. The reddening and distance modulus must then also be adjusted to make a good fit possible. Figure A1(b) shows isochrones that fit the MS almost (but not quite) as well, using an increased reddening of  and a distance modulus of
  . The 500 Myr isochrone allows the M10 members to be located blue-ward of the isochrone. However, this isochrone's turnoff is not quite as bright as in an ideal fit and is arguably slightly too blue in the turnoff region. Overall, this is at best only a marginally better fit than the first one from Figure A1(a). It is noteworthy that a higher reddening is perhaps desirable on the basis of the ionization balance arguments of M10. However, M10's suggestion of
  results in even higher reddening values.
There is some ambiguity as to how high a reddening  implies. M10 indicate that
  is relative to the reddening shown in their Table 1, which is
  , quoted from C05. However, C05 inferred reddening from their
  fits, and calculated
  using the Dean et al. (1978) relation. So is M10's
  dependent on C05's directly determined
  , or is it somehow dependent on
  ? If we take
  from C05 and calculate
  using Cardelli et al. (1989), which is arguably to be preferred over Dean et al. (1978), we find
  . We shall consider both possibilities,
  and 0.44.
Considering the more extreme case first, and using the standard relation  , we find
  and
and  , using Cardelli et al. (1989). Figure A1(c) shows an approximate fit to the main sequence. The 200 Myr isochrone fits the turnoff best, but is still slightly too faint at the turnoff, and is much too red relative to the M10 members. In the context of this and the 300 Myr isochrones these stars would be interpreted as Hertzsprung gap stars, which is very unlikely, and contradicts the gravities determined by M10. The 100 Myr isochrone is marginally bright enough at the turnoff, but is also a bit too blue at the turnoff, and is located in a very strange place relative to the M10 members. This is clearly the worst fit considered so far.
If we instead consider  = 0.44 + 0.22 = 0.66 and
  (Cardelli et al. 1989), we get only slightly better results. Figure A1(d) shows isochrones that fit the main sequence. The 300 Myr isochrone follows the turnoff fairly well, but is again too faint at the top of the turnoff, and is too red relative to the M10 members, though not as badly as for the previous case.
To summarize, none of the fits match all the features of the observed CMD in an ideal manner. The first two fits (Figures A1(a) and (b)) are clearly superior to the latter two (Figures A1(c) and (d)), suggesting a likely age range of 500–900 Myr, which exacerbates the cluster youth problem. The higher reddening of Figure A1(b) is certainly viable, though the fit is not clearly preferable to that of Figure A1(a) and the reddening is not nearly as high as suggested by M10; the interval in reddening between Figures A1(a) and (b) is  = 0.63–0.79 (or
  = 0.44–0.55 using Cardelli et al. 1989).
A.5. Importance of Distance
In going from panels (a)–(d) in Figure A1, the fitted  increases from 13.3 to 14.1 to 15.5 and then decreases to 15.1, which correspond to distances of 2.4, 3.0, 4.4, and 4.1 kpc. These increasing distances (from us) are mostly in the direction of the Galactic center, thereby bringing the cluster closer to the regions
  3–5 pc where the Milky Way can produce super-high metallicities. However, the larger distances, which correspond to higher reddenings (see above), produce the most incompatible fits between the isochrones and the VI data of C05. The better fits of Figures A1(a) and (b) place the cluster at a distance of no more than 2–3 kpc from us, which lies outside the
  3–5 kpc range, and the cluster's youth gives it very little time to migrate outwards (see Figure 8). Note that the closer the cluster is to the Galactic center, the greater the reddening, and thus the younger the derived turnoff age (ignoring the discrepant M10 giant members), giving the cluster even less time to migrate outward. Admittedly, if the cluster is sufficiently far from us, then it lies within the super-high-metallicity producing region, and its youth becomes irrelevant.
A.6. Summary
C05 found that solar-metallicity isochrones fit their VI photometry for NGC 6583 better than isochrones of either lower or higher metallicity, and derived a cluster age of ∼1 Gyr. But M10 found that the cluster is super-metal-rich. We have fit isochrones with super-high-metallicity to C05's VI data to test whether an age older than ∼1 Gyr is possible, thereby possibly alleviating the cluster youth problem. Quite to the contrary, our better-fitting super-high-metallicity fits are all younger, in the 500 to 900 Myr range. They also imply a slightly higher reddening than found my C05, though not as high as that implied by M10's ionization-balance-derived Teff values. If the apparent main sequence stars and turnoff stars are all cluster members, and if the two M10 giants are also members, then it is difficult to see how the cluster could be much older than ∼1 Gyr. For example, the color range from the turnoff to the two giants would be much too small in older isochrones. These findings exacerbate the cluster youth problem. An even larger reddening could bring the cluster to the  3–5 kpc region capable of producing super-high metallicity. But, the corresponding isochrone fits would imply even younger ages, perhaps as low as 200–300 Myr or less, which are incompatible with the M10 (giant) members, unless those two stars are not, in fact, members.
It would be useful to obtain independent reddening estimates using techniques that are more sensitive to reddening (such as UBV photometry), and to obtain RVs of numerous turnoff and main sequence stars, allowing tests of a) the existence of the cluster, and b) whether these stars have the same RV as the two M10 members.
Footnotes
- 7
CTIO is operated by the Association of Universities for Research in Astronomy, under contract with the National Science Foundation.
- 8
IRAF is distributed by the National Optical Astronomy Observatories, which are operated by the Association of Universities for Research in Astronomy, Inc., under cooperative agreement with the National Science Foundation.
- 9
- 10