


ABSTRACT
An analysis of data from the Spitzer Space Telescope, Hubble Space Telescope, Chandra X-ray Observatory, and AKARI Infrared Astronomy Satellite is presented for the z = 0.036 merging galaxy system II Zw 096 (CGCG 448-020). Because II Zw 096 has an infrared luminosity of log(LIR/L☉) = 11.94, it is classified as a Luminous Infrared Galaxy (LIRG), and was observed as part of the Great Observatories All-sky LIRG Survey (GOALS). The Spitzer data suggest that 80% of the total infrared luminosity comes from an extremely compact, red source not associated with the nuclei of the merging galaxies. The Spitzer mid-infrared spectra indicate no high-ionization lines from a buried active galactic nucleus in this source. The strong detection of the 3.3 μm and 6.2 μm polycyclic aromatic hydrocarbon emission features in the AKARI and Spitzer spectra also implies that the energy source of II Zw 096 is a starburst. Based on Spitzer infrared imaging and AKARI near-infrared spectroscopy, the star formation rate is estimated to be 120 M☉ yr-1 and >45 M☉ yr-1, respectively. Finally, the high-resolution B-, I-, and H-band images show many star clusters in the interacting system. The colors of these clusters suggest at least two populations—one with an age of 1–5 Myr and one with an age of 20–500 Myr, reddened by 0–2 mag of visual extinction. The masses of these clusters span a range between 106 and 108 M☉. This starburst source is reminiscent of the extranuclear starburst seen in NGC 4038/9 (the Antennae Galaxies) and Arp 299 but approximately an order of magnitude more luminous than the Antennae. The source is remarkable in that the off-nuclear infrared luminosity dominates the entire system.
Export citation and abstract BibTeX RIS
1. INTRODUCTION
II Zw 096 (also known as CGCG 448-020 or IRAS 20550+1655) has an infrared luminosity of log(LIR/L☉) = 11.94 and a luminosity distance of 161 Mpc (Armus et al. 2009). Since its luminosity is above LIR ⩾ 1011 L☉, it is classified as a Luminous Infrared Galaxy, or LIRG. From its optical morphology, II Zw 096 appears to be a merger of at least two gas-rich spirals. From the optical imaging, Arribas et al. (2004) classify II Zw 096 as a Class III interacting galaxy, based on the system of Surace (1998), meaning the galaxy has two identifiable nuclei, with well-developed tidal tails.
With near-infrared imaging and spectroscopy, Goldader et al. (1997) uncovered two extremely red sources to the east of the merging disks that appeared to mark the location of a highly obscured, young starburst. These authors suggest that II Zw 096 is one of a handful of LIRGs (such as Arp 299 and VV 114) that are experiencing enhanced star formation before the final dissipative collapse of the system. While II Zw 096 has previously been observed spectroscopically in the mid-infrared (Dudley 1999), the ground-based data were not of high enough signal-to-noise to permit the detection of polycyclic aromatic hydrocarbons (PAH) or fine-structure lines. It is also known that II Zw 096 hosts an OH megamaser at the B1950 position of R.A. = 20 55
55 05
05 3, decl. = +16°56'03'' (Baan 1989). Baan et al. (1998) and Baan & Klöckner (2006) classified this megamaser as a starburst using the optical line ratios and the radio data.
As part of the Great Observatories All-sky LIRG Survey (GOALS, http://goals.ipac.caltech.edu), we have obtained images and spectra with the Spitzer Space Telescope, the Hubble Space Telescope (HST), the Chandra X-ray Observatory, and the Galaxy Evolution Explorer (GALEX) of a complete sample of LIRGs in the local universe. The GOALS targets consist of all LIRGs found in the IRAS Revised Bright Galaxy Sample (RBGS; Sanders et al. 2003), which covers galactic latitudes greater than 5 deg and includes 629 extragalactic objects with 60 μm flux densities greater than 5.24 Jy. The median and the maximum redshift of the IRAS RBGS are z = 0.008 and 0.088, respectively. The GOALS sample includes 179 LIRGs and 23 Ultra-Luminous Infrared Galaxies (ULIRGs, LIR ⩾ 1012 L☉), covering the full range of galaxy interaction stages from isolated spirals to late-stage mergers. GOALS provides an excellent data set with which to explore the effect of mergers on infrared activity at low redshift. A critical part of the GOALS survey has been to use the Spitzer Space Telescope to identify the location of the infrared emission within LIRGs, and to characterize the source of the power. The GOALS project is fully described in Armus et al. (2009).
Here, we present the first mid- and far-infrared imaging and spectroscopy of II Zw 096 from Spitzer, together with an analysis of the far-ultraviolet (FUV) and optical imaging (HST), X-ray imaging (Chandra), and near-infrared spectra (AKARI). In Section 2 we describe the observations and data reduction; in Section 3 we present our results, identifying the location of the bulk of the far-infrared emission; and in Section 4 we discuss the nature of this buried power source. Cosmological parameters H0 = 70 km s-1 Mpc−1, Ωm = 0.28, and ΩΛ = 0.72 are used throughout this paper.
2. OBSERVATIONS AND DATA REDUCTION
2.1. Spitzer Imaging
Spitzer observations of II Zw 096 were taken with the Infrared Array Camera (IRAC; Fazio et al. 2004) at 3.6 μm, 4.5 μm, 5.8 μm, and 8.0 μm on 2004 October 29 and the Multiband Imaging Photometer for Spitzer (MIPS; Rieke et al. 2004) at 24 μm, 70 μm, and 160 μm on 2004 November 30 (PID 3672; PI: J. Mazzarella). All IRAC data were collected with five frames of 30 s high dynamic range (HDR) mode. The 8.0 μm data saturated the 30 s integrations, so only the short 1.2 s frames were used. Total exposure times were 150 s at 3.6 μm, 4.5 μm, and 5.8 μm and 6 s at 8.0 μm. The MIPS images were taken in photometry mode, using super-resolution at 70 μm. Sixteen images of 3 s each were obtained. The total exposure times were 48.2 s, 37.7 s, and 25.2 s for 24 μm, 70 μm, and 160 μm, respectively. A summary of the Spitzer observations is given in Table 1.
Table 1. Spitzer, Hubble, Chandra, and AKARI Observations of II Zw 096
| Observatory | Instrument | Filter or Module | Integration Time (s) | Observation Date |
|---|---|---|---|---|
| IRAC | 3.6 μm | 150 | 2004 Oct 29 | |
| 4.5 μm | 150 | |||
| 5.8 μm | 150 | |||
| Spitzer | 8.0 μm | 6 | ||
| MIPS | 24 μm | 48.2 | 2004 Nov 30 | |
| 70 μm | 37.7 | |||
| 160 μm | 25.2 | |||
| IRS | SL | 6 × 14a | 2006 Nov 12 | |
| LL | 4 × 14a | |||
| SH | 6 × 30a | |||
| LH | 4 × 60a | |||
| ACS/SBC | F140LP | 2528 | 2008 May 1 | |
| ACS/WFC | F435W | 2520 | 2006 Apr 15 | |
| HST | F814W | 1440 | ||
| NICMOS/NIC2 | F160W | 2304 | 2008 Jun 1 | |
| Chandra | ACIS | 0.5–7 keV | 14.56 × 10³ | 2007 Sep 10 |
| AKARI | IRC | NG with Np | 799 | 2009 May 12 and 13 |
Note. aNumber of cycles × integration time in each nod position.
Download table as: ASCIITypeset image
We used the MOPEX21 software package to process the IRAC and the MIPS images, correcting the background, aligning, resampling the images, removing bad pixels, combining into mosaics, and clipping cosmic-ray events. Final mosaics were constructed with a pixel size of 0 6 pixel−1 for the IRAC images, 18 pixel−1 at 24 μm, 40 pixel−1 at 70 μm, and 80 pixel−1 at 160 μm for the MIPS images.
The World Coordinate System of the images is limited to ∼04 by the telescope pointing accuracy. However, alignment of the IRAC images has been refined with the Two Micron All Sky Survey (2MASS) to achieve a final accuracy (⩽03). For the MIPS images, the positional error is approximately 07 based on the startracker-to-boresight uncertainty and the MIPS scan mirror uncertainty (M. Lacy et al. 2010, in preparation). A pointing refinement with 2MASS cannot be done because of the large wavelength difference between the MIPS and 2MASS bands.
All photometric fluxes were derived using the IDL APER routine. For the IRAC images, we used 14 and 29 radii circular apertures, using the aperture corrections from Surace et al. (2004). For the MIPS images, we fit the point-spread function (PSF) to the peak of emission to estimate total flux.
2.2. HST
The HST FUV and optical images were obtained with the Solar Blind Channel (SBC) and the Wide Field Camera (WFC) on the Advanced Camera for Surveys (ACS) on 2008 May 1 (PID 11196; PI: A. Evans) and 2006 April 15 (PID 10592; PI: A. Evans), respectively. The data were taken in the ACCUM mode using the LINE dither pattern for the WFC and the PARALLELOGRAM dither pattern for the SBC. The near-infrared images were taken using the NIC2 camera on the Near-Infrared Camera and Multi-Object Spectrometer (NICMOS) with the MULTIACCUM mode and the SPIRAL dither pattern on 2008 June 1 (PID 11235; PI: J. Surace). The following filters were used: ACS/SBC F140LP (FUV), ACS/WFC F435W (B band), F814W (I band), and NICMOS/NIC2 F160W (H band) for 2528, 2520, 1440, and 2304 s, respectively. We summarize the HST imaging observations in Table 1.
The HST data reduction began with the calibrated data products produced by STScI. The ACS data were reduced with the PyDrizzle software included in IRAF/STSDAS provided by STScI, to identify and reject cosmic rays and bad pixels, to remove geometric distortion, and to combine the images into mosaics. The NICMOS images were reduced using IRAF and IDL tasks designed to remove cosmic rays and bad pixels, and correct for the different bias levels across the quadrants due to the four amplifiers. The alignments of the HST images were improved based on the 2MASS astrometric solution. IRAF was used to construct the final mosaic, and the IDL routine APER was used to measure the photometry. An aperture size of 025, with corresponding aperture corrections of 1.18, 1.16, 1.16, and 1.39, were used for photometric measurements of point sources in the final ACS/SBC F140LP, ACS/WFC F435W, F814W, and NICMOS F160W images, respectively.
2.3. Chandra
X-ray observations of II Zw 096 were obtained with the AXAF CCD Imaging Spectrometer (ACIS) on the Chandra X-ray Observatory with VFAINT mode on 2007 September 10 (PID 8700551; PI: D. Sanders). The background counts for total integration times 14.56 ks are 0.0025 counts pixel−1 and 0.004 counts pixel−1 in the soft (0.5–2 keV) and the hard (2–7 keV) bands, respectively. The 5σ depths of the images are 1 × 10⁻¹⁵ erg s-1 cm−2 in the soft band and 5 × 10⁻¹⁵ erg s-1 cm−2 in the hard band. The fundamental data reduction was done by the Chandra data analysis software CIAO version 3.4 and we have verified that there are no anomalous objects left in the data. Then we selected soft (0.5–2 keV) and hard (2–7 keV) X-ray energy ranges for making images and smoothed the data using a Gaussian filter with a σ of 1.5 pixels (FWHM ∼18).
2.4. Spitzer IRS Spectra
II Zw 096 was observed with all modules of the Spitzer Infrared Spectrograph (IRS; Houck et al. 2004) in staring mode on 2006 November 12 (PID 30323; PI: L. Armus). The slits were centered on the peak of the 8 μm emission. The slit positions for all four modules are overlaid on the IRAC 8 μm image in Figure 1. The number of nod cycles and the integration time in each nod position are listed in Table 1.

Figure 1. Spitzer IRAC and MIPS images of II Zw 096. From upper left to lower right, these are (a) 3.6 μm, (b) 4.5 μm, (c) 5.8 μm, (d) 8 μm, (e) 24 μm, and (f) 70 μm. In all frames, north is up and east is to the left. Sources A, B, C, and D in II Zw 096 are labeled in the 3.6 μm image, using the same nomenclature as in Goldader et al. (1997). The origin of both axes in each panel corresponds to the position of source D at R.A. = 20 57
57 2434, decl. = +17°07'39 1'' (J2000). The contour levels of the 3.6 μm, 4.5 μm, 5.8 μm, 8.0 μm, 24 μm, and 70 μm images start at 6.0, 9.0, 24, 55, 180, and 100 MJy sr-1, respectively, and increment with a step factor of 2. The four IRS slits are overlayed on the IRAC 8 μm image in (d). The blue solid, red dashed, orange dotted, and green dashed dotted boxes indicate SL, SH, LH, and LL, respectively. Spectra extracted from the SL and SH slits are from the peak emission only (source C+D), not from the entire slit, as they are for the LL and LH slits—see the text for details.
Download figure:
Standard image High-resolution imageThe data were reduced using the S15.3 IRS pipeline at the Spitzer Science Center. The pipeline software removes bad pixels and droop, subtracts the background, corrects linearity, and performs a wavelength and flux calibration. The backgrounds were subtracted with dedicated sky observations for the high-resolution data, and with off-source nods for the low-resolution data. One-dimensional spectra were extracted with the SPICE22 software package, using the standard point-source extraction apertures for all slits. For the high-res slits, this is equivalent to a full-slit extraction. The slit widths of Short-Low (SL), Long-Low (LL), Short-High (SH), and Long-High (LH) are 36, 105, 47, and 111, respectively. The extraction size for SL is 95, LL is 383, SH is 117, and LH is 228.
2.5. AKARI Near-infrared Spectra
The near-infrared spectra of II Zw 096 were taken with AKARI on 2009 May 12 and 13 (PID GOALS; PI: H. Inami) during the post-helium (warm phase) mission using the Infrared Camera (IRC; Onaka et al. 2007). The 2.5–5 μm spectra were obtained using the 1' × 1' aperture (the Np aperture) using a moderate-resolution grism. The spectral resolving power is ∼120 at 3.5 μm for a point-like source (∼5'' FWHM). The use of the Np aperture is intended to avoid the confusion of spectra but multiple sources in this aperture may interfere each other (see Section 3.5). The observations used the IRCZ4 Astronomical Observation Template, taking four spectra, a reference image, and then five spectra at the end of the sequence. The exposure time for each spectrum was 44.41 s. Two pointings were used (in total 2 pointings × 9 frames) for the observations and the total exposure time was 799 s.
The data reduction was performed with the standard software package provided by JAXA, the IRC Spectroscopy Toolkit for Phase 3 data Version 20090211.23 This software performs dark subtraction, linearity correction, flat correction, background subtraction, wavelength calibration, spectral inclination correction, and spectral response calibration. We extracted the one-dimensional spectra from the two-dimensional spectral image using an aperture 3 pixels wide (44). The number of bad pixels is increasing dramatically in the post-helium mission due to the elevated detector temperatures. A 3 × 3 moving window was used to isolate and replace bad pixels in each spectral image before co-adding the data and extracting the one-dimensional spectrum. The wavelength accuracy is evaluated to be 0.01 μm and the uncertainty in absolute flux calibration is estimated to be ∼10% (Ohyama et al. 2007).
3. RESULTS
3.1. Spitzer Imaging
In Figure 1, the Spitzer images from IRAC 3.6 μm through MIPS 70 μm are presented in order of increasing wavelength. Three distinct objects are seen in the IRAC data. The nuclei of the merging galaxies are to the north (source B) and south (source A; Goldader et al. 1997). In addition, there is a bright, red source to the east (sources C and D), which is resolved and elongated at an angle of roughly 60°. This resolved IRAC source is coincident with the near-infrared sources "C" (R.A. = 20 57
57 2447, decl. = +17°07'39 9'') and "D" (R.A. = 20
 57
57 2434, decl. = +17°07'39 1'') from Goldader et al. (1997). We estimate the flux density of source D at 3.6 μm, 4.5 μm, 5.8 μm, and 8.0 μm, as 2.85 ± 0.08, 4.67 ± 0.13, 12.7 ± 0.2, and 41.9 ± 0.8 mJy, respectively, using a circular aperture size of 14 radius.
The MIPS 24 μm image shows a strong point source coincident with the position of source D, along with a lot of emission to the southwest, coincident with source A. Although the MIPS 70 μm image is unresolved, the position of the peak is consistent with source D. PSF fitting to source D at 24 μm and 70 μm suggests that it produces 67.2% ± 10.6% (1.37 ± 0.18 Jy) and 87.9% ± 13.8% (10.2 ± 1.2 Jy) of the total galaxy flux at 24 μm and 70 μm, respectively. The angular separation of sources C and D is ∼20 (see Figure 2 or 4). Although this small separation cannot be resolved with MIPS, the centroid of source D can be determined much more accurately than the FWHM of the beam. In addition, we have simulated the MIPS image using two point sources separated by 20, determining that a flux ratio of 4:1 (D:C) is required to match the data. The photometry is summarized in Table 2.

Figure 2. HST/ACS and SBC F140LP, F435W, F814W, and NICMOS F160W gray-scale images of II Zw 096 with Spitzer MIPS 24 μm contours overlaid. The source of the prodigious far-infrared emission is mostly invisible in the optical and UV. The labels ΔR.A. = 0 and Δdecl. = 0 indicate the coordinate of source D (R.A. = 20 57
57 2434, decl. = +17°07'39 1'').
Download figure:
Standard image High-resolution imageTable 2. Spitzer, HST, and Chandra Photometries of II Zw 096
| Observatory | Instrument | Filter or Module | Source A | Source C | Source D |
|---|---|---|---|---|---|
20 57 57 2409, +17°07'35 3'' 2409, +17°07'35 3'' |
20 57 57 2447, +17°07'39 9'' 2447, +17°07'39 9'' |
20 57 57 2434, +17°07'39 1'' 2434, +17°07'39 1'' |
|||
| Spitzer | IRAC | 3.6 μm | 3.29 ± 0.10 (29) |
2.26 ± 0.08 (14) |
2.85 ± 0.08 (14) |
| 4.5 μm | 2.68 ± 0.08 (29) |
3.33 ± 0.08 (14) |
4.67 ± 0.13 (14) |
||
| 5.8 μm | 8.43 ± 0.18 (29) |
9.36 ± 0.22 (14) |
12.7 ± 0.2 (14) |
||
| 8.0 μm | 28.1 ± 0.5 (29) |
27.2 ± 0.4 (14) |
41.9 ± 0.8 (14) |
||
| MIPS | 24 μm | ... | ... | 1.37 ± 0.18a | |
| 70 μm | ... | ... | 10.2 ± 1.2a | ||
| 160 μm | ... | ... | ... | ||
| ACS/SBC | F140LP | (6.59 ± 0.30) × 10−15 (29) |
... | ... | |
| HST | ACS/WFC | F435W | (3.03 ± 0.02) × 10−15 (29) |
... | (3.43 ± 0.34) × 10−17 (14) |
| (4.63 ± 0.67) × 10−18 (025) |
|||||
| F814W | (1.28 ± 0.01) × 10−15 (29) |
(5.57 ± 0.19) × 10−17 (14) |
(4.85 ± 0.20) × 10−17 (14) |
||
| (4.64 ± 0.39) × 10−18 (025) |
(2.85 ± 0.08) × 10−17 (025) |
||||
| NICMOS/NIC2 | F160W | 5.36 ± 0.05 (29) |
0.85 ± 0.02 (14) |
0.74 ± 0.02 (14) |
|
| 0.13 ± 0.01 (025) |
0.24 ± 0.01 (025) |
||||
| Chandra | ACIS | 0.5–2 keV | 6.6 × 1040 | 1.8 × 1040 (Source C+D) | |
| 2–7 keV | 1 × 1041 | 1 × 1041 (Source C+D) | |||
Notes. The values in the brackets are the circular aperture sizes in radii. The units are mJy for IRAC and NICMOS/NIC2, Jy for MIPS, erg s-1 cm−2 A−1 for ACS/SBC and ACS/WFC, and erg s-1 for ACIS. aMeasured by the PSF fitting (see Section 3.1).
Download table as: ASCIITypeset image
We estimate the total infrared (TIR, 3–1100 μm) luminosity of source D to be TIR = 5.85 × 10¹¹ L☉ from the Spitzer 24 and 70 μm images, using Equation (4) in Dale & Helou (2002), assuming that the 160 μm flux of source D is 87.9% of the total at 70 μm. This is approximately 80% of the TIR of the system. II Zw 096 has an infrared luminosity (LIR, 8–1000 μm) of 1011.94 L☉ (Armus et al. 2009). Assuming source D accounts for ∼80% of the total LIR of the system (the same fraction as TIR), we estimate an LIR of 6.87 × 10¹¹ L☉.
3.2. HST Imaging
HST/ACS and NICMOS images of II Zw 096 are shown in Figure 2, from the upper left to the lower right, ACS/SBC F140LP (FUV), ACS/WFC F435W (B band), F814W (I band), and NICMOS/NIC2 F160W (H band). The contours of the Spitzer 24 μm image are overlaid in each panel.
The I-band and the H-band images with the 24 μm contour overlayed in Figure 2 suggest that source D is the origin of the bulk of the far-infrared emission in II Zw 096. The contour of the MIPS 70 μm image is also consistent with the position of source D.
The HST NICMOS images resolve the structure of the red sources into at least 10 "knots" (see Figure 3). Most of these knots are not seen in the visible image due to heavy extinction. In the H band, the absolute magnitudes of sources C and D are MH = −18.7 ± 0.1 mag and −19.5 ± 0.1 mag, respectively, measured with a 025 radius aperture. We estimate that approximately 0.81% ± 0.04% and 1.62% ± 0.06% of the H-band flux of the entire system comes from sources C and D alone. Sources C and D provide about 7.78% ± 0.39% and 15.5% ± 0.6% of the H-band emission for the red complex in Figure 3, respectively.

Figure 3. Close-up of the NICMOS image, identifying the red sources designated as "C" and "D" by Goldader et al. (1997). The new HST data reveal not only a large number of young, blue clusters, but also the true, complex nature of the buried starburst.
Download figure:
Standard image High-resolution imageIn Figure 4, we show a false-color RGB image of II Zw 096 made from the NICMOS H band, ACS B band, and ACS FUV images. The extremely red sources C and D are obvious in this figure, as are a number of unresolved blue sources to the west. These are presumably young star clusters in the northern spiral arm of the western galaxy and the overlap region.

Figure 4. False-color RGB image of II Zw 096 made by combining the HST ACS SBC F140LP (blue), ACS F435W (green), and NICMOS F160W (red) images.
Download figure:
Standard image High-resolution image3.3. Chandra Imaging
The Chandra X-ray images are shown in Figure 5. In the full (0.5–7 keV) and soft (0.5–2 keV) bands, source A dominates the emission. In the hard-band (2–7 keV) image, sources C and D become much more prominent. The 0.5–2 keV luminosities of source A and source C+D complex are 6.6 × 1040 erg s-1 and 1.8 × 1040 erg s-1, respectively. In the hard band, the 2–7 keV luminosity of source A is 1 × 1041 erg s-1 and the total of sources C and D is 1 × 1041 erg s-1.
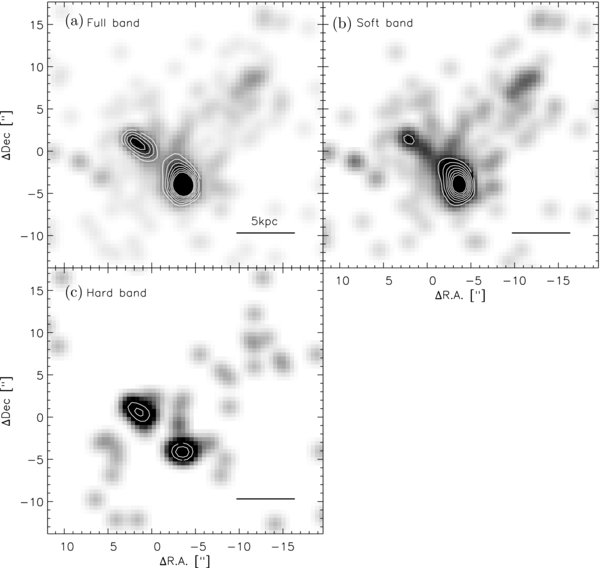
Figure 5. Chandra (a) full band (0.5–7 keV), (b) soft X-ray (0.5–2 keV), and (c) hard X-ray (2–7 keV) images. The contour levels of all of the images start at 0.3 with a step of 0.2. The labels ΔR.A. = 0 and Δdecl. = 0 indicate the coordinate of source D (R.A. = 20 57
57 2434, decl. = +17°07'39 1'').
Download figure:
Standard image High-resolution imageThe C+D complex is clearly extended (see Figure 5). Source C dominates the soft-band emission from the complex, with the fraction of the X-ray emission coming from source D apparently rising toward the hard band. This is evidenced by a gradual shifting of the peak from NE to SW in Figure 5. However, given the low number of total counts (∼20) from this region and the strong overlap of source C and D, it is difficult to derive an independent measure of the hardness ratio of C and D, separately. Together, the hardness ratio (Hard − Soft/Hard + Soft) of source C+D is 0.05 ± 0.14.
3.4. Spitzer IRS Spectroscopy
The Spitzer IRS SL, LL, SH, and LH spectra of sources C and D (C+D) are shown in Figure 6, and the fluxes of the detected lines are shown in Tables 3 and 4. Note that the LL and LH spectra cover not only source C+D but also source A due to their limited resolutions (see Figure 1(d)). However, the scale factor of LL/SL is 1.09, indicating the continuum is dominated by source C+D only. The IRS low-resolution spectra are dominated by strong PAH emission and silicate absorption. The high-resolution data show strong fine-structure line emissions such as [Ne iii], [Ne ii], and [S iii].
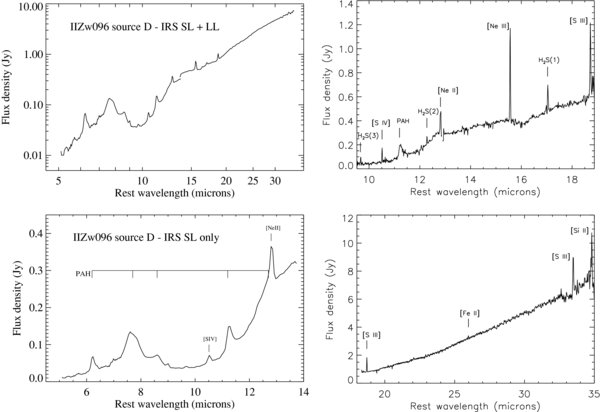
Figure 6. Spitzer IRS spectra of source D (see Figure 3). The full low-resolution spectrum is at the top left, while a close-up of the SL spectrum is shown at the bottom left. The SH and LH spectra are shown at the top right and the bottom right, respectively. Some residual order tilting is evident in the two reddest orders of LH. All spectra are shown in the rest frame.
Download figure:
Standard image High-resolution imageTable 3. Fine-structure and Molecular Lines
| Line | Wavelength (μm) | Flux (×10−16 W m-2) |
|---|---|---|
| Brα | 4.050 | 0.50 ± 0.05 |
| H2 S(3) | 9.660 | 0.45 ± 0.05 |
| [S iv] | 10.511 | 0.72 ± 0.04 |
| H2 S(2) | 12.279 | 0.29 ± 0.03 |
| [Ne ii] | 12.814 | 2.74 ± 0.47 |
| [Ne v] | 14.322 | <0.10a |
| [Ne iii] | 15.555 | 2.79 ± 0.03 |
| H2 S(1) | 17.035 | 0.73 ± 0.05 |
| [S iii] | 18.713 | 2.16 ± 0.22 (SH) |
| [S iii] | 18.713 | 3.27 ± 0.04 (LH) |
| [O iv] | 25.890 | <0.29a |
| [Fe ii] | 25.988 | 0.56 ± 0.22 |
| [S iii] | 33.481 | 4.77 ± 0.07 |
| [Si ii] | 34.815 | 4.23 ± 0.12 |
Notes. The LH spectra cover not only source C+D but also source A (see the text for detail). a3σ upper limit.
Download table as: ASCIITypeset image
Table 4. PAH Features
| Wavelength (μm) | Flux (×10−16 W m-2) | EQW (μm) |
|---|---|---|
| 3.3a | 2.37 ± 0.14 | 0.14 |
| 6.2b | 5.57 ± 0.19 | 0.26 |
| 11.2b | 3.24 ± 0.32 | 0.14 |
| 6.2 | 14.11 ± 0.35 | 1.30 |
| 7.7 complex | 83.57 ± 1.14 | 7.61 |
| 8.3 | 4.55 ± 0.44 | 0.35 |
| 8.6 | 12.86 ± 0.37 | 0.99 |
| 11.3 complex | 4.98 ± 0.15 | 0.16 |
| 12.6 | 3.34 ± 0.27 | 0.05 |
| 13.6 | 0.50 ± 0.24 | 0.01 |
| 14.2 | 7.08 ± 0.26 | 0.09 |
| 17 complex | 13.50 ± 0.61 | 0.15 |
Notes. aThe AKARI detection. The others are detected by Spitzer. The AKARI spectrum is a mixture of sources C and D but the Spitzer spectra represent source D. bMeasured using a simple spline fit to the continuum, and integrating the feature flux above the continuum. Other values are measured using the PAHFIT routine (Smith et al. 2007), which fits Drude profiles to all the PAH features, resulting in systematically larger fluxes and EQW.
Download table as: ASCIITypeset image
From the SL data, we measure 6.2 μm and 11.2 μm PAH equivalent widths (EQW) of 0.26 and 0.14 μm, respectively, and line fluxes of (5.57 ± 0.19) × 10−16 W m-2 and (3.24 ± 0.32) × 10−16 W m-2, respectively, using a simple spline fit to the local continuum under the features. The apparent silicate optical depth at 9.7 μm is τ9.7 ∼ 1 when a screen geometry is assumed. This implies an AV ⩾ 19 mag toward source C+D (Roche & Aitken 1984). This is comparable with the estimate of 1–2 mag in the K band from the near-infrared colors (Goldader et al. 1997).
We do not see evidence for 14.3 μm [Ne v] emission in the SH spectrum. A 3σ upper limit of the [Ne v] line flux is <0.10 × 10⁻¹⁶ W m-2. The [Ne ii] line has a flux of (2.74 ± 0.47) × 10−16 W m-2, implying a 3σ upper limit on the [Ne v]/[Ne ii] line flux ratio of 0.04. The 25.9 μm [O iv] line is not detected, with a 3σ upper limit of <0.29 × 10⁻¹⁶ W m-2, implying an upper limit on the [O iv]/[Ne ii] line flux ratio of 0.11. The 18.71 μm [S iii] line fluxes are detected in both of SH and LH: (2.16 ± 0.22) × 10−16 W m-2 in SH and (3.27 ± 0.04) × 10−16 W m-2 in LH. The large value for 18.71 μm [S iii] in LH implies that there is measurable emission line flux from source A. The flux of the [S iii] line at 33.48 μm is (4.77 ± 0.07) × 10−16 W m-2. Using the [S iii] 18.71/[S iii] 33.48 line flux ratio in LH of 0.69 ± 0.01, we derive an ionized gas density of 250 cm-3 at 104 K. The density is an average value over the area enclosed by LH which includes sources C, D, and A.
The fluxes of H2 S(3), H2 S(2), and H2 S(1) lines are (0.45 ± 0.05) × 10−16 W m−2, (0.29 ± 0.03) × 10−16 W m−2, and (0.73 ± 0.05) × 10−16 W m−2, respectively. Taking these lines, and assuming an ortho-to-para ratio of 3.0, we estimate the warm molecular gas has a temperature of 329 K and a total mass of 4.5 × 10⁷ M☉.
If we fit the entire IRS low-res spectrum using PAHFIT (Smith et al. 2007), we can estimate a total PAH flux (see Table 4) and compare this to the far-infrared flux which we estimate originates from source C+D. When this is done, we derive a ratio of  . Since the continuum emission at the overlap wavelengths of SL and LL has a difference less than 10%, dust emission in our low-res spectrum is dominated by source C+D.
3.5. AKARI Near-infrared Spectroscopy
The spectrum of sources C and D taken with AKARI is well separated from that of the other sources (A and B) in II Zw 096, although they are all in the Np aperture, because the direction of spectral dispersion is nearly perpendicular to the vector separating C, D, and A. The AKARI near-infrared spectrum of source C+D is shown in Figure 7. Strong 3.3 μm PAH emission, 3.4 μm emission from aliphatic hydrocarbon grains, and Brα emission lines are detected. The line fluxes are (2.37 ± 0.14) × 10−16 W m-2 and (0.50 ± 0.05) × 10−16 W m-2 for the PAH and the Brα, respectively, after fitting both with a Gaussian function (see Tables 3 and 4). The EQW of the 3.3 μm PAH is 0.14 μm. Because the AKARI spectral resolution between 2.5and5 μm is only R ∼ 120, the Brα recombination line is not resolved.

Figure 7. AKARI near-infrared spectrum of sources C and D. The wavelength scale is given in the rest frame.
Download figure:
Standard image High-resolution imageThe spectrum of source A (not shown) also exhibits 3.3 μm PAH and Brα emission. The 3.3 μm PAH has a flux of (1.77 ± 0.12) × 10−16 W m-2 and an EQW of 0.08 μm. The Brα line flux is (0.33 ± 0.06) × 10−16 W m-2.
3.6. Bright Star Clusters in the Remnant
The high-resolution HST imaging data show that a large number of bright star clusters surround the II Zw 096 nuclei and are present throughout the merging disks (see Figure 2). From the B- and I-band images, we identify 128 clusters with apparent magnitudes of 18.3 mag ⩽ mB ⩽ 26.7 mag (Vega) and 17.9 mag ⩽ mI ⩽ 25.7 mag (Vega) with 80% completeness limits of 26.0 mag and 25.5 mag, respectively. Of these, 97 and 88 are detected in the FUV and H-band images, respectively. For all clusters, we use a 01 radius circular aperture for the HST photometric measurements. We estimate that the clusters contribute ≃14% of the total FUV luminosity (≈8 × 1036 W) in II Zw 096 (uncorrected for reddening).
In Figure 8, we present an FUV–optical (F140LP−F435W versus F435W−F814W) color–color diagram of the clusters. We additionally show the colors of a number of diffuse emission regions throughout the merger system. For the diffuse emission regions, we use 05–08 radius circular apertures, depending on the location in the FUV image to avoid crowded regions.
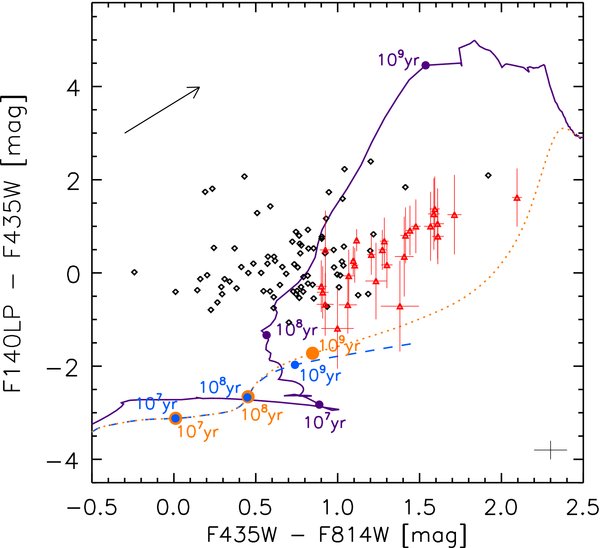
Figure 8. Optical–UV color–color diagram of the young star clusters (black diamonds) and diffuse emission regions (red triangles) in II Zw 096. Only clusters whose uncertainties are F140LP−F435W <0.2 mag and F435W−F814W <0.1 mag are plotted. The maximum uncertainty is shown at the lower right as an error bar. The solid purple, the orange dotted, and the blue dashed lines are the models that correspond to instantaneous starburst, exponentially declining (SFR = 1 M☉τ−1e(−t/τ) for τ = 1 Gyr, 0Gyr ⩽ t ⩽ 20 Gyr) and continuous star formation age tracks, respectively, with Salpeter IMF and Padova 1994 track (Bruzual & Charlot 2003). The ages are labeled in years. The arrow indicates the AV = 1 mag reddening vector (Calzetti et al. 1994). See Figure 9 to identify the positions of the clusters and the diffuse emission regions.
Download figure:
Standard image High-resolution imageTwo potential explanations for the observed color distribution are considered. First, if all the clusters are coeval, then their different colors result from variable extinction. In other words, those clusters or diffuse emission regions which have colors of F435W−F814W ≳ 1.0 mag or F140LP−F435W ≳ 0.0 mag are heavily reddened (AV ≳ 3 mag). When we de-redden an instantaneous starburst model of Bruzual & Charlot (2003), all of the clusters and the diffuse regions are younger than ∼5 Myr. On the other hand, when we pick an exponentially declining (SFR = 1 M☉τ−1e(−t/τ) for τ = 1 Gyr, 0Gyr ⩽ t ⩽ 20 Gyr) or a continuous star formation model (Bruzual & Charlot 2003), they have ages between approximately 1and100 Myr. However, we note that the points of cluster colors are not aligned well with the extinction vector. In particular, there is a significant spread in B − I (F435W−F814W) colors, which is not consistent with a coeval population with similar intrinsic colors and variable reddening.
A more likely explanation is that the colors of the clusters imply at least two populations: one with F435W−F814W <0.5 mag and a redder group with F435W−F814W ⩾1.0 mag. The extinction-corrected ages of the two systems are 1–5 Myr and 20–200 Myr for the instantaneous starburst model (Bruzual & Charlot 2003), respectively. We assume that both have colors consistent with reddening by 1–2 mag of visual extinction (AV = 1–2 mag). However, many clusters have 0.5 mag ⩽ F435W−F814W < 1.0 mag, implying ages of 200–500 Myr old, if they are un-reddened. If these clusters sit behind 1–2 mag of visual extinction, then they could be as young as 5 Myr old. If we take into account an exponentially declining (SFR = 1 M☉τ−1e(−t/τ) for τ = 1 Gyr, 0Gyr ⩽ t ⩽ 20 Gyr), or a continuous star formation history (Bruzual & Charlot 2003), then the ages of the clusters will be between approximately 1 Myr and 1 Gyr with AV = 1–3 mag. With these models, there are a larger number of older clusters than in the instantaneous starburst model. In particular, the clusters that have colors of both of F435W−F814W ≳1.0 mag and F140LP−F814W ∼−1.0 mag are about 10 times older.
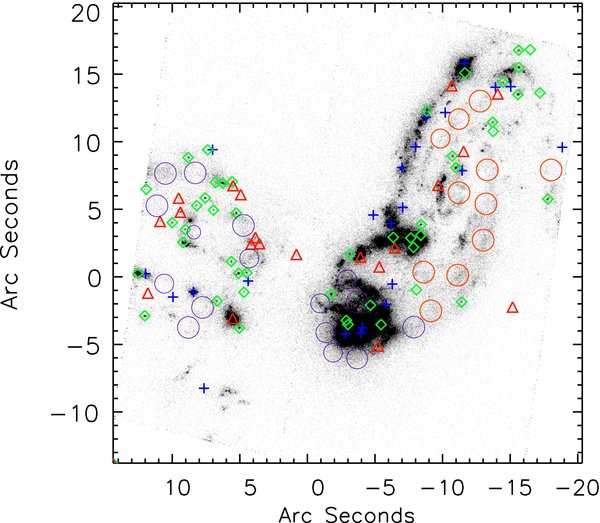
Figure 9. HST ACS SBC F140LP (far-UV) image with the positions of the clusters and diffuse emissions (see Section 3.6). Blue crosses are the clusters whose F435W − F814W < 0.5 mag implying the ages are 1–5 Myr, red triangles are those which have F435W − F814W ⩾ 1.0 mag implying the ages are 20–200 Myr, and green diamonds have colors between 0.5 mag ⩽ F435W − F814W < 1.0 mag. The purple and orange circles indicate the diffuse emission and correspond to F435W − F814W < 1.4 mag and F435W − F814W ⩾ 1.4 mag, respectively. The size of the circles corresponds to the aperture size of the photometry measurements. Also see Figure 8.
Download figure:
Standard image High-resolution imageIn the Antennae Galaxies, the merger with the most extensively studied system of star clusters, Whitmore et al. (1999) find three populations of star clusters with ages of ∼10 Myr, ∼100 Myr, and ∼500 Myr. In the overlap region, the clusters appear to be even younger, possibly less than 5 Myr old based on Hα imaging. The youngest clusters in II Zw 096, therefore, appear to have similar ages as the youngest clusters in the Antennae. In more luminous galaxies (LIRGs and ULIRGs), Surace et al. (1998) and Scoville et al. (2000) find cluster ages between 5and300 Myr, consistent with the spread in ages we find for II Zw 096. In Arp 220, Wilson et al. (2006) similarly find two populations of clusters with ages of <10 Myr and 70–500 Myr.
The regions of diffuse emission in II Zw 096 are typically 0.5–1 mag redder in F435W−F814W than the star clusters. If we assume that the emission of the diffuse regions comes from a mixture of young stars (∼1 Myr) and old stars (∼1 Gyr), then the average F140LP−F435W color of the diffuse regions can be explained by saying that they contain a small fraction (∼5%–10%) of young stars. On the other hand, the F435W−F814W color of the diffuse emissions suggests that nearly 17% of the emission comes from young stars, although the diffuse emissions have a large spread in this color.
We show the location of the clusters and the diffuse emission on the ACS F140LP image in Figure 9. There is no apparent correlation of the cluster colors (ages) with position, except for the bluest clusters which are prominent along the spiral arm to the northwest. On the other hand, the diffuse emission regions with F435W−F814W <1.4 mag are concentrated in the east, while those with F435W−F814W >1.4 mag are in the west of II Zw 096.
The F435W−F160W or F814W−F160W colors of the clusters do not show an obvious gradient or pattern with position. However, the clusters to the east side have less blue F814W−F160W colors on average than the clusters to the west.
The NICMOS H-band data can be used to compute the masses of the clusters. In Figure 10, we show an F435W−F814W versus absolute H-band color–magnitude diagram for the clusters. Assuming the clusters have 0–2 mag of visual extinction, as in the color–color diagram (see Figure 8), the H-band data suggest that most of the clusters have masses of 106–108 M☉.

Figure 10. Optical–near-infrared color–magnitude diagram of the young star clusters in II Zw 096. Only the clusters which have uncertainties of F160W <0.4 mag and F435W−F814W <0.1 mag are plotted in the figure. The error bar at the lower right indicates the maximum uncertainty. The dotted, dashed, and solid lines are the instantaneous starburst aging tracks for clusters with 108, 107, and 106 M☉, respectively. The arrow is the AV = 1 mag reddening vector.
Download figure:
Standard image High-resolution imageIf we compare the masses of the star clusters in II Zw 096 with those in the Antennae Galaxies, the former appear to be ∼100 times larger (Zhang & Fall 1999). However, we note that the resolution of the HST data is about 30 pc for II Zw 096 as opposed to only 5 pc at the distance of the Antennae, and this might account for the apparent differences in the cluster masses between the two galaxies. For comparison, in (U)LIRGs, the cluster masses derived by Surace et al. (1998) and Scoville et al. (2000) lie between 105and107 M☉, with the youngest clusters dominating the high-mass end. This is also true in II Zw 096, where the youngest clusters (those with F435W−F814W <0.5 mag and AV = 1–2 mag) appear to have masses above 107 M☉.
In order to compare the distribution of the luminosity of the clusters, we derive the B-band luminosity function (LF) and fit this with a power law, dϕ/dLB ∝ LαB. In the range of −14.7 mag ⩽ MB ⩽ −10.7 mag with the detection limit of −9.9 mag, we obtain α = −1.1 ± 0.3. To avoid confusion due to limited spatial resolution, we chose for comparison merging infrared luminous galaxies at similar distances to II Zw 096. The LF of the clusters in II Zw 096 is found to have a flatter slope (α = −1.1 ± 0.3) than that of Mrk 231 (α = −1.80 ± 0.2) at z = 0.042 or Mrk 463 (α = −1.63 ± 0.11) at z = 0.050, which are two nearby ULIRGs studied by Surace et al. (1998). This suggests that there are more luminous clusters in II Zw 096 than Mrk 231 and Mrk 463. In the Antennae Galaxies at z = 0.006, the V-band LF of the clusters have much steeper slopes, α = −2.6 ± 0.2 and α = −1.7 ± 0.2 in the ranges of MV ≲ −10.4 mag and −10.4 mag <MV < −8.0 mag, respectively (Whitmore et al. 1999).
4. DISCUSSION
We have presented the first mid- and far-infrared images and spectra of II Zw 096, which show that the extremely red source first identified in the near-infrared by Goldader et al. (1997) is a heavily obscured starburst that dominates the energetics of the entire merging system.
4.1. The Nature of Source C+D
The IRS spectra of source C+D show the presence of PAH emission, and no evidence of [Ne v] or [O iv]. The upper limits on the [Ne v]/[Ne ii] and [O iv]/[Ne ii] emission line flux ratios are 0.04 and 0.11, respectively. These line ratios imply a starburst-dominated system. The EQW of the 6.2 μm PAH feature is 0.26 μm, which is only about 1/2 that seen in pure starburst nuclei (Brandl et al. 2006). This might indicate an excess of hot dust in source C+D compared to the nuclei of most starburst galaxies, or a deficiency of PAH emitters.
If we adopt a total far-infrared flux FIR = 8.48 × 10⁻¹³ W m−2 for source D, and a total PAH flux  W m−2 including all the PAH features (Table 4), we derive a ratio of
  . This is at the low end for pure starburst galaxies, or about 1/2 the median value (Marshall et al. 2007).
The high [Ne iii]/[Ne ii] line flux ratio of ∼1.0 is at the high end of that seen in starburst galaxies (Thornley et al. 2000; Madden et al. 2006; Beirão et al. 2008). There are two possibilities that can explain this high ratio—either a low metallicity, or an unusually hard radiation field, possibly produced by a large number of high-mass stars. According to Rupke et al. (2008), the SE source (source A in this paper) has a metallicity of 0.4 Z☉ ⩽ Z ⩽ 1.8 Z☉, or a mean oxygen abundance 〈12 + log(O/H)〉 = 8.6. If we assume solar metallicity for the gas, the implied age is about 3 Myr, and an upper mass cutoff of 50–100 M☉ is required to match the observed [Ne iii]/[Ne ii] ratio (Thornley et al. 2000).
The strong 3.3 μm PAH emission feature seen in the AKARI spectrum also supports a powerful starburst in source D (Moorwood 1986; Imanishi et al. 2008). In addition, the typical indicators of a buried active galactic nucleus (AGN), e.g., a rising (power-law) continuum (Armus et al. 2007; Veilleux et al. 2009) or 3.4 μm absorption by aliphatic hydrocarbon grains (Imanishi et al. 2006) are not detected.
The Chandra data for source C+D are also consistent with a buried starburst, although they are slightly weak in X-rays for their far-infrared luminosity. Starburst galaxies show a correlation between their infrared and X-ray luminosities (Ranalli et al. 2003). To convert from 2–7 to 2–10 keV, we have extrapolated the spectral model fit to the data from 7 to 10 keV as in Iwasawa et al. (2009). Together, source C+D lies below the starburst correlation, but within the 2σ envelope of the distribution. In some (U)LIRG nuclei of the GOALS sample, the low ratio of the hard X-ray emission to the far-infrared emission has been taken as evidence for highly obscured AGN (Iwasawa et al. 2009), although this argument hinges on the detection of an Fe K emission line. Given the low number of counts in the spectrum of source C+D, an accurate description of the X-ray properties will require significantly deeper integrations. The other X-ray luminous source, source A, lies on the X-ray selected starburst correlation line of Ranalli et al. (2003), suggesting this source is powered by starburst.
From the infrared luminosity of LIR = 6.87 × 10¹¹ L☉, the star formation rate (SFR) of source D is estimated to be 120 M☉ yr-1 (Kennicutt 1998). This is approximately a factor of 5 above that estimated by Goldader et al. (1997) based on the near-infrared data alone. Assuming this far-infrared emission originates from a region having a size comparable to that of the projected FWHM of the MIPS 24 μm beam (6''), we estimate a starburst luminosity density of ∼4.0 × 10¹⁰ L☉ kpc-2, or an SFR density of ∼6.9 M☉ yr-1 kpc−2. If instead, we take the size of source D estimated from the NICMOS image (∼220 pc radius), we obtain values which are about 2 orders of magnitude larger, namely a luminosity density of ∼4.5 × 10¹² L☉ kpc-2 and an SFR density of ∼780 M☉ yr-1 kpc−2. Although large, this value is still below the peak values estimated for clusters in starburst galaxies (Meurer et al. 1997) which are an order of magnitude higher. Similarly, our derived value for source D is well below most of the ULIRG starburst nuclei observed by Soifer et al. (2000), except for IRAS 17208−0014.
The Brα line detected with AKARI provides a direct measure of the SFR. We assume Case B for hydrogen recombination, the effective temperature of ∼104 K, and the density of ∼100 cm-3. We then estimate an SFR of approximately 45 M☉ yr-1 uncorrected for extinction (Kennicutt 1998). Although we do not have an estimate of the extinction from the AKARI spectra, if we apply the line-of-sight value estimated from the depth of the silicate feature in the IRS data (AV = 19 mag; Smith et al. 2007, Equation (4)), the implied SFR would be about 70 M☉ yr-1.
Existing radio observations of II Zw 096 also suggest that source D is a site of intense star formation. At 1.425 GHz, Condon et al. (1996) measure an integrated flux density of 26.6 mJy using the Very Large Array (beam size of 6''). The J2000 position of the radio peak is R.A. = 20 57
57 243, decl. = +17°07'38 8'', well within the positional uncertainties of the position of source D in the MIPS data. With the new Spitzer imaging data, we can, for the first time, estimate the infrared-to-radio ratio q (Helou et al. 1985) for source D as q = 2.93. This value is within the ∼1σ (0.26 dex) scatter of the average q (〈q〉 = 2.64) among star-forming galaxies (Bell 2003), and is thus consistent with our mid-infrared spectra and X-ray data implying starburst activity in source D.
The H-band magnitude (−19.5 mag) and assumed age, extinction, and metallicity are used to derive the mass of source D by the model of Bruzual & Charlot (2003). Goldader et al. (1997) estimate the age of the II Zw 096 starburst to be roughly 5–7 Myr from the CO index and Brγ EQW, using the models of Leitherer & Heckman (1995). Assuming an extinction of 3.3 mag in the H band (AV ⩾ 19 mag—see Section 3.4) and solar metallicity, we estimate the mass of source D to be approximately 1–4 × 10⁹ M☉.
4.2. The Comparison with Other Merger-induced Extranuclear Starbursts
Source D is a powerful starburst not associated with the primary nuclei of the II Zw 096 system (sources A and B). It could be a starburst in the disturbed disk of source A, or even the nucleus of a third galaxy—one that is nearly completely hidden behind A and B. While large-scale mapping and modeling of the gas and stellar dynamics of II Zw 096 will be needed to fully understand the true nature of the system, we favor the former explanation for two reasons. First, simulations have shown (e.g., Barnes 2004) that shock-induced starbursts can occur both in and outside the nuclei of merging galaxies. Second, we have a number of examples of powerful, extranuclear starbursts in the local universe. Below we compare the properties of source D to the extranuclear starbursts in two well-studied merging galaxies NGC 4038/9 (the Antennae Galaxies) and Arp 299.
In the Antennae Galaxies, nearly 1/2 of the total 15 μm emission (about 5 × 10¹⁰ L☉) comes from the overlap region (5 × 3 kpc) between the merging spiral galaxies, with about 15% coming from a single starburst knot (Mirabel et al. 1998). Recent mid-infrared spectral mapping observations with the IRS on Spitzer have resolved this off-nuclear starburst region into a number of clumps in the mid-infrared (peaks 1, 2, 3, and 5 of Brandl et al. 2009). These clumps (or clusters) have infrared luminosities of 3.86 × 10⁹ L☉ < LIR < 1.14 × 10¹⁰ L☉, corresponding to ∼5%–16% of infrared radiation coming from the system. Brandl et al. (2009) estimate that the SFRs in these clusters range between 0.66and1.97 M☉ yr-1.
To make a direct comparison with II Zw 096, we pick the most luminous infrared peak in the Antennae (peak 1 in Brandl et al. 2009) which has LIR = 1.14 × 10¹⁰ L☉ and assume the radius of this cluster to be R ∼ 48 pc (the size estimated by Whitmore & Schweizer 1995). We then estimate a luminosity density of 1.6 × 10¹² L☉ kpc-2. This value is about three times smaller than the upper limit of the luminosity density of source D (assuming a size of 220 pc radius—the size of D in the NICMOS image). While the luminosity density of peak 1 is extremely large, it only contributes ∼15% of the total infrared emission of the entire system, in contrast to source D in II Zw 096 which dominates the total infrared output of the system.
In the Antennae Galaxies, the silicate optical depths at 9.7 μm of the star clusters measured by Brandl et al. (2009) are τ9.7 = 0.13–1.03 (AV = 2.4–19 mag). Although one of the clusters in the Antennae, peak 5, has an extinction comparable to that measured in source D in II Zw 096 (τ9.7 ∼ 1.03), its LIR is the smallest in all of the clusters in the overlap region of the Antennae. This is unlike source D which has both high extinction and high LIR. Peak 1 itself has a τ9.7 = 0.19, much lower than our estimated value for source D, even though the estimated age of peak 1 (2–4 Myr) is slightly less than that derived for source D (5–7 Myr; Goldader et al. 1997).
Arp 299 (IC 694 + NGC 3690) has substantial extranuclear infrared emission like the Antennae but an infrared luminosity of ∼6 × 10¹¹ L☉, making this system an LIRG. In particular, regions C and C' in the overlap region between IC 694 and NGC 3690 have all the signatures of a merger-induced starburst (e.g., Alonso-Herrero et al. 2000, 2009; Charmandaris et al. 2002). Region C+C' has an infrared luminosity (4.4 × 10¹⁰ L☉; Charmandaris et al. 2002), approximately 6.4% of the LIR of source D in II Zw 096. The fraction of the infrared emission in regions C and C' to that in the Arp 299 system is only ∼10% (Charmandaris et al. 2002), much less than the fractional infrared luminosity in source D (80%). The infrared luminosity densities of regions C and C' are estimated to be ∼1.0 × 10¹¹ L☉ kpc-2 and ∼7.5 × 10¹⁰ L☉ kpc-2, respectively, if we assume that their sizes are R ∼ 300 pc and R ∼ 250 pc, corresponding to the size of Paα emission estimated by Alonso-Herrero et al. (2009), and that the infrared luminosities of regions C and C' have a ratio of 2:1. These numbers are a factor of 2–3 larger than what we estimate for source D when we assume that the size of the source D is equivalent to the beam size of the MIPS 24 μm. However, if the size of source D is comparable to the NICMOS resolution, then the luminosity density could be significantly larger than that seen in regions C and C' in Arp 299.
Assuming a metallicity of 2Z☉, Alonso-Herrero et al. (2009) use the IRS spectra of regions C and C' and the models of Snijders et al. (2007) to estimate ages of 4–7 Myr. If we apply the same model and metallicity to source D in II Zw 096, the measured [Ne iii]/[Ne ii] =1.0 and [S iv]/[S iii] =0.33 line ratios suggest that source D also has an age of 4–7 Myr.
5. SUMMARY AND CONCLUSIONS
The first analysis of the interacting galaxy II Zw 96 utilizing mid- and far-infrared images and mid-infrared spectroscopy leads to the following conclusions.
- 1.The Spitzer imaging reveals that approximately 80% of the far-infrared emission of the II Zw 096 comes from a compact, off-nuclear starburst with R.A. = 20
 572434, decl. = +17°07'39 1'' (J2000). The estimated 8–1000 μm luminosity of this source is LIR = 6.87 × 10¹¹ L☉. The implied SFR of this object is about 120 M☉ yr-1.
 - 2.HST NICMOS observations show that the off-nuclear starburst is composed of two prominent, red knots, with a number of smaller peaks spread over approximately 10 arcsec2 (∼6.6 kpc2). Most of this emission is not seen in the optical imaging data, either from the ground or with the HST ACS. The knot to the southwest of this region, source D, is consistent with the peak in the Spitzer MIPS 24 and 70 μm emission which dominates the far-infrared luminosity of the entire merging galaxy. Assuming a standard mass-to-light ratio for galaxies, the H-band luminosity of source D corresponds to a mass of 1–4 × 10⁹ M☉.
- 3.The Chandra X-ray imaging shows that the hardest source in the system is source C+D, and it lies slightly below the correlation of X-ray and infrared luminosities seen for starburst galaxies, although within the 2σ scatter of the relation.
- 4.The Spitzer IRS and AKARI spectra suggest a starburst-dominated system with strong 3.3 μm and 6.2 μm PAH emission, and no evidence of emission from [Ne v] 14.3 μm or [O iv] 25.9 μm in the IRS data. While the EQW of the 3.3 μm PAH feature as measured in the AKARI spectrum is typical for starburst galaxies, the EQW of the 6.2 μm PAH feature as measured in the IRS spectrum is about 1/2 the value found in pure starbursts. This may reflect an excess of hot dust surrounding source C+D, which is easier to detect in the narrow IRS slit. This is consistent with the [Ne iii]/[Ne ii] line flux ratio of ∼1 indicating a relatively hard radiation field. The 9.7 μm silicate optical depth, measured from the IRS spectra suggests an AV ⩾ 19 mag toward source C+D, indicating a highly buried source.
- 5.The ACS B- and I-band imaging reveals a large number of (super) star clusters in the II Zw 096system, consisting of at least two populations: one 1–5 Myr and one 20–500 Myr, which may have formed at different times during the merger. We find no clear association of cluster age with position in the merger. Most of the cluster masses are in the range of 106–108 M☉.


Spitzer imaging and spectroscopy of II Zw 096 has revealed a powerful, young extranuclear starburst. This starburst is reminiscent of those seen in NGC 4038/9 (the Antennae Galaxies) and Arp 299, but it is more luminous (more than an order of magnitude more luminous than the Antennae starburst), and it is responsible for nearly all the infrared luminosity in II Zw 096 (compared to only 10%–15% in the Antennae or Arp 299). Source D in II Zw 096 is one of the most extreme buried extranuclear starbursts yet discovered in the local universe.
We thank J. Goldader and S. Satyapal for many helpful suggestions. The authors also thank an anonymous referee for suggestions which improved the manuscript. The Spitzer Space Telescope is operated by the Jet Propulsion Laboratory, California Institute of Technology, under NASA contract 1407. This research has made use of the NASA/IPAC Extragalactic Database (NED) and the Infrared Science Archive (IRSA) which are operated by the Jet Propulsion Laboratory, California Institute of Technology, under contract with the National Aeronautics and Space Administration. Hanae Inami thanks the Spitzer Visiting Graduate Student Fellowship (from 2008 September to 2009 February) and Grant-in-Aid for Japan Society for the Promotion of Science (JSPS) Fellows (21-969) for supporting this work.
Facilities: Akari - Akari (ASTRO-F), CXO - Chandra X-ray Observatory satellite, HST - Hubble Space Telescope satellite, Spitzer - Spitzer Space Telescope satellite
Footnotes
- 21
Available from the Spitzer Science Center—see http://ssc.spitzer.caltech.edu/postbcd/mopex.html.
- 22
- 23
This is available from http://www.ir.isas.ac.jp/ASTRO-F/Observation/DataReduction/IRC/.