


Abstract
We have characterized the electronic structure of FeSe1−xTex for various x values using soft x-ray photoemission spectroscopy (SXPES), high-resolution photoemission spectroscopy (HRPES) and inverse photoemission spectroscopy (IPES). The SXPES valence band spectral shape shows that the 2 eV feature in FeSe, which was ascribed to the lower Hubbard band in previous theoretical studies, becomes less prominent with increasing x. HRPES exhibits systematic x dependence of the structure near the Fermi level (EF): its splitting near EF and filling of the pseudogap in FeSe. IPES shows two features, near EF and approximately 6 eV above EF; the former may be related to the Fe 3d states hybridized with chalcogenide p states, while the latter may consist of plane-wave-like and Se d components. In the incident electron energy dependence of IPES, the density of states near EF for FeSe and FeTe has the Fano lineshape characteristic of resonant behavior. These compounds exhibit different resonance profiles, which may reflect the differences in their electronic structures. By combining the PES and IPES data the on-site Coulomb energy was estimated at 3.5 eV for FeSe.
Export citation and abstract BibTeX RIS
1. Introduction
The discovery of iron-based layered superconductor LaO1−xFxFeAs with a superconducting transition temperature Tc of 26 K [1] has provoked extensive research aiming to understand the mechanism of superconductivity and to synthesize a new superconductor with a higher Tc. More than six families of such superconductors have been reported, with the highest Tc of 56 K [2]. Basic electronic configurations directly related to the mechanism of the superconductivity have been intensively explored [3]. Among them, FeSe has the simplest crystal structure [4] consisting of FeSe layers, in which Fe atoms are octahedrally coordinated with Se atoms. The layers extend two-dimensionally by edge sharing, just like the FeAs layer in iron pnictide superconductors. FeSe has Tc ∼ 8 K, which increases to 37 K under pressure of ∼4 GPa [5, 6]. In contrast, FeTe is not a superconductor; it has a magnetic transition around 70 K which is accompanied by the tetragonal to monoclinic distortion [7]. In FeSe1−xTex, Tc shows a maximum of 14 K around x ∼ 0.5 [8].
Band structure calculations predicted that the Fermi surface (FS) topology of FeSe, FeS and FeTe consist of cylindrical hole-like FS sheets at zone center and electron-like sheets at the zone boundary [9], similar to those of Fe pnictide superconductors. Photoemission spectroscopy has played an important role in testing the predicted electronic structures. Angle-resolved photoemission spectroscopy (ARPES) studies of FeSe1−xTex have confirmed the predicted FS topology for high Te concentrations [10–13]. They also provided values of mass enhancement from quasiparticle dispersions, but the values varied with Te concentration: 6–20 for FeSe0.42Te0.58 and 2–3 for Fe1.03Te0.7Se0.3. Soft x-ray photoemission spectroscopy (SXPES) measurements clarified the valence band structure of FeSe and revealed an anomalous feature [14, 15], which was attributed to a lower Hubbard band [16, 17] by local density approximation dynamical mean field theory (LDA + DMFT) calculations. As for the electron correlations in FeSe1−xTex, weak correlation was assumed from Fe L2,3-edge x-ray absorption spectroscopy (XAS) results because of the similarity of the spectral shape in FeSe1−xTex and metallic Fe [18]. On the contrary, combined XAS and x-ray emission spectroscopy (XES) studies indicated that FeSe1−xTex is hardly a weakly correlated system like Fe pnictide superconductors [19].
The concentration dependence of ARPES should clarify the electronic structure of FeSe1−xTex. However, such a study could not be completed due to the lack of single crystals with low x. Evolution of the valence band and conduction band spectral shape from angle-integrated PES and inverse photoemission spectroscopy (IPES) using polycrystalline samples would connect the electronic structure data available for FeSe1−xTex. In this paper, we report a study of electronic structure of FeSe1−xTex by SXPES, high-resolution (HR) PES and IPES. By combining the obtained data and comparing them with band calculations, we discuss the dependence of electronic structure on x.
2. Experimental details
Polycrystalline FeSe1−xTex samples were prepared in a solid-state reaction as described elsewhere [20]. The Te concentration x refers to the nominal composition.
SXPES measurements were performed at the BL25SU and BL27SU beam lines of the SPring-8 synchrotron radiation facility. We used a SCIENTA 2002 analyzer with a circularly polarized light at BL25SU and a PHOIBOS analyzer with a linearly polarized light at BL27SU. The energy resolution at 800 and 1100 eV was set to 120 and 200 meV, respectively. HRPES measurements were performed at Okayama University using a SCIENTA R4000 analyzer and a SPECS UVLS discharge lamp (He I and He II resonance lines). The energy resolution for He I and He II was set to 20 and 40 meV, respectively. The base pressure was lower than 3 × 10⁻⁸ Pa for all measurements.
IPES measurements were carried out at the Hiroshima Synchrotron Radiation Center (HiSOR) of Hiroshima University using a spectrometer equipped with an Erdman–Zipf-type low-energy electron gun (BaO cathode). The monochromator contained a line-spacing spherical grating with an averaged line density of 1200 lines mm−1 [21]. The energy resolution was ∼0.48 eV at an incident electron energy of 56 eV. The pressure in the analysis chamber was 3 × 10⁻⁸ Pa. Samples were kept at 18 K during the IPES measurements.
For all the PES and IPES studies, clean sample surfaces were obtained by fracturing samples in situ and assessed by wide-range SXPES spectra as shown in figure 1 for FeSe and FeTe. These spectra show core peaks from Fe, Se and Te, but not from possible oxygen or carbon impurities.
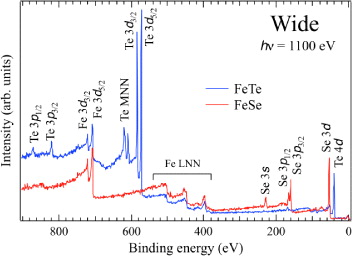
Figure 1. SXPES wide-range spectra of FeSe and FeTe measured with 1100 eV photon energy.
Download figure:
Standard imageFor comparison, we have carried out band structure calculations using the full-potential augmented plane wave method (FLAPW) within the local density approximation (LDA). Following the LDA formalism proposed by Gunnarsson and Lundqvist [22], densities of states were calculated with the program package codes KANSAI-04 and TSPACE on the scalar relativistic scheme with the spin–orbit interaction included as a second variational procedure. For crystallographic parameters, we employed the values experimentally determined for the low-temperature phase [23]. For FeSe0.5Te0.5 and FeSe0.25Te0.75, we calculated band structures of both FeSe and FeTe using crystallographic parameters of FeSe0.5Te0.5 and FeSe0.25Te0.75 (nominal composition).
3. Results and discussion
Figure 2(a) shows valence band SXPES spectra of FeSe1−xTex measured at 800 or 1100 eV photon energy. Spectra were normalized using the region from 7 eV binding energy to 1 eV above EF. The FeTe spectrum showed a weak angular dependence, especially above 4 eV, possibly because the grains of FeTe samples were larger than the beam diameter, but this fact does not affect the conclusion drawn below. This spectrum contains four features at 0.25, 2.0, 4.0 and 6.0 eV, which we denote as A, B, C and D. The overall shape of the valence band is similar to that obtained previously [14, 15]. According to the photon energy dependent PES study of FeSe and band structure calculations, structures A and B correspond to the Fe 3d state, structure C reflects the hybridization of Fe 3d and Se 4p states, and structure D mainly originates from the Se 4p state.
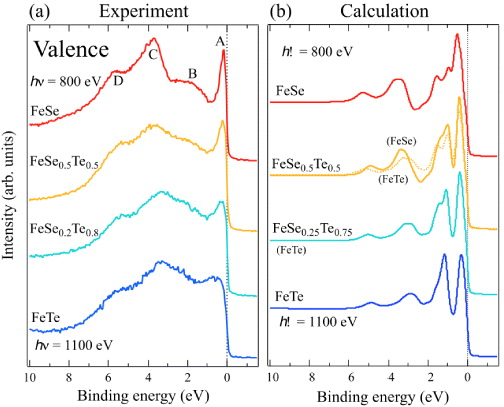
Figure 2. SXPES valence band spectra of FeSe1−xTex: (a) measured at 20 K and (b) calculated.
Download figure:
Standard imageWith increasing x the valence band spectral shape becomes more featureless. The sharp peak near EF observed in FeSe broadens, especially for samples with x = 0.8 and 1 (FeTe). Structures B and C are well separated for FeSe, but not FeTe, partly because the feature C is broadened and shifted to lower energies for samples with x = 0.8 and 1. To further investigate the x dependence of spectral shape, we compare the experimental and theoretical spectra obtained from the calculated density of states (DOS, figure 2(b)). The spectra were calculated by Gaussian (total energy resolution) and Lorentzian (lifetime) broadening of the band structures after taking ionization cross section [24] into account. For FeSe0.25Te0.75, we used the DOS of FeTe calculated using the crystallographic parameters of the nominal composition FeSe0.25Te0.75. For FeSe0.5Te0.5, we show two spectra calculated with DOS of FeTe and FeSe, respectively, using the crystallographic parameters of the nominal composition FeSe0.25Te0.75. Comparison of these spectra clearly demonstrates two distinct effects: the binding energy difference between Te and Se p states and the changes of crystallographic parameters due to the Se substitution. For FeTe, calculations were performed by assuming the paramagnetic state, which corresponds to the high-temperature phase. However, the magnetic transition around 70 K results in a relatively small change near EF, consistent with previous studies [25] (as will be discussed latter), and therefore the overall spectral shape of SXPES valence band may be used to represent the high-temperature phase. In all the calculated spectra, structures from 2 eV binding energy to EF mostly correspond to Fe 3d derived states. The structure around 3–4 eV reflects hybridization of the Fe 3d and chalcogenide p orbitals, and the structure around 5 eV originates from the chalcogenide p states. The calculated spectra reveal a strong x dependence of the DOS shape in the Fe 3d states (binding energy <2.5 eV), namely a dominant peak with shoulder structures in FeSe and a doublet in FeTe. This difference reflects the change in the distance between the chalcogen atom and the Fe plane. The x dependence is weaker in the chalcogenide p DOS (binding energy 2.5–6 eV) due to the shifted energy of the chalcogenide p levels.
Our analyses reveal a general tendency that, in the calculation, the intensity of Fe 3d states is overestimated compared to that of chalcogenide p derived states. Although the existence of multiple phases was reported to reduce the intensity near EF [26], our samples consisted of nearly single phase, with a few per cent of Fe2O3 impurity at most. Whereas the structures C and D experimentally observed at higher binding energies and their x dependence agree with calculations, there is a strong difference for the dominant Fe 3d states. For FeSe, the lower binding energy of the peak near EF in the experiment than in the calculations was explained by the renormalization effect [14, 15]. The self-energy correction to the band structure calculations provided a larger mass enhancement value of Z−1 = 3.6 and also separated an incoherent part from the spectrum [15], which was attributed to the lower Hubbard band by LDA + DMFT studies [17]. It is worth mentioning that structure B is well resolved owing to the gap-like structure in the valence band in FeSe stemming from the larger separation of the Fe 3d and Se 4p levels.
To investigate the x dependence of the peak near EF, we have carried out HRPES measurements for FeSe1−xTex samples with different compositions. The spectra are shown in figures 3(a) and (b). Figure 3(a) reveals that the peak near EF broadens and the structure around 2 eV becomes less prominent with increasing x, in agreement with SXPES results. This agreement ensures that the spectra obtained by PES using vacuum ultraviolet radiation predominantly reflect the bulk electronic structure. Figure 3(b) shows the evolution of the spectral shape and the intensity at EF in more detail. The peak at ∼0.2 eV in FeSe splits into two features in FeSe0.5Te0.5, and the peak separation increases with increasing x. As for FeTe, we measured HRPES at 90 K, which is above the first-order magnetostructural transition around 70 K. Compared to the 20 K data, the spectral intensity is higher in the region from EF to ∼0.5 eV, whose energy scale is similar to the energy scale (0.7 eV) of ARPES results for Fe1.06Te [25]. According to the band structure calculations, nonmagnetic and bicollinear [27] band structures of FeTe are different with each other in the entire valence and conduction band region. The most noticeable difference is that two dominant structures in the nonmagnetic state (marked by bars in the DOS of FeTe in figure 3(c)) shift to higher binding energies and the valley structure (an arrow in figure 3(c)) in between becomes less clear, leading to the overall suppression of DOS from EF − 0.8 to EF + 0.5 eV in the bicollinear state. Thus the intensity decrease near EF below TN in the experimental data agrees with calculations. On the other hand, the difference in the DOS at higher binding energies is less clear in the experimental spectra due to the expected energy-dependent broadening (lifetime).

Figure 3. (a) HRPES spectra of FeSe1−xTex (x = 0.0, 0.5, 0.65, 0.8 and 1.0) measured at 20 K with the He I resonance line. (b) Enlargement of the HRPES spectra of (a). For FeTe, the spectrum measured at 90 K is also shown, compared with the 20 K data shown by the black dotted line. (c) Calculated total DOS of FeSe1−xTex.
Download figure:
Standard imageThe splitting of the peak near EF can be related to the calculation. There is a distinct difference for the dominant Fe 3d derived states near EF for FeSe and FeTe in the calculated DOS: the valley-like structure around 0.8 eV in FeTe (marked by an arrow) is not evident in FeSe. The strength of this valley-like feature increases with x. Meanwhile, the DOS near EF (right black tick in figure 3(c)) shifts toward EF, and the feature at higher binding energy (left black tick) shifts to higher energies. This variation resembles the x dependence of PES spectra, although the energy positions do not match between the calculated and measured peaks. According to the self-energy analysis, the observed peak at 0.2 eV binding energy in FeSe can be related to the peak around 0.5 eV in the band calculations [14, 15]. Similarly, other PES peaks can be related to the calculated features, suggesting a weak dependence of renormalization on x. We note that a systematic peak splitting cannot be explained with a sum of two different electronic structures expected from the local structural inhomogeneity in FeSe1−xTex [28].
The shift of the low-energy feature increases the intensity at EF: pseudogap-like spectral shape in FeSe evolves into a clear Fermi edge in FeTe. The presence of a pseudogap in FeSe and its filling with increasing x are consistent with the specific heat studies reporting a very small γ value of 9 mJ mol−1 K−2 [4] in FeSe0.88 compared to 39 mJ mol−1 K−2 in FeSe0.33Te0.67 and 34 mJ mol−1 K−2 in Fe1.05Te [29]. The present results agree well with previous Se/Te nuclear magnetic resonance (NMR) studies suggesting an increase of DOS at EF upon Te substitution [30].
Figure 4 shows the x dependence of IPES for FeSe1−xTex measured with an incident electron energy of 40 eV. The normalization was performed at ∼10 eV above EF. The spectrum of FeSe comprises two features around 1.5 and 6 eV, which were denoted as α and β. The FeTe spectrum also contains a shoulder around 0.5 eV, as indicated by an arrow. Structure α may be attributed to the hybridization of the dominant Fe 3d states with Se p states in the band structure calculations of FeSe, while structure β can be ascribed to a combination of plane-wave-like and Se d components. As x is increased, the pseudogap near EF in FeSe is filled, leading to a higher DOS around EF in FeTe than in FeSe. This filling may be related to the shoulder structure in FeTe. In calculations, the high-energy feature moves toward EF with increasing x, which is consistent with the observed shift of structure β. As for structure α, calculations predict that the mean position of the DOS of the unoccupied Fe 3d partial states is located around 1 eV (figure 3(c)). Assuming that the renormalization of the Fe 3d states detected in the PES spectra also works for the unoccupied Fe 3d states, the expected energy position of Fe 3d states may be much closer to EF, in contrast to the observed peak positions of 1.3–1.7 eV. This disagreement suggests that the observed peak in the IPES spectra may correspond to the incoherent part of Fe 3d states. On the other hand, the intensity near EF, which corresponds to the coherent part, is very small for all compositions. This might be a general property of IPES in this energy region, as a similar observation has been reported for another compound [31]. Further IPES studies on different materials may clarify this situation. Although IPES results might not reflect the bulk properties, we observe similar spectral shapes for higher binding energies from 54 to 100 eV, where the mean free path of the photoelectron increases from 1.7 nm for 54 eV to 2.1 nm for 100 eV [32]. The x dependence of structure β seems to agree with the band calculations. We also found a change in the electronic structure near EF, as pointed out by the existence of the shoulder structure in FeTe. These results suggest that IPES data include information on the bulk electronic structure.

Figure 4. (a) IPES spectra of FeSe1−xTex (x = 0.0, 0.5, 0.8 and 1.0).
Download figure:
Standard imageFigure 5(a) shows the IPES of FeSe across the Fe 3p to 3d threshold normalized to the detector sensitivity. The structure α shows a noticeable dependence on the incident electron energy. Its intensity first decreases and shows a minimum at 52 eV. It then increases up to ∼55 eV and remains nearly constant at higher energies. In resonant IPES, normal IPES and IPES processes accompanied by the super Coster–Kronig decay interfere with each other, as the initial and final states are the same for the two processes. This gives rise to remarkable changes in the cross section of the Fe 3d signals in the Fe 3p–3d absorption region. To investigate the intensity variation, we plotted the incident electron energy dependence of integrated intensity between EF and 3 eV above EF, which covers structure α, as shown with open circles in figure 5(b). It shows a local minimum around 52 eV and a structure around 55 eV across the Fe 3p to 3d threshold. A structure around the threshold with a local minimum at a lower energy side is a characteristic feature of the resonant behavior, known as the Fano profile [33]. These results indicate a dominant 3d character of the states around 2 eV and their localized nature. They differ from the incident electron energy dependence of IPES for NdFeAsO0.7, which showed no intensity variation of the structure near EF across the Fe 3p to 3d threshold [34]. The marked difference in the resonance behavior between the two compounds confirms the more localized character of electronic states in FeSe than NdFeAsO0.7. Although previous ARPES measurements of LaFeAsO contained a strong contribution from the surface [35], IPES results are consistent with bulk measurements [19] and theoretical studies [36] reporting larger electron correlation effects in 11 systems than in 1111 systems. PES results for polycrystalline LaFeAsO samples were consistently explained with band structure calculations [37], suggesting that the use of polycrystalline samples might reduce the contribution from surface states. The incident electron energy dependences appear similar for FeTe and FeSe. However, their closer comparison in figure 5(e), where we normalized the data at the intensity of the dip, reveals a difference at low energies.

Figure 5. Resonant IPES spectra across the Fe 3p to 3d threshold of FeSe (a) and FeTe (c) measured with the incident electron energies between 40 and 100 eV. (b) Incident electron energy dependence of the integrated intensity from EF to 3.0 eV above EF of FeSe (open circles), polynomial background (green curve) and the fit with parameters q = 0.54 eV, Γ = 3.1 eV and E0 = 52.513 eV (black curve). (d) The same as (b) but for FeTe (q = 0.35 eV, Γ = 3.3 eV, E0 = 52.273 eV). (e) A comparison of the integrated intensity resonances for FeSe and FeTe.
Download figure:
Standard imageThe Fano profile is described with the Fano function F = (q + ε)2/(1 + ε2), where q is the so-called Fano's asymmetric parameter, which corresponds to the ratio of two transition matrix elements: one is the transition matrix element between an initial state and final states formed with the interaction between a discrete level and overlapped continuous states. The other is the transition matrix element between the initial state and the continuous states. The normalized energy ε is defined as (E − E0)/(Γ/2), where E0 is the resonance energy and Γ is the width of the level formed by the interaction between the discrete level and the overlapped continuous states. In the analyses, we used a polynomial background to take into account the change in the ionization cross section other than that of the resonance (the green curve in figure 5). The experimental data were fitted with a function G = (a × F + b) × P, where a and b are constants satisfying the condition a + b = 1 and P is a polynomial function [38]. The black fitting curves in figures 5(b) and (d) were generated using the parameters q = 0.63 and Γ = 2.64 for FeSe and q = 0.35 and Γ = 3.27 for FeTe. Although the background shape strongly affects the value of Γ, its effect on the determination of q is minor. Our analyses bring us to the following conclusions: (i) the absolute value of q may be less than 1. This is related to the observation that the dip structures in FeSe and FeTe are more pronounced than the peak structure, in contrast to the known resonance behavior in f electron systems [39]. This spectroscopic difference may stem from the fact that in FeSe and FeTe both the continuous state and discrete level have the same predominant 3d character, while in f electron systems the continuous state is of d or p character but the discrete level has an f character. This difference affects the transition matrix elements. (ii) The q value may be larger for FeSe than FeTe, which is related to the low-energy difference in figure 5(e). This result implies a difference in the renormalized level between FeSe and FeTe. IPES data obtained in a wider energy region, with a smaller energy interval and higher signal-to-noise ratio may improve the fitting quality and clarify the difference in the electronic structures between FeSe and FeTe.
These PES and IPES results characterize the x dependence of the electronic structure of FeSe1−xTex. While the HRPES spectra near EF can be explained by renormalization of one-particle electronic state, the feature around 2 eV cannot be easily explained by the band structure calculations, especially for FeSe featuring a distinct gap in the calculated DOS. According to LDA + DMFT studies, the structure B is attributed to the lower Hubbard band, and its energy is related to the on-site Coulomb energy U [17]. The observation that feature B is located at nearly the same energy in the valence-band spectra of FeSe and FeSe0.5Te0.5 (figure 2(a)) indicates an important role of electron correlations. At higher x values, feature B becomes less distinctive and can not be discerned for FeTe. On the other hand, resonant IPES shows the intensity variation across the Fe 3p–3d threshold in FeSe and FeTe characteristic of the resonance behavior, indicating the localized nature of the states. Since the LDA + DMFT studies predict a structure that can be attributed to the upper Hubbard band above EF, it may be interesting to consider electron correlation effects from a combination of PES and IPES spectra for FeSe, as shown in figure 6. We find that the energy separation of the two structures, which provides a rough estimate of the on-site Coulomb energy, is ∼3.5 eV. A similar on-site Coulomb energy was derived from the same procedure for other Fe chalcogenides [40]. The value of ∼3.5 eV for FeSe is close to the value U ∼ 4 eV obtained from XAS and XES studies of FeSe1−xTex (x = 0.5 and 0.7) [19].

Figure 6. PES spectrum measured with the He II resonance line and IPES spectrum measured with an incident electron energy of 40 eV for FeSe.
Download figure:
Standard imageThese observations are consistent with the experimental studies that revealed the distinctive physical properties of FeSe; these properties differ from those of other iron pnictide superconductors. X-band electron paramagnetic resonance and 125Te and 77Se NMR measurements on FeSe0.42Te0.58 indicate the coexistence of intrinsic localized and itinerant electronic states [41]. The Seebeck coefficient curves of Fe1+xTe1−ySey samples exhibit a different shape from those of other Fe-based superconducting families [42, 43]. Infrared spectroscopy results suggest that the normal-state electronic response along the c-axis is incoherent, in contrast to the coherent interlayer responses for SrFe2As2 and Ba1−xKxFe2As2, but resembles those of slightly underdoped cuprates [44].
4. Summary
We have performed SXPES, HRPES and IPES measurements to investigate the composition dependence of the electronic structure of FeSe1−xTex compounds. The 2 eV feature in the valence band spectra of FeSe, which was ascribed to the lower Hubbard band, become less prominent with increasing x. The peak near EF splits into two features, which can be explained by band structure calculations considering renormalization of electrons. This leads to a drastic intensity variation at EF, with a pseudogap and a very small intensity at EF in FeSe and the metallic Fermi edge in FeTe. IPES shows two structures near EF and around 6 eV above EF. The former can be related to the Fe 3d states hybridized with chalcogenide p states, while the latter can be ascribed to a combination of plane-wave-like and Se d components. The dependences of IPES intensities on the incident electron energy for FeSe and FeTe show a clear resonance indicating localized nature of the states, but with a different profile between FeSe and FeTe that may reflect the difference in their electronic structures. By combining the PES and IPES data the on-site Coulomb energy was estimated at 3.5 eV for FeSe.
Acknowledgments
We thank M Fukui and Y Nakamura for their help with the PES measurements. This study was partially supported by Grants-in-Aid for Scientific Research on Innovative Areas 'Heavy Electrons' (no. 20102002 and no. 20102003) from the Ministry of Education, Culture, Sports, Science, and Technology of Japan (MEXT). The SXPES studies at SPring-8 were conducted under the proposals 2009A1515 and 2009B1757. The IPES studies at HiSOR were conducted under the proposals 10-B-10 and 10-B-19.