


Abstract
When the shear stress on a compliant surface exceeds the yield strength of the material, a periodic wrinkle pattern is often observed. This phenomenon has been also recognized at the nanometer scale on polymers, metals, ionic crystals and semiconductors. In those cases, the mechanical stress can be efficiently provided by a sharp indenter elastically driven at constant velocity along the surface. Here we suggest that the formation of such surface ripples can be explained by the competition between the driving spring force and the plastic response of the substrate. In particular, we show how the ripples are expected to disappear when the indentation rate is below a critical value or, alternatively, when the sliding velocity or the lateral stiffness of the contact are too high. The model results are compared to atomic force microscopy experiments on a solvent-enriched polystyrene surface, where the rippling formation is enhanced at room temperature, compared to bulk melts. A similar approach could be employed to describe rippling phenomena on larger scales.
Export citation and abstract BibTeX RIS

Content from this work may be used under the terms of the Creative Commons Attribution 3.0 licence. Any further distribution of this work must maintain attribution to the author(s) and the title of the work, journal citation and DOI.
1. Introduction
Different plastic instabilities of polymeric surfaces under direct contact of an external slider have been observed at various wavelengths. For the case first discussed by Schallamach [1], waves develop within the contact region of a rigid sphere and are due to the inability of the surface to sustain high shear forces [2]. Other types of plastic deformation might regard for instance the formation of wrinkles around the area of contact during periods when the slider is stuck [3]. For an overview on these and related processes, the reader is referred to a recent review by Li et al [4]. On the nanoscale, the formation of wavy ripple patterns on compliant surfaces has been frequently reported in atomic force microscopy (AFM) measurements in contact mode [5–17]. In this case, the ripple periodicity λ is found to be slightly larger than the size of the tip apex, and strongly influenced by external conditions such as normal force, scan velocity and temperature [13, 17–19], while none of the two aforementioned macroscopic processes has been observed. Various models have been proposed to explain the occurrence of the nanopatterns. Elkaakour et al assumed that the surface rippling of polymers is caused by a peeling process in which the material is pushed ahead of the contact by crack propagation [6]. This hypothesis was recently revisited by Rice et al [17], who ruled out the presence of peeling effects on copolymers locally heated and scraped by a dedicated 'hot tip' AFM. Filippov et al reproduced various ripple patterns on ionic crystals assuming that the substrate is removed atom-by-atom and randomly displaced aside at an angle depending on the tip shape [20]. In the latter model the elastic spring restoring the tip in real AFM experiments was also introduced. It is quite remarkable that, in wearless sliding on a rigid crystal lattice the spring constant k discriminates between stick-slip motion and continuous sliding, as first recognized by Prandtl [21]. Assuming that the tip is initially pinned in a minimum of the periodic surface potential, a jump will occur, and stick-slip will be observed, when the spring force reaches a critical value, provided that k is small enough. In this case the periodicity of the lateral force FL acting on the spring coincides with the lattice constant a of the surface potential or with integer multiples of it [22, 23]. Previous measurements on ionic crystals showed that stick-slip also occurs when the ripples are formed [10], which suggests interesting relations between the two phenomena.
Here we exploit this analogy and adapt the Prandtl model to describe the ripple evolution. The atomic structure of the substrate is not considered, which makes our continuum model more suitable for the description of polymeric materials. On the other side, we introduce an indentation rate N, which varies upon penetration of the tip in the underlying material. Once the time dependence N(t) and the width of the indenter are known, we will show how the rippling process is governed by the scan velocity v and k only. As a result, the ripple periodicity λ and amplitude A are found to increase if N increases from a critical value Nc or, vice versa, if v or k decrease down to critical values vc and kc respectively. Beyond these values, the ripples disappear.
2. Experimental
In order to verify the predictions of our model we have performed some experiments on relatively thick polystyrene (PS) films (∼400 nm). The films were prepared by spincoating (3000 rpm, 60 s) dilute solutions of polystyrene (325,000 g mol −1, PDI  , Polymer Source) in toluene (Merck 99.9%, HPLC grade) onto silicon wafers covered by a native oxide layer (∼2 nm). To allow fast ripple formation, samples were used as-spincoated without any thermal annealing for complete solvent removal [14]. The molecular weight Mw was chosen to be large, in order to create a sample prone to forming ripples compared with films of low Mw where different wear mechanisms can be observed [24, 25]. Realistic parameter values to be employed in the model were obtained from measuring the friction force during patterning formation by means of a silicon tip.
AFM patterning and imaging was performed at room temperature (RT) with a Ntegra Prima system (NT-MDT) configured both in contact (for ripple patterning) and in intermittent-contact mode (for final imaging). Silicon cantilevers holding integrated sharp tips (NSG01) were used. These sensors have a nominal spring constant of 5.1 N m −1 and tip radius below 10 nm. The normal and lateral forces in the Ntegra Prima system were calibrated using the standard procedure reported in [26]. The indentation measurements were performed with a prototype AFM setup. The electronics and the software used for control and acquisition were both developed in house at INO-CNR. The head is a commercial standalone system (NT-MDT Smena), where the cantilever is moved with respect to a fixed sample. The tip used for this work was a silicon one (Budget Sensors, TAP300Al-G, nominal k = 40 N m −1 and tip radius below 10 nm).
3. Model
In our approach, a point mass representing the tip apex is moved at constant v along a straight line. Neglecting the material displaced aside, we assume that the surface profile  at the time t is indented by a Gaussian of half-width σ centered at the tip location
  determined below. To account for the material piled up ahead and behind the tip we also assume that the surface grows in a similar way at the distances
  from x0. The overall time evolution of
  is thus described by the equation

where N is the growth factor of the surface (in nm s −1), as shown in figure 1(a). This shape is suggested by the typical footprints left by the tip when indenting the polymer without scanning (see figures 1(b)–(c)). The factor  corresponds to the assumption that the mass density remains constant in the indentation, as observed in a plastic deformation (section 6.2 in [27]), and no debris is displaced far away from the indentation site. To this end, we note that the yield strength of PS is in the order of few tens of MPa [28] and the average normal stress, in the conditions of the measurements described below, is in the order of 1 GPa. Thus, the assumption of fully plastic deformation is justified (provided that the 'residence time' of the tip is not too large, see below). It is also interesting to observe that, in a corresponding three-dimensional problem, the prefactor in the last two terms of equation (1) would be approximately equal to 1/5, as demonstrated in section A.1.1, consistently with the experimental profiles in figures 1(b)–(c). A more accurate (material-dependent) characterization of the pile-up profiles, which were neglected in early models of nanoindentation [29], can be achieved using finite or boundary element methods (see e.g. [30]). As a result, the pile-up process is generally found to be enhanced if the deformation is fully plastic. Furthermore, the pile-up profile may change during the indentation, which is not the case in our simple model.
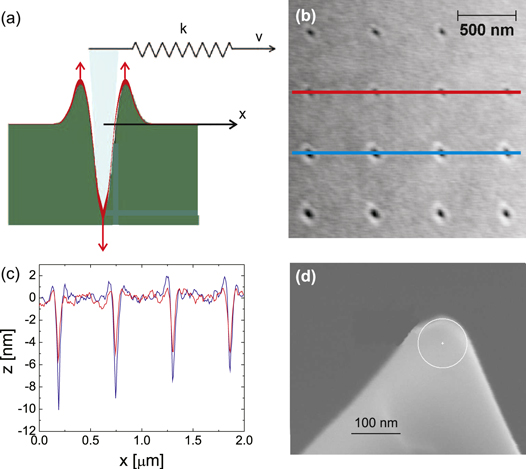
Figure 1. (a) Sketch of the Prandtl model applied to the formation of surface ripples. At a given time t a rigid tip (in light blue), which is laterally pulled by a spring of stiffness k driven at a velocity v, is indenting a compliant surface, the profile of which evolves according to equation (1). (b) Solvent-enriched PS surface after indentation with normal forces of 400 nN (upper two rows) and 1200 nN (lower two rows). Note that the tip was completely retracted after each indentation. (c) Height profiles corresponding to the red and blue lines in (b). (d) SEM image of a tip after repeated indentations on the PS surface.
Download figure:
Standard image High-resolution imageAt the same time, the tip is elastically pulled by a lateral spring with stiffness k in a potential  describing the tip-surface interaction. The total potential thus reads

where the second term is the variable strain energy stored in the spring. If the scan velocity v is sufficiently low, the tip is locked in the equilibrium position  defined by the conditions
  and
and  . In the case of atomic-scale stick-slip, Uint depends only on the x coordinate but not on the time t. In our case we assume that the interaction potential resembles the surface profile
  , so that

where N0 is the growth rate of Uint, expressed in Js−1. This can be understood observing that the surface acts as a repulsive energy barrier in the normal direction, the position of which changes with time according to the indentation rate.
4. Results and discussion
We have studied the time evolution of the potential profile  numerically by solving the equations (1) and (3), with
  defined as the minimum of the total potential (2) at the time t. The parameters N, v and k have been varied in a range of values consistent with AFM measurements on the PS surface. Figure 2 shows an AFM topography and a lateral force map acquired while scanning 250 parallel lines of 10 μm with a normal force FN = 530 nN. A very regular ripple pattern with
  nm and
  nm is visible in figure 2(a), and the stick-slip motion of the tip (with the same periodicity) is recognized in the lateral force profile in figure 2(b). The scan velocity was set to v = 10 μm s −1 during the measurements. The half-width of the tip apex is in the order of
  nm, as seen in SEM images of tips with nominal radius of 10 nm (similar to the one used in figure 2) after repeated indentation of the polymer surface with normal forces of few hundreds nN (see figure 1(d)). According to the Prandtl model with a fixed interaction potential, k is approximately given by the slope of the lateral force versus distance curves when the tip is trapped in a minimum of the total potential. Assuming that this is also the case here, a value of
  N m −1 is obtained from the profile in figure 2(b). The indentation rate can be estimated as the ratio of the amplitude
  nm of the ripple pattern to the time
  ms spent by the tip in each pit. In this way
  nm s −1. To estimate the work carried out during indentation we use another formula in the Prandtl model, according to which the energy amplitude U0 is related to the peak value of the lateral force
  and the spatial periodicity λ of the stick-slip by
  . Assuming again that this formula can be extended to the present case, we estimate
  nm and
  nN from the profile in figure 2(b), so that
  J. Dividing this quantity by A = 2 nm and multiplying by the value of N obtained above, we finally get
  J s −1.

Figure 2. (a) AFM topography image (10×10 μm2) and (b) corresponding lateral force pattern accompanying the formation of ripples on a solvent-enriched PS surface with a normal force FN = 530 nN and a scan velocity v = 10 μm s −1. Cross-sections corresponding to the yellow lines in (a–b) are shown in the insets.
Download figure:
Standard image High-resolution imageA ripple profile, obtained by numeric integration of equations (1)–(3) with parameter values consistent with the experiment, is shown in figure 3(a). The ripples have an amplitude A = 1.3 nm and a periodicity  nm. The tip, while indented into the surface with a normal force FN, builds up two mounds ahead and behind the indentation pit. At the same time the lateral force increases since the spring is constantly elongated. If the elongation reaches a certain threshold (depending on the amplitude of the ripples) the equilibrium becomes unstable, the tip suddenly hops beyond the mound ahead, and sticks again into a new equilibrium position on the surface. This process is repeated several times. If N is decreased by a factor 10, the ripple pattern disappears, as shown in figure 3(b). In this case the depth of the indentation pit and the height of the side hills are too low to prevent lateral motion, and the tip continuously follows the support. Consequently, no ripples are formed and only two pairs of pits with corresponding mounds at the beginning and the end of the scanned line are left as a result. This mechanism has a certain analogy with the transition from stick-slip to continuous sliding observed in atomic-scale friction experiments when the normal force is reduced below a critical value [31].

Figure 3. Surface profiles obtained by numeric integrations of the equations (2) and (3) with a lateral stiffness k = 2 N m −1, a tip half-width  nm, a scan velocity v = 10 μm s −1, and an indentation rate (a) N = 100 nm s −1, (b) N = 10 nm s −1, (c) N = 250 nm s −1.
Download figure:
Standard image High-resolution imageIn figure 4 we show the change in the amplitude and periodicity of the ripples upon systematic variation in N, v and k. The ripples appear only if  ,
,  and
and  . Note that the critical values correspond to a periodicity
  nm, which is the distance between the two peaks in figure 1(a). Beyond these values, i.e. when the indentation rate is too low, the scan velocity is too high, or the driving spring is too stiff, the ripples are not formed, and the surface profile remains almost unperturbed (figure 3(b)). As shown in section A.1.2 it can be proven that an approximate condition for ripple appearance is
  . The critical values Nc, vc and kc defined by this relation are consistent with those in figure 4. Note also that the transition to the state of continuous sliding is sharp, and not continuous as in the case of atomic-scale friction [31]. The size
  of the trace left by an indentation represents a strict lower bound for the ripple formation. Far enough from the critical values, the patterns produced in two consecutive stick phases, resembling the profiles in figure 1(a), are less and less overlapping, so that the maximum height of the resulting profile (dashed curves in figure 4) differs from the corrugation of the profile divided by two (continuous curves). The corrugation can even decrease in the regions indicated by the arrows in figure 4, until the overlap between consecutive stick phases becomes negligibile and a series of well-separated 'bumps' is left on the surface (figure 3(c)).

Figure 4. Ripple periodicity (left column) and ripple amplitude (right column, continuous curves) as a function of (a) the indentation rate N, (b) the sliding velocity v and (c) the lateral stiffness k with the other parametrs kept fixed at the same values of figure 3(a). When the critical values corresponding to the vertical lines are reached, the ripple pattern suddenly disappears. In the right column the maximum height (dashed curves) of the surface profiles is also shown.
Download figure:
Standard image High-resolution imageNote that, as a first step in the model, we have assumed that the indentation rate N is constant, while indentation experiments on PS have shown that N decreases with the time of residence tres of the tip at a given location on the surface [32]. However, the typical time scales by which the penetration depth saturates with normal forces of few hundreds of nN are in the order of  s (see also section A.1.3). This time is three orders of magnitude larger than the typical residence time of the tip when the ripples are formed (tens of ms, as discussed above), meaning that N can be supposed to be constant as long as
  10 nm s −1. Experiments on polymers have also shown that the
  dependence is approximately linear [33]. A proportionality relation between FN, λ and A is also attested by experimental works in the literature [16, 34]. We have also observed this behavior on the solvent enriched PS surface, as shown in figure 5(a). In this case, the ripples are formed only if
  nN. According to the previous discussion, the experimental value of
  nm suggests that the tip has a radius of about
  nm, consistently with the SEM images in figure 1(d). The corrugation is also found to increase linearly starting from a value of about 0.3 nm so that the linear dependence of λ and A on the indentation rate
  in figure 4(a) appears validated.

Figure 5. Experimental variation of the ripple periodicity (left column) and ripple amplitude (right column) as a function of (a) the normal force FN (with v = 10 μm s −1) and (b) the sliding velocity v (with FN = 270 nN). Linear fits are also shown till the data points where the ripple pattern becomes unstable.
Download figure:
Standard image High-resolution imageThe velocity dependence of the ripple formation has been also tested experimentally (figure 5(b)). In this case we observe a slight decrease of λ with v up to  μm s −1. Above this value, corresponding again to
  nm, the ripples are not formed. More pronounced is the decrease of A with v in qualitative agreement with recent results by Sun et al in the same force and Mw regime [25]. The ripples disappear when
  nm. On the other side our simple model would predict an indefinite increase of A when
  . This is not realistic, since the actual indentation rate decays on long time scales, which would rather lead to a 'saturation' of the ripple pattern.
Regarding the spring constant, we remark that  is obtained by adding up different compliances associated to the cantilever torsion and, most important, to the lateral deformation of tip and substrate in the contact region [35, 36]. Using AFM probes with different stiffness is thus not a suitable method to check this dependence. Nevertheless, a dramatic increase in λ has been reported when the polymer surfaces are heated above their glass transition temperature [18, 19], which significantly reduces the material stiffness. This is in qualitative agreement with the results in figure 4(c). For a quantitative correspondence between λ and material properties of the polymer, such as the shear modulus, one should introduce a temperature-dependent damping term in the model, representing the viscous properties of the material, which goes beyond the goals of this work.
5. Conclusions
To summarize, we have interpreted the surface rippling observed when a sharp nanotip slides on a compliant surface by introducing a variable interaction potential Uint, resembling the surface profile, in the Prandtl model. The ripples disappear if the sliding velocity v or the lateral contact stiffness k are increased, or the indentation rate N is decreased beyond critical values. The transition occurs when the ripple periodicity, which depends almost linearly on N, v and k, is twice as large as the tip apex. This is in a agreement with AFM measurements on a PS surface at variable loads, and at variable velocities, although a precise comparison between model and experiments in hindered by the one-dimensional character of the model and the (feedback-dependent) relation between normal force and indentation rate. Even if our experiment has been conducted on a polymer surface, the same approach, with a proper indentation law, could be used to describe the evolution of other systems where similar rippling processes are observed (e.g. metals, ionic crystals [10] and semiconductors [15]). On larger scales, the analytical model that we propose would be also useful to understand phenomena such as the rippling of unpaved roads, ski slopes and rail tracks.
Acknowledgments
The Spanish Ministry of Economy and Competitiveness (Project No. MAT2012-38810) is gratefully acknowledged for financial support. This work is supported in part by COST Action MP1303.
Appendix
A.1.1. Indentation law in a three-dimensional problem
It is interesting to see how equation (1) is modified in the equivalent three-dimensional problem. In this case the ratio α between the height of the material piled-up around the indentation pit and the indentation depth, is determined by the equation

stating that the total volume is conserved in the indentation. The solution of equation (4) is
where  is the error function. The corresponding pattern is shown in figure 6.
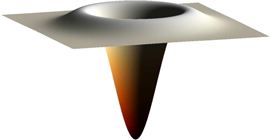
Figure 6. Tip 'footprint' determined as described in the text. The material piled up and the indentation pit have the same volume.
Download figure:
Standard image High-resolution imageA.1.2. Criterion for ripple appearance
A simple criterion for estimating the critical values of N, v and k (with the other two parameters fixed) is the following. At the time t, assuming that the tip does not move laterally, the second derivative of the interaction potential, with respect to x, at the tip location is
This value has to be compared with the corresponding derivative of the parabolic spring potential, which is simply equal to k. According to the Prandtl model, stick-slip is expected if  . The order of magnitude of the time t at which the comparison can be done is
  , which is the time that the tip would spend to form and overcome the first ripple. If N0, v and σ have the same value as in figure 4(c), we get kc = 1.57 N m −1, which is slightly lower than the value obtained numerically (
 N s −1). Similar conclusions hold for the critical values Nc and vc.
A.1.3. Experimental indentation rate
We have tried to determine the indentation rate N of the polymer surface when a normal force FN is suddenly applied to the tip. The result corresponding to FN = 100 nN, is shown in figure 7. The strain keeps growing (viscously) at an exponentially decreasing rate. Qualitatively, the decay is explained by the fact that the contact area continuously increases, and the average pressure decreases, when the tip sinks into the material. At a certain point, the fraction of the contact area which gets plastically deformed will start shrinking, and the indentation process will slow down. In our case, the time constant of the exponential decrease is about 5 s. This response, which is typical of viscoplastic materials, does not allow us to draw any conclusion on the time scale of 10 ms, which is approximately the time spent by the tip to indent the material when the ripples are formed.

Figure 7. Indentation depth versus time as measured when the tip is pushed against the PS surface by a normal force of 100 nN.
Download figure:
Standard image High-resolution image