


Abstract
Three A4C60 compounds, with A = Li, Na and K, have been studied by impedance spectroscopy between 100 and 293 K at pressures up to 2 GPa. The results are in very good agreement with earlier dc resistance studies and with data from the literature. For all three materials the measured conductivity can be fitted by a sum of at least two Arrhenius terms. The band gaps derived from the resistance data, 0.3 eV for Na4C60 and 0.5 eV for K4C60, are in excellent agreement with data measured by other methods. For Li4C60, our results disagree with a recent suggestion that the conductivity is dominated by ionic conduction. Although a certain ionic component probably exists we suggest that electronic transport dominates in our samples at and below room temperature because the derived 'activation energy' decreases under pressure, the derived 'activation volume' is negative, and we observe neither a significant electrode blocking capacitance nor any significant metal transport under dc conditions.
Export citation and abstract BibTeX RIS

Content from this work may be used under the terms of the Creative Commons Attribution 3.0 licence. Any further distribution of this work must maintain attribution to the author(s) and the title of the work, journal citation and DOI.
1. Introduction
The alkali fullerides A4C60, where A is an alkali metal, show a large variability in their structural and transport properties. Because charge transfer is believed to be close to one electron per metal ion and the conduction band of C60 accommodates six electrons per molecule, all compounds AxC60 with 0 < x < 6 should be metallic. Such is indeed the case for most fullerides with x ≤ 3, some of which are even excellent superconductors [1]. However, for A = 4 structural effects strongly modify the electronic properties. Li4C60 has a unique two-dimensional quasi-tetragonal polymeric structure [2] with different intermolecular bonding motifs in different in-plane directions. Its fullerene skeleton consists of parallel one-dimensional chains of C60 molecules, internally bonded by [2 + 2] cycloaddition and cross-connected by single covalent C–C interchain bonds. The material was recently identified as a superionic Li+ conductor [3] at room temperature, while at very high temperatures (>580 K) it transforms into a metallic phase [4, 5]. Na4C60 has another unique polymeric structure [6] and is the only known two-dimensional C60 polymer with single covalent C–C intermolecular bonds. Because its measured susceptibility cannot be fitted by standard models it was initially identified as a strongly correlated metal, although calculations and experiments [7] show a band gap near 0.25 eV. The heavier K and Rb compounds lack interfullerene bonds and have body-centered tetragonal structures with merohedral disorder. Although the electron density suggests a metallic state, a strong Jahn–Teller effect [8] causes small band gaps; as discussed by Brouet et al [9], two different gaps are involved, a 'spin' gap near 50–100 meV seen by NMR and ESR and a second 'optical' gap near 500 meV seen by optical probes.
We have previously studied the electrical properties of A4C60 under pressures up to 2 GPa for A = Li, Na, K and Rb using a dc four-probe method [10–13]. The results were surprisingly similar, always showing an Arrhenius behavior, and the band gaps or excitation energies found were in good agreement with literature data. However, the measured conductivity often increased irreversibly by up to an order of magnitude during the experiment, particularly during or after heating to above 350 K, and to our surprise all excitation energies and band gaps decreased and both ionic and electronic conductivities increased on compression. Although the changes in conductivity magnitude might be due to changes in the sample geometry there remained possibilities that the results were modified by deintercalation due to heating, ionic electrotransport, or both.
We present here new data for the resistivity of A4C60 under pressure for A = Li, Na and K, measured by ac impedance spectroscopy. Using an ac method in a mechanically very stable experimental set-up proved to yield very stable and repeatable results, and the derived transport parameters (excitation energies and/or band gaps) were very similar to those found earlier. This confirms that the large changes in magnitude observed earlier were experimental artifacts caused mainly by deformation of the samples. To investigate ionic transport in Li4C60 further we also carried out a simple dc experiment, driving a small dc current through a sample sandwiched between lithium electrodes. After 50 h, no change was detected in the relative weights of the electrodes, showing that most of the current was carried by electrons rather than Li+ ions.
2. Experimental details
2.1. Sample materials
The synthesis procedures were similar to those used in our earlier studies [10–13]. All samples were synthesized from sublimed, nominally 99.9% pure C60 obtained from Term USA, CA, USA, in an argon-filled glove-box with sub-ppm levels of O2 and H2O. Nearly stoichiometric amounts of alkali metal and C60 were placed in closed stainless steel containers and kept at 300–350 °C for 2–5 weeks, with intermediate grinding to improve homogeneity. A small excess of alkali metal was used to compensate for evaporation loss and to ensure that no metallic AxC60 with x ≤ 3 was formed; the possible formation of a small amount of randomly dispersed grains of (insulating) A6C60 should not influence the results significantly. Synthesis of the last batch of Li4C60 was initially unsuccessful because nitrides formed on cooling due to a significant level of N2 in the box, but after thorough purging with Ar no further problems were found. The samples were characterized by Raman scattering and x-ray diffraction, with results in very good agreement with those from earlier investigations [2, 6, 10–13]. All fulleride samples were transferred into high pressure cells in the glove-box. For comparison purposes several test and verification measurements were also made on commercial graphite powder (Kebo, Sweden), using the same equipment and methods.
2.2. Equipment
The pressure cells were identical to those used in our recent studies [14] of the superionic conductor LiBH4, except that no internal heaters were used. Weighted powder samples were sandwiched between two cylindrical stainless steel electrodes, 6 mm in diameter. The amount of material was calculated from x-ray densities to give a thickness of about 1.5 mm after compaction. In two experiments alkali metal sheets were inserted between the sample and the stainless steel electrodes. Thin sheets (<1 mm) of Li or Na metal, respectively, were cut with a razor blade and formed into circular disks, 6 mm in diameter, using a punch. One disc was inserted on each side between the sample and the electrode. Pressure was applied in piston-cylinder devices with internal diameters of 45 mm and the load was supplied by hydraulic presses. Values for the pressure, p, were calculated from the load using an empirical function obtained using a manganin pressure gauge calibrated against the Hg melting line [15]. The cylinders could either be cooled using liquid nitrogen or heated electrically and the temperature, T, was measured using a calibrated type K thermocouple close to the upper electrode.
The ac impedance was measured using electronic bridges. For the experiment on K4C60 and the first two experiments on Li4C60 we used an Agilent E4980A precision LCR meter, while for the experiments on Na4C60 and the remaining experiments on Li4C60 we used the same Solartron SI 1260A impedance/gain-phase analyzer as in our recent study on LiBH4 [14]. No differences were observed between results obtained with different bridges. The standard four-probe geometry was used with signals carried by coaxial cables as near to the pressure cell as possible; inside the (steel) cell, however, unshielded wires were used. These were kept as short, straight and far apart as possible to minimize stray impedances. For one Li4C60 sample a broken wire led to a three-wire configuration with a single contact to the upper electrode. Apart from a higher apparent resistance this did not cause any significant deviation from the results for other samples.
For one Li4C60 sample the dc resistance was measured as a function of time during 50 h at 293 K and 0.1 GPa, using a cell identical to those described above. A constant current of 1.00 mA was provided by a Kepco BOP 36-1.5 power supply in constant current mode and the voltage over the sample was measured using an Agilent 34970A data acquisition unit.
2.3. Experimental and analytic methods
Measurements were carried out at 3–4 low spot frequencies at closely spaced intervals in T and/or p, but also over wide ranges in frequency f (20 Hz–1 MHz for the Agilent bridge, 1 Hz–3 MHz for the Solartron bridge) at larger intervals in T (or p). The pressure was always increased to 100 MPa before the first measurements to compact the powder sample into a solid disk, and always changed near room temperature. At selected pressures, nominally isobaric low temperature runs were carried out by slow cooling to 85–110 K, then allowing the system to warm up overnight. An electric heater was used to increase the heating rate above 270 K.
The sample impedance Z was modeled as a parallel combination of a resistance R and a capacitance C, and values for R, C and frequency f were read from the bridge at each measurement. The data were used to calculate the complex impedance Z, which we here define as Z = Z' − jZ''. Expressions for the real and imaginary parts of Z are easily found from circuit theory [16]. As in the case of LiBH4 [14] we plotted Z'' as a function of Z' (Cole–Cole plots [16]) and for large values of R the results usually fell on a semicircle (or, in practice, often a semi-ellipse) with one end, corresponding to infinite frequency, at the origin and the other end defining the dc value of R, Rdc. Although measurements over a limited frequency range define only part of this arc a reasonably accurate value for Rdc can still be extracted by this procedure from a simple extrapolation or curve fit.
For ionic conductivity the situation is more complicated. Alkali metal ions do not enter stainless steel and thus pile up close to the electrode surface, effectively forming a charged capacitor. For very high frequencies or low mobilities only few ions reach the electrodes during each cycle and the data are similar to those found for electronic conduction. However, for low frequencies or high mobilities the electrodes block ionic transport. This is usually modeled as a second parallel R–C combination in series with that representing the sample, causing a second semicircle adjacent to the original one in the Cole–Cole plot. If both the resistance and the capacitance of the 'electrode' part are much larger than those of the sample the two arcs will be well defined and Rdc can be found from the osculation point. In our earlier study on LiBH4 [14] the continuous development from single- to double-arc plots during the transformation from the insulating to the superionic phase was very clear and we refer the reader to that work for details.
All measured resistance data show a basic Arrhenius behavior, usually described by

Here ρ is the resistivity and m is a constant, 0 ≤ m ≤ 1, whose value depends on the model used in the derivation of the expression [17]. As in our earlier studies we find that at least two conduction channels are needed to describe the results and we have thus fitted a function

to our data for the conductance G = R−1, assuming that changes in the sample geometry can be neglected compared to the dependence on T. Equation (2) has been fitted to the experimental data for G using both m = 0 and m = 1. The qualities of the fits were indistinguishable, and we have chosen to present here the data obtained for m = 0 to enable a direct comparison with data from earlier investigations [3, 11–13]. Using m = 1 gave 10–15% higher values for the parameters B and D, and we will also give alternative values obtained using this model.
3. Experimental results and discussion
3.1. Li4C60
The results for the three materials were surprisingly similar in view of their very different structures. Because of these similarities we will first present the results for Li4C60 in detail and later present the results for Na4C60 and K4C60 more briefly, concentrating on similarities and differences. Li4C60 is of particular interest because it was recently identified as a superionic conductor with possible applications in future battery technology [3]. However, we recently found that the observed pressure dependence of its resistance was difficult to reconcile with a dominant ionic conductivity [12]. We will show below that although many of our results agree very well with those of Riccò et al [3] and can clearly be interpreted in terms of ionic conductivity, other results point to an electronic origin of the observed transport properties.
We begin with the very last experiment in this project. After carrying out a number of ac transport studies under pressure on three different fullerides and several graphite composites, we made a very simple dc transport experiment on Li4C60. Using the same set-up as in the ac measurements we inserted two sheets of freshly cut lithium metal with known masses between the sample and the steel electrodes. The sample was compressed to 0.1 GPa at 293 K and a constant current of 1 mA, equivalent to a current density of 3.5 mA cm−2, was allowed to flow for 50 h. The resistance of the sample was monitored during the experiment by measuring the voltage drop and is shown as a function of time in figure 1.

Figure 1. Measured resistance R as a function of time for a Li4C sample carrying a dc current of 1 mA.
Download figure:
Standard image High-resolution imageThe initial resistance is approximately 10 Ω, in excellent agreement with values found in the ac measurements under the same conditions. The resistance rises approximately linearly with time for about 25 h, then drops exponentially to less than 3% of its initial value after 50 h. We initially attributed the rapid drop in R to the formation of metallic dendrites by ionic transport. However, disassembling the cell in a glove-box after the experiment we found that not only the weight of the Li4C60 sample (80 mg) but also the weights of the lithium electrodes were unchanged within the experimental uncertainty (±1 mg). A very thin cylindrical sheet of lithium metal had formed from the negative electrode along the Teflon™ wall and was probably responsible for shorting the cell, but its mass was estimated from the dimensions to be well below 1 mg.
Although this is a very simple-minded experiment the results clearly show that Li+ ions indeed do move in an electric field, but prefer to do so outside the sample. The fact that the Li electrodes keep their original weight ratio indicates that little dc ionic conduction takes place; it should be noted that a current of 1 mA running for 50 h corresponds to transport of more than 13 mg of lithium from one electrode to the other if the current is carried by Li+ ions only. The observed resistance rise can be interpreted in several ways. One possibility is the formation of oxides or other resistive surface or interface layers. Another possibility is ion transport into or out of the sample; we note that a complete conversion of the Li4C60 sample into Li2C60 or Li6C60 would require only 1.5 mg of lithium, which is near the error limits for the measured masses. It is also possible that ionic relocation inside the sample results in a Li+ concentration gradient and thus a stratified material with, say, Li2C60 near the positive electrode and Li6C60 near the negative one. From the measured masses we conclude that at least 80–90% of the current through the sample in this experiment must have been electronic in origin. It is possible that barriers such as oxide or nitride films may have formed on the electrodes during cell assembly, but because lithium is very soft, a pressure of 0.1 GPa should be sufficient to break most such films against the hard Li4C60 grains. It might also be argued that perhaps the sample composition differed from that used in the ac experiments, but because the material was taken from the same closed container, stored under argon, and the actual initial resistances agreed very well, this is unlikely. While this experiment is far from conclusive it suggests that although both electronic and ionic transport have indeed been observed, electrons clearly carry the largest fraction of the total current.
Turning now to the ac impedance data for Li4C60, figure 2 shows a typical Cole–Cole plot [16] of the imaginary part of the sample impedance, Z'', as a function of the real part, Z'. (A very similar plot, measured at higher temperatures, is given by Riccò et al [3].) The sample resistance R is defined by the upper end of the arcs formed, and its strong (exponential) temperature dependence is obvious. Complete curves such as these were only found from low temperature data. At higher temperatures the available frequency range was not sufficiently wide to show the low-Z' part of the arc, and for temperatures above 200 K (R < 500 Ω) the data form short, practically vertical (constant R ≈ Z') lines, often showing a large scatter or twisting into a closed curve or a spiral. This behavior is probably due to parasitic capacitances and inductances in the measurement circuit. No minima in Z'', such as those observed in our previous study on LiBH4 [14], were found in this work. However, the results clearly show that the low-frequency data (f < 100 Hz) give reliable values for R.

Figure 2. Cole–Cole-plot showing the imaginary part Z'' of the total impedance as a function of the real part, Z'. Data were measured on a Li4C60 sample at 0.1 GPa at three temperatures: blue dots 91 K, red squares 101 K and green triangles 111 K.
Download figure:
Standard image High-resolution imageAnother way to show the frequency dependence of Z is to plot Z'' as a function of f in a log–log plot as in figure 3, using the same data as in figure 2. The data are superficially very similar to those shown in the range 190–246 K by Riccò et al [3]. However, in contrast to the Debye behavior (Z'' ∝ f below and ∝ f−1 above the relaxation peak) found by Riccò et al near 100 K our material shows Z'' ∝ f±α, with α ≈ 0.6. Such a stretched exponential relaxation behavior is often interpreted in terms of a distribution of relaxation times rather than a single one. Assuming that the relaxation times depend on the temperature as τ ∝ exp(Dτ/T) we find Dτ ≈ 9.8×10² K from the positions of the peaks [3]; we can convert this into an activation energy Ea = kBDτ ≈ 84 meV.

Figure 3. Imaginary part of the total impedance, Z'', as a function of frequency. Symbols denote the same temperatures as in figure 2. The fitted curve shown has low- and high-frequency slopes of ±0.6 (see text).
Download figure:
Standard image High-resolution imageFigure 2 shows that the low-frequency resistance data accurately represent the true R in the samples, and we will use such data for the main analysis. We show in figure 4 typical results for the resistance of Li4C60 as a function of T at pressures p from 0.1 to 1.0 GPa. These data were measured at a frequency of 1 Hz, and for both increasing and decreasing pressure. The resistance changes by four orders of magnitude over a range of 200 K, and even with a logarithmic vertical axis the curves show a curvature which suggests that they should be fitted by an Arrhenius-type function such as equations (1) and (2) above.
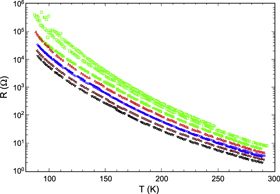
Figure 4. Resistance R of a Li4C60 sample, measured at 1 Hz, as a function of temperature, T. Symbols indicate pressures; top down, green squares 0.1 GPa, red triangles 0.3 GPa, blue circles 0.5 GPa, brown diamonds 0.75 GPa and black inverted triangles 1.0 GPa. Open symbols denote increasing pressure, filled symbols decreasing pressure.
Download figure:
Standard image High-resolution imageFigure 4 shows two features which were found to be quite general. First, all experiments showed significant hysteresis effects at low temperatures. To avoid overlap the figure shows only data obtained during cooling, except for the top curve, measured at 0.1 GPa. The hysteresis is caused by the fact that the control system keeps the load, rather than the pressure, constant. When increasing pressure and during cooling the piston continuously advances and experiments have shown that the pressure is then accurately known and, when cooling, very constant. However, on heating the thermal expansion leads to an increased internal pressure; although the load remains constant, frictional forces will reverse and the cell pressure usually increases by 100 MPa or more. Because of these effects we have only used the data obtained during cooling in our analysis.
A second obvious feature is that although data for increasing and decreasing pressure overlap almost perfectly at 0.5 GPa, this is not the case at 0.1 GPa. This pressure is slightly too low to produce a completely compacted material and the measured resistance is thus too high during the first measurement and in better agreement with data from other cycles when returning from higher pressures. This is clearly shown in figure 5, showing resistance as a function of p for another sample up to 2 GPa, for both increasing and decreasing p. Note that measurements were carried out as functions of T at 0.1, 0.5, 1.0, 1.5 and 2.0 GPa, and again at 1.0 and 0.1 GPa for decreasing p. The sections in between these temperature runs were not always measured at the same temperatures, leading to small discontinuities in the measured curve at the pressures indicated. The scatter in the 0.1 GPa measurements in figure 4 and the downward deviation from the expected curve at low temperatures during the final measurement at the same pressure are probably caused by contact problems, since wires were only kept in place by the compression force. Nonlinearities and scatter were observed at low pressure also in other experiments. Effects like the rapid initial drop by 50% from 0.1 to 0.5 GPa on compression (figure 5) and the corresponding increase on pressure release below 0.05 GPa were observed in most experiments; for the sample in figure 5 the resistance increased to >500 Ω at zero pressure. These effects are probably caused by the compression and expansion of the sample. Grain boundaries and cracks close on compression but may open again on pressure release due to elastic recovery. Taking all these factors into account, figures 4 and 5 show that the stability and reproducibility of the data were still excellent over most of the pressure range studied.
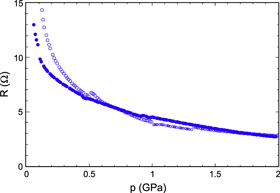
Figure 5. Resistance versus pressure near 290 K for a Li4C60 sample. Open symbols denote increasing pressure, filled symbols decreasing pressure.
Download figure:
Standard image High-resolution imageThe pressure dependence of the resistance shown in figure 5 for decreasing pressure can be very well described by a simple exponential curve, R(p) = 7.95 exp(−0.56 p), above 0.5 GPa. Below this, there is a positive deviation, slowly increasing with decreasing pressure and probably caused by the effects discussed above.
We now return to the temperature dependence of the resistance shown in figure 4. Although equation (1) should be a reasonable starting point for the analysis it could not be fitted to our data with acceptable accuracy. Guided by earlier studies [10–13] we have thus inverted our data to find the conductance G = 1/R, to which we have fitted functions of the type shown in equation (2) using both m = 0 and m = 1.
Figure 6 shows a typical curve for G(T), plotted on a logarithmic scale as a function of  In these coordinates the data basically define two straight lines, intersecting near 150 K (1/T ≈ 6.7 × 10⁻³ K−1) and corresponding to the two terms in equation (2). Using m = 0, this equation can clearly be fitted to the data with excellent accuracy to find the activation parameters B and D (here 1750 and 839 K, respectively). The total conductance G thus contains contributions from two terms, corresponding to two conduction channels with different excitation parameters.
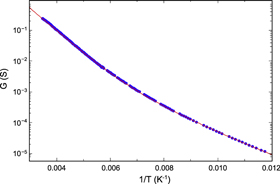
Figure 6. Conductance G = 1/R for a Li4C60 sample at 1.0 GPa, plotted as a function of inverse temperature  . The curve has been fitted using equation (2), with m = 0, B = 1750 K and D = 839 K.
Download figure:
Standard image High-resolution imageIn all, five Li4C60 samples were studied by ac impedance spectroscopy; a complete list of the samples studied is given in table 1 to help the reader follow the discussion. The first two Li4C60 samples were synthesized and studied in 2011. Sample one was considered mainly as a test and measurements were terminated at 0.5 GPa; unfortunately, measurements on the second also ended at 0.5 GPa due to experimental problems. A second batch of Li4C60 was synthesized in 2013; the pressure range available for the third sample was limited to 1 GPa, but measurements were possible over a complete pressure cycle, and for the fifth sample successful measurements could be carried out up to 2 GPa. For the fourth sample, thin lithium sheets were inserted between the sample and the electrodes. Because Li4C60 has been reported to be a superionic conductor [3] we expected the ionic flow to be blocked at the interface between the sample and the steel electrode; inserting an intermediate lithium layer we hoped to restore ionic current through the sample. Although a thin film of oxide, hydroxide and/or nitride might form immediately after cutting the metal even with sub-ppm levels of O2 and H2O (and low ppm N2) in the glove-box, we expected the fulleride grains to be hard enough to break through this film when load was applied. However, we found no significant difference between impedance measurements with and without lithium electrodes. The measured R and the fitted values for B were higher than for other samples, but the dependences on p and T were very similar. Unfortunately, a short circuit developed between the electrodes already at 0.3 GPa. Visual inspection after opening revealed no change in the lithium films except a color change to white on the sides toward the sample. This might signify the formation of oxide/hydroxide or a very Li-rich LixC60 phase, but no chemical analysis was carried out. No obvious mechanical short circuit was found but thin dendrites may possibly have formed along grain boundaries in the bulk sample. Equation (2) was fitted to the data for all five samples, using m = 0 and data for R obtained during cooling at the lowest frequencies used (20 Hz for the first two samples, 1 Hz for the last three). Care was taken to ensure that the low- and high-temperature slopes of the fitted functions were in good visual agreement with those of the data. Most results were very similar to those in figure 6 in terms of both parameter values and qualities of fit, but some early runs showed a larger scatter, or even small step changes, in resistance magnitude at low temperature which we attribute to a less stable mechanical design of the cell.
Table 1. Summary of samples and measurement conditions used in this study.
| Sample no. | Batch no. | Electrode material | Maximum pressure (GPa) | Comments |
|---|---|---|---|---|
| Li4C60 1 | 1 | Stainless steel | 0.5 | |
| Li4C60 2 | 1 | Stainless steel | 0.5 | |
| Li4C60 3 | 2 | Stainless steel | 1 | |
| Li4C60 4 | 2 | Lithium sheet | 0.3 | Short-circuited at 0.3 GPa |
| Li4C60 5 | 2 | Stainless steel | 2 | |
| Li4C60 6 | 2 | Lithium sheet | 0.1 | 1 mA dc, 50 h |
| Na4C60 1 | 1 | Sodium sheet | 0.3 | Short-circuited at 0.3 GPa |
| Na4C60 2 | 1 | Stainless steel | 1 | High-T study at 0.1 GPa |
| K4C60 1 | 1 | Stainless steel | 2 | High-T study at 2 GPa |
The results for all samples are shown in figure 7 as functions of pressure. Both fitted parameters decrease with increasing pressure; the data for B, dominant above 150 K, are quite stable and repeatable with pressure cycling, while there is a tendency for the low-temperature parameter D to decrease with both increasing and decreasing pressure. A linear fit shows that B equals 2250 K at zero pressure, decreasing under pressure with a pressure coefficient of −0.18 GPa−1. Data for different samples have slightly different magnitudes, but the pressure dependence is very similar for all samples. The data for D show a larger relative scatter, a smaller pressure coefficient and an average zero-pressure magnitude of D ≈ 1000 K. Using m = 1, i.e. fitting the same function to data for GT instead of G, results in zero-pressure values B = 2560 K and D = 1190 K. The pressure coefficient of B is almost unchanged at −0.17 GPa−1.
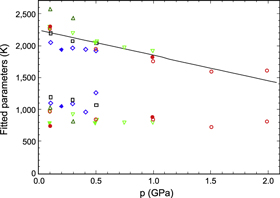
Figure 7. Fitted excitation parameters B (upper) and D (lower) from equation (2) for Li4C60, plotted as functions of pressure, p. Symbols denote different samples: blue diamonds sample 1, black squares sample 2, green inverted triangles sample 3, dark green triangles sample 4 and red circles sample 5. Open symbols denote increasing pressure, filled symbols decreasing pressure. All data shown were fitted using m = 0.
Download figure:
Standard image High-resolution imageWe can now compare our results for Li4C60 with those from other investigations. The resistivity of our material at 0.1 GPa and 293 K is (25 ± 15) Ω cm, which is intermediate between the values 100 Ω cm given by Riccò et al [3] and 8.3 Ω cm found by Yasukawa and Yamanaka [18]. Both groups analyzed their temperature dependent data using equation (1). Riccò et al [3] converted the parameter B to an activation energy Ea = kBB = 240 meV while for the data of Yasukawa and Yamanaka we find Ea = 140 meV. Both results are found in the high-temperature range above 150 K where we find B = 2250 K, or Ea = 194 meV. These results also agree well with the data from our earlier dc measurements [12, 13], which gave a value Ea = 225 meV. For comparison, Riccò et al [3] calculated an electronic band gap of 0.77 eV, and experimental data [19] suggest a similar gap. The value Ea = 84 meV obtained from the loss parameter Dτ above was derived in the low-temperature range near 100 K where equation (2) is dominated by the parameter D = 1000 K, corresponding to Ea = 86 meV, while the corresponding activation energy Ea = 209 meV found by Riccò et al [3] was measured above 190 K, in the high-temperature regime. In our earlier dc studies [12, 13] we also found a low temperature behavior characterized by Ea = 110 meV. We note further that 7Li NMR data show Li diffusion to slow down significantly on cooling from 200 to 150 K [5, 20], close to the boundary between the two temperature regimes observed in the present data. Collecting all data we thus find that above 150 K, activation energies obtained from NMR [3] (190 meV), resistivity and loss relaxation peaks are all in the range (190 ± 50) meV, while below 150 K energies near 85 meV are found from both resistivity and loss relaxation. All zero-pressure data thus form two internally consistent sets with very similar activation energies, and because high temperature 7Li NMR data also shows a sharp, motionally narrowed peak indicating rapid Li+ ion diffusion, and structural calculations show the existence of open diffusion channels for the ions, Riccò et al came to the reasonable conclusion that Li4C60 is a superionic conductor near room temperature.
For superionic conductors, another important parameter is the activation volume ΔV [21],

where Rg is the general gas constant and O(κ) a small correction of the same order of magnitude as the compressibility, κ; for Li4C60 κ should be similar to that of tetragonal C60, about 0.003 GPa−1 [22, 23], which is small enough to be neglected. The exponential pressure dependence found for the data in figure 5 implies that ΔV is constant above 0.5 GPa at ΔV = −1.37 cm3 mol−1. The data indicate a larger magnitude at the lowest pressures, but this may be due to experimental errors, as discussed above. It should be noted that for both crystalline [24] and amorphous [25] solids a negative ΔV is often considered a strong indication that the dominant charge carriers are electrons, although exceptions to this rule occur.
7Li NMR shows that Li+ ions move in C60 lattices at temperatures above 150–200 K [3, 5, 20] and the growth of a metal film in our dc experiment as well as the reported electrodiffusion doping of C60 with lithium [26] show that they can be driven by electric fields. Although ionic conductivity in Li4C60 is thus well established, our dc experiment indicates that electronic conduction dominates. We reported earlier [12] that an electronic model was easier to reconcile with high pressure data than an ionic model, and one of the main motives behind the present study was to find out whether our earlier data for the pressure dependence were correct. In fact, the present set of data is in very good numerical agreement with the earlier one, and the new data are much more stable and repeatable. The main difference observed is in the pressure dependence; in the present case the pressure dependence is even stronger, with an average pressure coefficient up to 2 GPa of −0.18 GPa−1 for the activation energy derived from parameter B (dominant above 150 K), while in our earlier study [12] it was −0.11 GPa−1. As discussed earlier, a negative pressure coefficient for the activation energy is difficult to explain in an ionic model, since the diffusion channels should shrink when the lattice is compressed. In an electronic model the bands are expected to become broader and the band gap to shrink with increasing pressure and a negative pressure coefficient is expected. A linear extrapolation of the present data suggests that B should reach zero already near 6 GPa. Assuming that the magnitude of the pressure coefficient decreases with increasing pressure in the normal way, this figure is in reasonable agreement with recent Raman data suggesting a possible metallization (closing of the gap) of Li4C60 near 9 GPa [12]. The present data thus support our earlier suggestion that an electronic model describes the transport properties better under pressure.
An alternative way to detect ionic transport is to measure the capacitance in the cell. When the ionic current is blocked by a steel electrode the Li+ ions pile up, forming an effective 'electrode' capacitor of sub-nm thickness and thus very high capacitance Ce. For the superionic phase of LiBH4, with a resistivity of 10–100 Ω cm, our recent measurements [14] showed that the measured Ce increased rapidly with decreasing frequency to reach values larger than 10−4 F near 1 Hz. On the other hand, if there is no such pile-up we basically expect C to depend only weakly on frequency; this should be the case for electronic conduction but also when ions can enter and leave electrodes.
The measured low-frequency capacitance data did, in fact, show a significant increase with increasing sample conductance and decreasing frequency for all samples, although the values were much lower than for superionic LiBH4. To check further whether the measured values for C were caused by stray impedances in the cell and high pressure feed-throughs or were related to sample properties, measurements were also carried out on pure graphite powder and percolation mixtures of graphite and talc or glass beads, all known to be electronic conductors. The final analysis showed a very strong correlation between the magnitudes of the measured R and C, but small differences between different materials or electrode materials. We show in figure 8 results from measurements of C on several samples near room temperature at frequencies below 100 Hz; in this figure we have included data also for Na4C60 and K4C60. Four of the samples had resistances between 14 and 27 Ω; the K4C60 sample had a resistance of 208 Ω and the graphite 54 Ω. All materials show a very similar functional dependence of C on frequency, and no sample stands out as different from the rest. If ionic conduction dominated, the Li4C60 sample with steel electrodes (open circles) should show much higher values than the other samples, and the Li4C60 sample with lithium electrodes (filled circles) a low value. In fact, we see the opposite behavior: the latter shows the highest capacitance, followed by pure graphite (which has a high dielectric constant). The inverse correlation between the magnitudes of the resistance and capacitance values extends to all samples of all materials; for a graphite composite with R ≈ 2 GΩ the measured capacitance is close to the value calculated from geometric data at all frequencies, but with decreasing R both the magnitude of the capacitance and its frequency dependence increase slowly. From these results we conclude that the observed increase in capacitance at low frequencies and for high conductivities is mainly an experimental artifact due to stray inductances and/or capacitances in the high pressure cell and feedthroughs, and that we observe no ion blocking capacitance associated with ionic motion in the experiments.
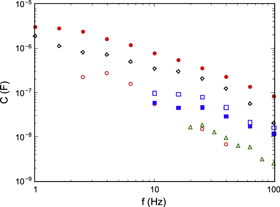
Figure 8. Measured capacitance values at low frequency for several samples with similar measured resistance value. Red circles Li4C60, blue squares Na4C60, green triangles K4C60, black diamonds graphite powder. Open symbols denote steel electrodes, filled symbols alkali metal electrodes.
Download figure:
Standard image High-resolution imageAlthough NMR and other probes show that Li+ ions may easily diffuse in Li4C60, the data presented above thus cannot confirm that the room-temperature conductivity is dominated by ionic conduction. The lack of a signal from a blocking capacitance, the negative derived activation volume and the fact that the derived activation energy decreases rapidly with increasing pressure strongly suggests an alternative model, in which the conductivity in Li4C60 is dominated by the electronic component. From our fitted conductance parameters B and D we can use a semiconductor model to derive excitation energies as 2kBB and 2kBD. Using the data in figure 7, this model yields energies of 0.39 and 0.17 eV. Since the band gap is belived to be significantly larger [3], these values should correspond to defect states below the conduction band from which electrons are being excited thermally. If we use instead m = 1 in equation (2), we find that the corresponding energies are Ed1 = 0.44 eV and Ed2 = 0.20 eV, respectively.
3.2. Na4C60
Two samples of Na4C60 were studied, the first of these with Na sheets on the electrodes (see table 1). The results were, in general, very similar to those for Li4C60, giving Cole–Cole and relaxation plots of the types shown in figures 2 and 3 above. The behavior of the conductance G as a function of T and p was also similar, as can be seen from a direct comparison between figures 6 and 9. Again, we fitted equation (2) to the data obtained on cooling at each pressure, as shown in figure 9, and figure 10 shows a plot of the fitted excitation parameters as functions of pressure for m = 0.

Figure 9. Conductance G for a Na4C60 sample at 0.1 GPa, plotted as a function of inverse temperature T−1. Stainless steel electrodes were used. The curve has been fitted using equation (2) with m = 0. Fitted parameters are B = 1661 K and D = 995 K.
Download figure:
Standard image High-resolution image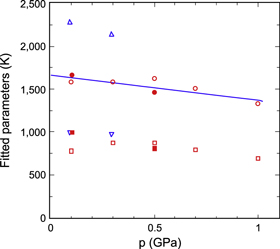
Figure 10. Fitted excitation parameters B and D for Na4C60, plotted as functions of pressure, p. Sample with Na electrodes: blue triangles (B) and inverted triangles (D), with steel electrodes: red circles (B) and squares (D). Open symbols denote increasing p, filled symbols decreasing p.
Download figure:
Standard image High-resolution imageFor Na4C60 the difference between the results with and without alkali metal electrodes was larger than for Li4C60. Insertion of Na sheets between the steel electrodes and the sample resulted in a 40% higher value for the fitted excitation parameter than when steel electrodes were in direct contact with the sample. Again, the experiment using a Na electrode failed already after the measurements at 0.3 GPa. Visual inspection showed the cause to be a deformation of the Na metal from sheets to hemispheres, resulting in a short circuit in the center. We see no reasonable mechanical mechanism for metal transport from the electrode periphery to the center at pressures below 0.3 GPa. The reason for the deformation is thus unknown, although electrotransport into the strong central electric field cannot be ruled out.
After a pressure cycle to 1 GPa the second Na4C60 sample was also submitted to a heating cycle to 400 K at 0.1 GPa. During heating we found nonlinearities which we ascribe to the same pressure-temperature hysteresis as discussed above, but equation (1) could be fitted with quite good accuracy to the data obtained on cooling from 400 to 293 K. The resulting value for B was slightly lower than the values found from the low-temperature experiments and the resistance was slightly higher after the experiment than before.
The data for Na4C60 are very similar to those for Li4C60. In particular, we again identify two conduction components with a cross-over near 150 K. The present data are much more stable and repeatable than the data from our earlier study [11], and although the pressure range was limited to 1 GPa by the equipment available we believe that the present results are more reliable than the data up to 2 GPa presented earlier. The measured resistivities were 35 Ω cm with steel and 90 Ω cm with Na electrodes; Stepniak et al [27] report a value near 3 Ω cm while Takabayashi et al [28] found a very high value near 7 × 10³ Ω cm. ESR results [6, 29, 30] are usually interpreted to show that Na4C60 is metallic.
As for Li4C60 we interpret our results in terms of a band model with thermally excited electrons, where the fitted parameters B and D correspond, respectively, to the band gap Eg = 2kBB and to donor states in the gap at a position Ed = 2kBD below the conduction band. From the data obtained with steel electrodes we find Eg = 0.29 eV while with Na electrodes we have Eg = 0.41 eV; in both cases, Ed = 0.17 eV. Using instead m = 1 in equation (2), Eg = 0.32 and 0.50 eV with steel and Na electrodes, respectively. The result found with steel electrodes is in very good agreement with the value Eg = (0.25 ± 0.10) eV found by Knupfer and Fink [7] from optical conductivities but much smaller than the value 0.8 eV found by Takabayshi et al [28] from their resistance measurements. (However, we note that Takabayashi et al find a lower value, 0.5 eV, below 250 K.) In our earlier study we found Eg = 0.4 eV and Ed = 0.15 eV, close to the present results. The pressure dependence of the band parameters is very strong also for Na4C60. The gap closes rapidly under pressure with a pressure coefficient of −0.18 GPa−1, and the pressure coefficient of Ed is even somewhat larger. The structure of Na4C60 has been well studied under high pressure [31–33] and recent results [33] indicate the existence of two phase transitions near 3 and 15 GPa, respectively. The transition near 3 GPa has been suggested to be associated with an increased conductivity; extrapolation of the present results suggests closing of the band gap at some pressure near or above 6 GPa, and the strong pressure dependence may thus not be directly connected with the known transition.
3.3. K4C60
The heavy alkali metal (K, Rb, Cs) fullerides do not polymerize but are still small band gap semiconductors due to a strong Jahn–Teller effect [8] which causes a small 'spin' related gap and a larger 'optical' gap [9]. The gaps have recently been visualized in several elegant experiments [34–36]. The Rb compound spontaneously phase separates already at pressures below 1 GPa [37] and is thus not studied here, but because K4C60 was studied in our earlier dc experiments [13] we include it here as an example of a non-polymerized A4C60 phase. Only one sample was studied, using the Agilent bridge, but the results were stable and the measurements were extended all the way to 2 GPa (table 1).
The results for K4C60 were very similar to those for Li4C60 and Na4C60 except for a weaker temperature dependence. We found again similar Cole–Cole plots and similar curves for capacitance versus frequency, relaxation curves etc, and again equation (2) could be fitted to the low frequency conductance data with a cross-over between curves just above 150 K. (In the case of K4C60 this coincides with freezing of the molecular rotation of C60 [9], providing a possible alternative explanation for the observed cross-over.) For K4C60 curve fitting was more difficult than for the lighter compounds because the fitted parameters were closer in magnitude to each other, and the deviations from the fitted curves were thus slightly larger. Figure 11 shows the results of the fitting procedure, again with m = 0, plotted as a function of pressure. The larger of the parameters is now similar in magnitude to the smallest parameters for the lighter compounds, while the smaller one is well below 150 K. The results obtained at 0.1 GPa showed much lower parameter magnitudes than those obtained at higher pressure; probably, this pressure was not high enough to compact the material completely.
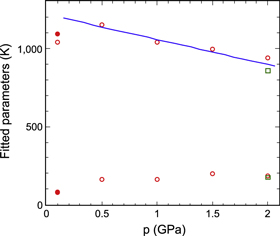
Figure 11. Fitted excitation parameters B (top) and D (bottom) for K4C60, plotted as functions of pressure, p. Open symbols denote increasing pressure, filled symbols decreasing pressure; squares measured on cooling from 411 K, circles on cooling from 293 K.
Download figure:
Standard image High-resolution image
Heating the sample to above 400 K had little effect on the magnitude of R at room temperature, showing that the material was very stable. However, analyzing the results of a cooling run from 400 to 100 K at 2 GPa we found that at least three exponential terms were needed for a good fit. As before, equation (2) gave an excellent fit below room temperature but above 300 K a third term had to be added, with a large fitting parameter near 3000 K. We associate this term with the band gap of K4C60 and calculate its value as Eg ≈ 0.5 eV, in excellent agreement with literature data from both experiments [7, 38] and calculations [39]. However, adding this term resulted in a decrease in the fitted B by 10–15%; it is thus possible that all fitted values given here are overestimated by such an amount because we did not include the band gap in the fitting procedure.
The resistivity of the sample near zero pressure at room temperature was surprisingly high, about 500 Ω cm. For comparison, Stepniak et al [27] found about 20 mΩ cm, Lof et al [40] about 100 mΩ cm, while from the data of Forró and Mihaly [41] we calculate a value close to 4 mΩ cm for a K4C60 single crystal.
Because the band gap has already been identified to be near 0.5 eV the fitting parameters B and D in figure 11 must be associated with the excitation of electrons over smaller gaps with magnitudes E1 = 210 meV and E2 = 35 meV (calculated as 2kBB and 2kBD) with m = 0, or E1 = 230 eV and E2 = 45 eV for m = 1. From the single crystal data of Forró and Mihaly [41] we can extract very approximate values for the same parameters with E1 > 160 meV (accuracy limited by graph resolution) and E2 ≈ 43 meV, both in good agreement with our results. Energy gaps of similar magnitudes, 50–250 meV, have been found in K4C60 by NMR [9, 42] and from the electronic Raman background [43, 44]. Our results thus agree very well with standard electronic models for K4C60.
As in our earlier study [13], no trace was found of the structural transformation near 250 K suggested by Kamarás et al [45]. The pressure dependence of the gaps observed is somewhat weaker than for the lighter fullerides; a straight line fitted to the results above 0.1 GPa showed that the pressure coefficient of the parameter B was about −0.13 GPa−1 (m = 0) or −0.15 GPa−1 (m = 1) while the parameter D is basically independent of pressure. If the data at 0.1 GPa are included the pressure coefficient falls to about −0.09 GPa−1. No high pressure transformations are known for K4C60, which to our knowledge has not yet been investigated above 2 GPa [46].
4. Conclusions
The electrical transport properties of the three fullerides studied here are surprisingly similar, considering the differences in structure. Below room temperature all materials show an Arrhenius behavior well described by equation (2), implying (at least) two independent conduction channels with different activation energies. For Na4C60 and K4C60 we can identify thermal excitation of electrons across the main band gaps, found to be 0.3 and 0.5 eV, respectively, in very good agreement with literature data [7]. For both materials our data agree well with an electronic conduction mechanism where additional electrons are excited thermally into the conduction band from gap states 35–230 meV below, boosting the low-temperature conductivity. Such states may be associated with alkali non-stoichiometry or C60 defects, but might also be connected with the Jahn–Teller gap in K4C60.
Li4C60 was recently identified as a superionic conductor, based on data from NMR and from ac and dc impedance measurements [3]. Activation energies obtained by all methods agreed extremely well, and 7Li NMR clearly showed a motional narrowing signifying ionic movement above room temperature. While most of the present data can be analyzed in terms of activation energies in excellent agreement with those given by Riccò et al [3], we find three strong arguments in favour of an alternative electronic model.
- (i)The measured pressure dependence shows that the 'activation energy' which Riccò et al [3] attributed to ionic conduction decreases rapidly with increasing pressure. This is strongly counterintuitive, since an applied pressure should mechanically close the diffusion bottlenecks, i.e. the basically trigonal openings between the voids in the Li4C60 lattice, increasing the corresponding activation energy for diffusion. In an electronic model, on the other hand, the electron gap is expected to decrease under pressure, in agreement with the experimental results. The observed pressure dependence of the assumed band gap is also in reasonable numerical agreement with conclusions found in a recent spectroscopic study [13]. We also observe a pressure-independent negative activation volume ΔV, usually taken as an indication that electronic transport dominates over ionic transport. However, we are aware that the ionic conductivity may increase under pressure in some materials [12].
- (ii)A very simple dc experiment showed that a current of 1 mA flowing through a typical sample did not transport a detectable amount of lithium over 50 h. For purely ionic conduction, this should have resulted in the transport of more than 13 mg lithium, an amount easily detectable by weighing.
- (iii)Ac impedance measurements on ionic conduction blocked by impermeable electrodes are expected to show an anomalous increase in effective capacitance at low frequencies, when ions pile up close to the negative terminal without being able to enter. (Capacitance values up to >10−4 F were observed in our recent measurements on LiBH4 [14].) While rather large low-frequency values of capacitance were indeed observed, the fact that very similar values were observed with and without alkali metal electrodes, for all fullerides and even for the electron conductor graphite, clearly shows that these data were experimental artifacts caused by stray reactances in the experimental high-pressure set-up. No 'blocking' capacitances were thus observed, contrary to what is expected for an ionic conductor. The same effect should also produce a minimum in Z'' in a Cole–Cole plot (figure 2) at the osculation point between 'sample' and 'electrode' arcs [14, 16], but no such effect could be observed here. While these observations do not exclude the existence of ionic conductivity, it shows that any such contribution is masked by a large electronic component.
We thus prefer to interpret our data for Li4C60 in terms of electronic conduction with the parameters B and D corresponding to gap energies near 390–440 meV and 170–200 meV, respectively. The band gap of Li4C60 is believed to be about 0.8 eV [3, 19] and we thus assign the observed energies to energy levels in the gap. The existence of such states due to damaged C60 molecules or alkali metal non-stoichiometry has been indicated by EPR data [5] and the modified Debye behavior shown in figure 3 may be taken as an indication that there is a distribution of such states. The pressure dependence of these gap states is also compatible with recent high-pressure Raman data, as discussed above.
Because many of our data agree quite well with those of Riccò et al [3], we were surprised to find so many indications contradicting the ionic transport model and we have considered possible explanations for this. There is a small possibility that the high ionic conductivity found by Riccò et al compared to our results, might be due to a difference in stoichiometry. The Li4C60 structure is obtained for a range of stoichiometries from 3 to 5 Li ions per C60 molecule. We speculate that a higher Li+ ion concentration makes ionic transport less efficient because there are not enough vacancies for ions to move; Riccò et al calculate that the presence of more than two Li+ ions in any octahedral void increases the energy of the system by 0.4–1 eV. It might thus be possible that a slightly lithium deficient material has a higher ionic conductivity that a high-lithium-density material, and it should be noted that we have intentionally kept the stoichiometry slightly high in all samples to avoid the formation of metallic phases. We suggest that this possibility should be investigated further by simulations or experiments in the future.
Finally, it should be repeated that we cannot, and do not, rule out ionic conduction in Li4C60, since the existence of moving Li+ ions has been proved by many methods (see above); however, we believe that we have shown that electrons carry a major part of the electric current in Li4C60 near room temperature and that the ionic current provides only a small fraction of the total charge transport.
Acknowledgments
This work was financially supported by the Swedish Research Council through grant no. 621-2010-3732, by the National Natural Science Foundation of China, grants no. 51320105007, 11104105 and 51025206, and by the 111 Project of China for International Collaboration and Exchange, grant no. B12011.