


Abstract
Since the discovery of the photoelectric effect, photoelectron spectroscopy has evolved into the most powerful technique for studying the electronic structure of materials. Moreover, the recent combination of photoelectron experiments with attosecond light sources using high-order harmonic generation (HHG) allows direct observation of electron dynamics in real time. However, the efficiency of these experiments is greatly limited by space-charge effects at typically low repetition rates of photoexcitation. Here, we demonstrate HHG-based laboratory photoemission experiments at a photoelectron count rate of 1 × 10⁵ electrons/s and characterize the main features of the electronic band structure of Ag(001) within several seconds without significant degradation by the space-charge effects. The combination of a compact HHG light source at megahertz repetition rates with the efficient collection of photoelectrons using time-of-flight spectroscopy may allow rapid investigation of electronic bands in a flexible laboratory environment and pave the way for an efficient design of attosecond spectroscopy and microscopy.
Export citation and abstract BibTeX RIS

Content from this work may be used under the terms of the Creative Commons Attribution 3.0 licence. Any further distribution of this work must maintain attribution to the author(s) and the title of the work, journal citation and DOI.
1. Introduction
Photoelectron spectroscopy (PES) has provided tremendous insight into fundamental physics and material science. By analyzing the energy, the momentum, as well as the spin of photoelectrons, a complete picture of electronic structure and related properties of materials can be uncovered. Because of this abundant information, the development of advanced PES has remained one of the pioneering research topics for many decades.
Until today, the evolution of angle-resolved photoelectron spectroscopy (ARPES) can be categorized into two groups. The first group focuses on the improvement of electron spectrometers for a better energy and momentum resolution and a higher detection efficiency. In conventional spectrometers based on a hemispherical energy analyzer, only one momentum component of the photoelectron can be analyzed simultaneously with the energy  . Therefore, the acquisition speed for a three-dimensional data set of the photoemission intensity
  is often limited by the sequential data acquisition with rotation of the sample or the spectrometer in between. This issue is solved by using an imaging spectrometer to record the two-dimensional momentum distribution of photoelectrons
  simultaneously [1–5]. With the recent development of time-of-flight (ToF) spectrometers, band mapping using ARPES is pushed to much higher efficiency since hundreds of energy channels within several eV are measured in parallel together with the two-dimensional momentum distribution
  [6–11].
The second group of modern ARPES is the establishment of new excitation light sources. Traditional light sources in the laboratory are discharge lamps with sufficient intensity but only at few photon energies. In strong contrast, the synchrotron radiation light sources cover a wide photon energy range with high brilliance and high energy resolution. Although ARPES with these two types of light sources is well established, there are difficulties applying them to ToF-based experiments. For ToF spectroscopy, the discharge lamps are not suitable due to the absence of a well-defined time structure. On the other hand, for synchrotron radiation, it is necessary to use the limited beam time of single-bunch or chopper-assisted modes at a reduced repetition rate (see later discussion) [6, 12–17].
An ideal laboratory light source for ToF-based ARPES is the femtosecond laser, whose applications to photoemission experiments have revealed atom and electron dynamics at the femtosecond time scale [18–22]. With recent progress of laser physics in high-order harmonic generation (HHG) of vacuum-ultraviolet (VUV) light [23–25], HHG light sources allow laboratory ARPES experiments with a wide photon energy range at attosecond time resolution [26, 27]. Nevertheless, the existing HHG light sources work mostly at several kilohertz repetition rate and the optical architecture becomes demanding when going to megahertz [28–30]. As a consequence of these low repetition rates, the space-charge effects between photoelectrons emitted from one light pulse limit significantly the efficiency of HHG-based photoemission experiments [31–33].
In order to boost the acquisition speed of laboratory ARPES in a space-charge-free condition, application of a HHG light source at high repetition rates is essential. To summarize this issue and to analyze available approaches, figure 1(a) displays the rate of photoemitted electrons as a function of the repetition rate of the light source. Different symbols mark available literature data for experiments using light sources such as high-order harmonic generation (HHG) [31, 33, 36–39], femtosecond lasers (UV laser) [7, 32, 40], and synchrotron radiation [16, 34, 35], for which space-charge effects have been observed and quantified. The diagonal dashed line represents the condition of one photoelectron emitted per light pulse that corresponds to the onset of space-charge effects. Above this line, photoemission spectra can be broadened in energy as well as in momentum due to the repulsive Coulomb interaction between electrons that are photoexcited within the light pulse duration. The theoretically estimated strength of space-charge effects is represented by the resultant energy shift (ΔE) of characteristic features in a modeled spectrum [41] and encoded as the red background color in figure 1(a). As is evident from this diagram, efficient photoemission experiments require as high as possible repetition rates to avoid space-charge broadening. There are, however, additional physical limitations due to the electron spectrometers or the detectors. For ToF PES, there is a necessary minimum time interval between light pulses in order to avoid temporal overlap between photoelectrons from successive light pulses. For an energy spectrum with 800 independent data points with a typical 300 ps time resolution of electronics, the minimum time interval is 240 ns and corresponds to an upper limit for the repetition rate at around 4 MHz. This limit is indicated by the vertical dotted line in figure 1. As a consequence, the working region for ToF spectroscopy without space-charge broadening is limited, as marked by the hatched region in figure 1(a). As one can clearly see, the optimal condition for ToF photoemission experiments corresponds to highest possible repetition rate with about 1 to 10 photoelectrons per pulse. However, so far, all HHG light sources for PES or microscopy are working at substantially lower repetition rates (see symbols in figure 1(a)).
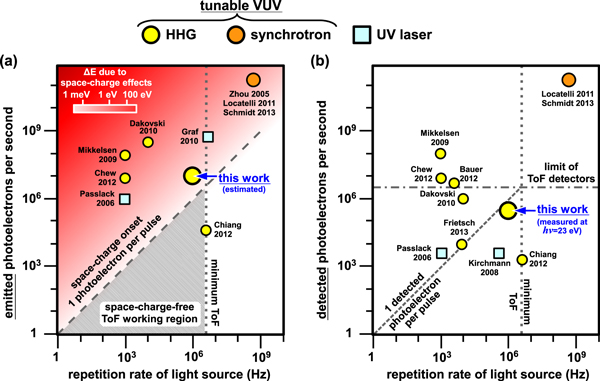
Figure 1. Summary for photoemission experiments using synchrotron radiation [16, 34, 35], HHG [31, 33, 36–39], and femtosecond lasers (UV laser) [7, 32, 40] by (a) the emitted and (b) the detected photoemission intensity versus the repetition rate of the excitation light source. The minimum ToF for photoelectrons is estimated as the dotted vertical line. In (a) the onset of space-charge effects (one photoelectron per pulse) is drawn as the dashed diagonal line and the color scale corresponds to the consequent energy shift as modelled by Hellmann et al with an assumed light spot diameter of 50 μm [41]. The hatched region marks the ideal working region for ToF PES. In (b) the additional limit of the channelplate detector is shown by the horizontal dashed-dotted line [8].
Download figure:
Standard image High-resolution imageFrom a practical point of view, it is also instructive to consider the number of detected photoelectrons at a given repetition rate. In general, the ratio between emitted and detected photoelectrons depends strongly on the type of analyzer. It can be also varied by the trade-off between analyzer transmission and energy or momentum resolution. In principle, the maximum acceptance is provided by combining an electron energy analyzer with the objective lens of a photoelectron emission microscope (PEEM) to collect all photoelectrons emitted in the full  solid angle above the sample surface [4, 5, 10]. Figure 1(b) shows a similar plot as in figure 1(a), but with the vertical axis replaced by the detected count rate of photoelectrons. For imaging detectors, there exists generally an upper limit for the detected count rate to avoid permanent damage. In the case of channelplate-based delay-line-detectors (DLD), a conservative estimation of maximum allowed count rate is about 3 × 10⁶ counts/s [8] and is shown by the horizontal line in figure 1(b) (dashed-dotted).
In this paper, we report on laboratory ARPES experiments with a ToF spectrometer close to the optimal condition using a megahertz HHG light source. HHG ARPES at 1 MHz repetition rate with a detected photoelectron count rate of 105 electrons/s benchmarks the efficiency, as indicated in figure 1. As an example, we discuss the photoemission experiments from a Ag(001) surface with linearly polarized light. It shows the twofold photoelectron momentum patterns owing to the symmetry-breaking of incident light polarization. Based on the high repetition rate, we are able to analyze 106 photoelectrons within one-quarter the Brillouin zone in a 10 second measurement and to identify the clear signal of the d band complex ranging from 4 to 6 eV below the Fermi level (EF).
2. Experimental setup
To perform ToF-based ARPES, we use a home-built HHG setup as the pulsed excitation light source [39]. The high-order harmonics are driven by a compact turn-key operation ytterbium-fiber laser system (Impulse, Clark-MXR, Inc., USA), delivering a photon energy of 1.2 eV and pulses with intensity full-width-at-half-maximum (FWHM) of 300 fs. In the present experiments, we used pulse energies of 10 and 14 μJ at repetition rates of 1 and 0.7 MHz, respectively. The light pulses are focused into a gas jet in a vacuum chamber and the generated VUV is separated and focused onto the sample in the photoemission chamber by a standard toroidal diffraction grating (MB Scientific, Sweden). Details of the HHG generation and selection are described in [39]. The harmonic spectrum can be measured by turning the toroidal grating gradually while recording the count rate at the channelplates in the DLD of the ToF spectrometer.
The photoelectrons are collected by a commercial ToF spectrometer with a  acceptance angle (Themis 1000, SPECS, Germany [8]). The ToF of photoelectrons is determined by the time difference between reference light pulses from the laser and the arrival time on the detector. The hit-position on the DLD is measured using time-to-digital converters. The reference time pulses from the laser are calibrated using the reflection of HHG light pulses from the sample. From the measured ToF of photoelectron and its hit position on the DLD, the kinetic energy and the emission angle of the photoelectron are derived using a conversion matrix from model calculations of the electron trajectory in the ToF spectrometer [42].
3. Results
3.1. HHG at MHz repetition rate
For an argon gas jet as generation medium, the HHG spectrum as back reflected from a Ag(001) crystal is shown in figure 2(a). Under these conditions, the photons are reflected at an angle of  onto the chevron channelplate in the DLD of the ToF spectrometer. The absolute photon flux is estimated by using the reflectivity of silver at 32 eV (≈0.1 [43]) together with the detection efficiency of the channelplate (≈0.1 [44]). The maximum photon flux from argon is located at a photon energy around 32 eV with a value of
  photons/s, which is less than one photon per laser pulse at this high repetition rate of 0.7 MHz. In total, the generated HHG spectrum covers the energy range from 20 to 40 eV with argon as the generation medium.

Figure 2. Spectra of high-order harmonics generated from (a) argon and (b) xenon. The spectrum in (a) as well as the blue dashed curve in (b) are the harmonics generated by laser pulses at 0.7 MHz, and the photon flux is measured by reflection upon a Ag(001) surface onto the channelplate. The black and red curves in (b) are the harmonic spectra generated at 0.7 and 1 MHz, respectively. They are measured indirectly according to the yield of photoelectrons collected by the ToF spectrometer within an acceptance angle of  .
.
Download figure:
Standard image High-resolution imageThe HHG photon flux can be greatly enhanced by using xenon as the generation medium. In figure 2(b), the HHG spectra from xenon driven at 0.7 and 1 MHz are displayed. Due to the high photon flux generated from xenon, these spectra have to be measured indirectly according to the number of photoelectrons entering the ToF spectrometer within an acceptance angle of  , corresponding to about 0.03% of the full
  solid angle above the sample surface. A reflection measurement, as completed for argon, can only be performed for photon energy near 16 eV with moderate photon flux and is shown by the blue dashed curve. The photon flux at 16 eV from xenon is estimated to be 4.6 × 10⁷ photons/s or 66 photons/pulse at 0.7 MHz. At the maximum of the spectrum around 25 eV, the photon flux is estimated to be 8 × 10⁸ photons/s (1100 photons/pulse). Switching to 1 MHz leads to lower photon flux because of a lower pulse energy setting of the pumping laser. The maximum photon flux at 1 MHz is around 1.5 × 10⁸ (150 photons/pulse) at the photon energy of 22.7 eV. Note that the HHG intensity is more than three orders of magnitude higher than in our previous HHG study where a laser oscillator at 4 MHz was used [39]. Using xenon, the available photon energies are lower than using argon and range from 14 to 32 eV. Below 14 eV, the transmission of the toroidal grating, which is optimized for 40 eV, drops significantly [45].
According to the results in figure 2(b), we can estimate the total yield of photoelectrons. At the maximum of the spectrum for a photon energy of 25 eV at 0.7 MHz, we measured around 8 × 10⁴ electrons/s emitted into 0.03% of the  full hemisphere. This small solid angle of detection was set by turning off all the electron lenses of the ToF spectrometer and was intentionally used to avoid damage of the detector at high count rates. As a rough estimation, a simple scaling up to the full
  hemisphere leads to a photoelectron yield of 2 × 10⁸ electrons/s emitted from the sample at 0.7 MHz, which corresponds to around 300 electrons/pulse. About 5 × 10⁷ electrons/s emitted from the sample is estimated from experiments at 1 MHz, and this emission intensity is marginally above the space-charge onset of one electron/pulse. The ratio of the estimated number of photoelectrons to the number of incident photons per second is about 0.25. This value is a factor of three higher than the known photoemission yield [46, 47] and can be ascribed to the emission angle and light polarization dependence that are neglected in the estimation. In figure 1(a) we show the conservative estimation of the total yield of photoelectrons at around 1 × 10⁷ electrons/s at 1 MHz, which is close to the optimal condition in the ToF working region.
3.2. Fast ToF photoemission experiments
To demonstrate the efficiency of our present setup, we present a fast photoemission measurement from Ag(001) at 1 MHz with a photon energy of 22.7 eV. The angle of incidence of light is  and the light is p-polarized. In figure 3, we show the data from a single measurement with an acquisition time of 10 s and nominal kinetic and pass energy setting as 16 and 60 eV, respectively. Within this short time, we detected a total number of 3 × 10⁶ photoelectrons and this count rate is indicated in figure 1(b) for comparison with other photoemission experiments. The photoelectrons are analyzed according to their ToF and hit positions on the DLD in the spectrometer. This analysis yields the three-dimensional photoemission intensity as a function of energy
  and momentum components
  parallel to the surface
  . The two-dimensional slices of the photoemission intensity with energy versus momentum are shown in figures 3(a) and (c),
  and
and  , respectively. In figure 3(e), we depicted the line profiles I(E) at fixed kx = ±0.35 Å−1 from figure 3(a). Clear features of the d bands from 4 to 7 eV below the Fermi energy (EF) with high intensity are observed and the weak intensity above 4 eV is attributed to the sp bands. The cutoff at 8 eV is due to the limit of the electron lens system in the ToF spectrometer at the chosen setting.
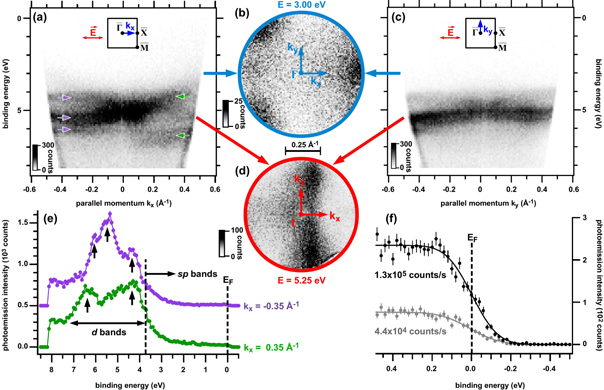
Figure 3. Distribution of photoelectrons from Ag(001) collected within 10 s using p-polarized light with a photon energy of 22.7 eV. (a) and (c) show the energy-momentum slices at ky = 0 and kx = 0 with a thickness of the slice of 0.2 Å−1. In (b) and (d) the two-dimensional momentum distributions of photoelectrons at binding energies 3.00 and 5.25 eV are displayed with an integrated energy window 1.0 and 0.5 eV, respectively. Line profiles at ±0.35 Å−1 with a width of 0.1 Å−1 through the slice in (a) are shown in (e). Angle-integrated photoemission spectra near the Fermi edge, (EF) measured at different count rates are shown in (f). In the inset of (a) and (c), the orientation of light electric field ( ) to the parallel momentum is indicated together with the surface Brillouin zone.
Download figure:
Standard image High-resolution imageCloser inspection of the dispersion of the photoemission features in figure 3(a) reveals a clear asymmetry between the positive and negative kx sides. As indicated by the arrows in figures 3(a) and (e), on the negative side of kx we observed three branches of d bands, whereas on the positive side, only two branches can be seen. This asymmetry in photoemission pattern can be further identified in the momentum distribution of photoelectrons  , as shown in figures 3(b) and (d) for different energies. The momentum distribution has a mirror symmetry with respect to the kx axis but no mirror symmetry about the ky axis. This observation can be explained by the experimental geometry as defined by the Ag(001) surface with fourfold symmetry and by the linearly polarized incident light within the optical plane on which the kx axis is located. The linear polarization of light is 45
 tilted from the surface normal and simultaneously has a component parallel to the kx momentum direction, as well as another component perpendicular to the surface. These two electric field components can cause interference in the matrix element of photoemission and result in an asymmetric distribution of photoelectrons [49, 50]. As a consequence, breaking the original fourfold symmetry with the incident off-normal light leads to a twofold pattern, which has only mirror-symmetry about the kx axis in our case. The appearance of the threefold pattern in figure 3(b) can be considered as a special case of a mirror-symmetric pattern with respect to the kx axis at this specific binding energy.
To check whether space-charge effects have an influence on the present experiments, we follow the well-established method in the literature and compare the Fermi-edge in photoemission spectra measured with different count rates [34, 40]. In figure 3(f), we show the angle-integrated photoemission spectra near the Fermi energy (EF) measured with  and
and  electrons/s and the fits with a step function convoluted by a Gaussian function. From the fit, the position of the Fermi edge in these two spectra can be evaluated and their difference is less than 10 meV. We therefore exclude significant space-charge effects much higher than 10 meV, which is in accordance with our expectation for the MHz high repetition rates, as discussed in figure 1. The full-width-at-half-maximum (FWHM) of the Gaussian functions in the fits is around 250 meV. By taking into account the thermal broadening of the Fermi–Dirac distribution that corresponds to a FWHM of around 100 meV at 300 K, we estimate the energy resolution in the present experiments as 230 meV. This value is larger than that in our previous measurements on the surface state of Cu(111) surfaces using a lower photon energy [39]. As included in the energy resolution, about 180 meV can be attributed to the bandwidth of the HHG light source at a photon energy of 22.7 eV, whereas the other 150 meV comes from the energy resolution of the ToF spectrometer for the present lens setting of a 12 eV energy window. This estimated bandwidth of the harmonics corresponds to a transform-limited pulse duration of about 9 fs from generation, which is subsequently stretched by the monochromator grating to about 2 ps.
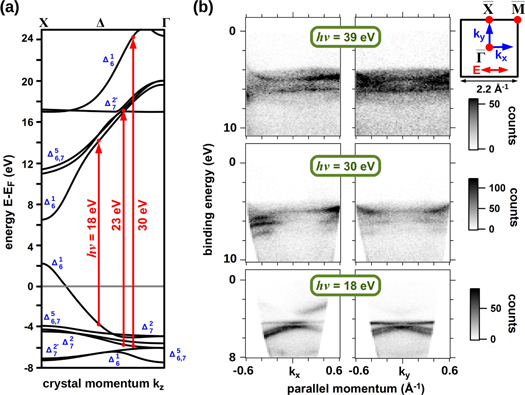
The features of electronic bands observed in photoemission spectra in figure 3 can be qualitatively interpreted by the band structure of Ag(001), as shown in figure 4(a) [48]. With a photon energy close to 23 eV, the dominant photoemission signals come from the resonance between Ag d and unoccupied sp bands. Similar transitions from the d bands can also take place at higher photon energies of 30 and 39 eV as observed in figure 4(b). In addition, at a lower photon energy of 18 eV, a resonance between sp bands occurs and photoemission signals from the Ag sp bands with stronger dispersion along the momentum direction kx is observed, as shown in the lowest panel of figure 4(b).
Figure 4. (a) Theoretical band structure of Ag(001) with possible transitions illustrated for different photon energies [48]. (b) The energy-momentum slices of photoemission spectra at kx = 0 and ky = 0 from Ag(001) measured with p-polarized light at variable photon energies. These slices have a thickness of 0.2 Å−1 and the orientation of the parallel momenta is indicated in the inset with the surface Brillouin zone.
Download figure:
Standard image High-resolution image
4. Discussion
In the following, we compare the efficiency of the MHz HHG setup with photoemission experiments with discharge lamps in the laboratory, as well as at synchrotron radiation facilities. Our quantitative comparison is based on the detected photoemission count rate according to the spectrometer acceptance and the space-charge limit.
4.1. Comparison with laboratory experiments using discharge lamps
In conventional laboratory photoemission experiments using a hemispherical energy analyzer in combination with a discharge lamp, the sequential azimuthal rotation of the sample is necessary for a three-dimensional  data set. Based on the 180 min measurement by Reinert et al with an angular acceptance of
  and a high-energy resolution of 3.5 meV, we estimate an acquisition time of 10 min for a measurement with comparable momentum range and energy resolution to our results in figure 3 [51]. This longer acquisition time than our present HHG-based experiments can be attributed to an order of magnitude lower photoemission intensity from the surface states and the slow subsequent sample rotation in their experiments. Using the PEEM-based spectrometer to collect all emitted photoelectrons, a three-dimensional data set
  typically takes 0.5 to 1 h [4, 5]. A comparable measurement using our present setup requires a 30 times longer acquisition time than for the data in figure 3 and the total measurement time is about 5 min. Therefore, our setup is more efficient than these laboratory experiments using a laboratory discharge lamp either with a hemispherical energy analyzer or a PEEM-based spectrometer.
Despite the lower efficiency of these laboratory ARPES experiments using a discharge lamp, they may be advantageous due to the high-energy resolution coming from the narrow width of the ionization lines. On the other hand, the HHG-based ToF experiments provide a more simple control over the polarization of light as well as the possibilities for time-resolved pump-probe experiments.
4.2. Comparison with experiments using synchrotron radiation
In comparison to laboratory light sources such as discharge lamps or HHG, synchrotron radiation can provide significantly higher photon flux at a higher repetition rate, as indicated in figure 1. Therefore, synchrotron-based ARPES experiments can be generally more efficient than our laboratory HHG-based ARPES experiments. In order to compare the relative efficiency, in the following, we discuss the space-charge-limited ARPES experiments using synchrotron in the normal operation mode in combination with a hemispherical energy analyzer, as well as in the single-bunch mode with a ToF spectrometer.
For experiments with a hemispherical energy analyzer, we estimate the acquisition time of space-charge-limited synchrotron ARPES experiments using a count rate of 200 photoelectrons per pulse near the onset of space-charge effects ( = 1.4 meV) at a 500 MHz repetition rate [34]. Assuming this count rate as the maximum intensity in experiments and an isotropic distribution of photoelectrons, there are 1011electrons/s emitted from the sample and 3 × 10⁹ electrons/s within the ±15° emission angle enter the hemispherical energy analyzer. To acquire a two-dimensional momentum distribution with a range and a resolution comparable to our results in figure 3, experiments with the hemispherical energy analyzer need to include 240 steps within the 180° azimuthal sample rotation. Therefore, the effective count rate for measuring a three-dimensional data set
  is reduced by a factor of 1/240 and ends up at 1 × 10⁷ electrons/s. This count rate is about two orders of magnitude higher than that in our HHG-ToF experiments and proves that the synchrotron-based experiment with a hemispherical energy analyzer is more efficient. The higher efficiency of synchrotron ARPES experiments is directly related to their two orders of magnitude higher repetition rate than our HHG light source and this aspect was overlooked in an earlier comparison in [11].
In strong contrast to ARPES using the hemispherical energy analyzer, experiments with a ToF spectrometer require a reduced repetition rate of the synchrotron radiation [6, 17]. The single-bunch mode at several synchrotron facilities operates at a repetition rate in the range from 1.25 MHz at BESSY [16, 17] and NSLS [12], to 3 MHz at ALS [15] and 5 MHz at ESRF [14]. Despite the much more intense light from synchrotron than in our laboratory HHG setup, the detected photoelectron count rate would not be significantly higher beyond 106 counts/s due to the limit of the imaging detectors. Therefore, we estimate a conservative maximum count rate of synchrotron-based ToF PES of around 106 counts/s, which can be reached using our laboratory HHG-based experiments.
5. Summary
To summarize, we demonstrate efficient laboratory-based ARPES using HHG from a fiber laser at megahertz repetition rate in combination with ToF spectroscopy. Count rates as high as 1 × 10⁵ electrons/s within a 3% portion of the full  solid angle are detected and analyzed. The presented efficiency significantly improves conventional laboratory ARPES experiments using discharge lamps or laser-based HHG light sources at kHz repetition rates. Our results provide a guide for efficient and flexible laboratory-based band-mapping experiments that are important for general studies in material science. Such HHG light sources at high repetition rates might pave the way for compact ultrafast time-resolved multi-dimensional PES and microscopy, where thousands of photoelectron spectra at different pump-probe delays are required [52, 53].
Acknowledgments
Technical support from R Kulla, R Neumann, F Weiß, K Sklarek, and H Menge as well as financial support from the DFG through SFB 762 are gratefully acknowledged.