


Abstract
Here we study the alkali metal induced effects on an ordered and aligned sexiphenyl monolayer on Cu(110) with angle-resolved UV spectroscopy (ARUPS). The caesium (Cs) induced gap states could clearly be identified by orbital tomography, a method based on ARUPS, which allows both the orbital character of these states and the molecular orientation to be determined. We show that with increasing alkali metal dose, doping proceeds in three distinct steps. Initially, Cs decouples the molecular monolayer from the substrate, with emptying of the lowest unoccupied molecular orbital (LUMO) that had been filled on hybridization with the substrate. Further Cs exposure refills the LUMO. Finally a filling of the LUMO + 1 by charge transfer from the alkali metal occurs. Remarkably, although long range order is not preserved and the molecular planes tilt away from the surface, the molecules remain aligned parallel to the ![$[1 \bar 1 0]$](https://content.cld.iop.org/journals/1367-2630/16/2/023011/revision1/nj482777ieqn1.gif) azimuth during the whole doping process.
azimuth during the whole doping process.
Export citation and abstract BibTeX RIS

Content from this work may be used under the terms of the Creative Commons Attribution 3.0 licence. Any further distribution of this work must maintain attribution to the author(s) and the title of the work, journal citation and DOI.
1. Introduction
In organic electronics, both the charge transport and the ability to inject charges at the metal contact are factors determining device performance. One way to tune these parameters is to expose the molecular film to alkali metals. This alkali metal doping causes severe modifications to both the molecular electronic structure and level alignment [1–7]. In addition, the conductivity of the molecular films becomes enhanced, which is associated with new electronic states introduced into the former band gap. In π-conjugated polymers and oligomeric films these gap states have often been termed solitons, polarons, bipolarons, etc (see e.g. [1–6, 8, 9]). Polyparaphenylene (PPP) was the first non-degenerate ground-state polymer discovered to be conducting on doping [10] and the first material for blue light emitting diodes [11]. However, for controlled surface science investigations such polymers are not suited as they are ill defined in chain length and purity. p-Sexiphenyl (6P) provides a good oligomeric model for PPP, being both a blue light emitting diode (LED) material and a conductor on alkali metal doping [12]. UV-photoemission spectroscopy (UPS) of disordered 6P films with increasing caesium (Cs) exposure have shown two distinct doping regimes. These results for the gap states together with valence effective Hamiltonian calculations of the bond length changes suggest that first bipolarons (6P2−) then intrachain interacting bipolarons (6P4−) form with increasing Cs concentration [13]. With a few recent exceptions [14, 15], most doping studies have been performed on disordered molecular films and, consequently, the orbital character of the gap states could not be unambiguously determined. For oriented molecular films, the angular/momentum distribution of the photoelectrons observed in angle-resolved UPS (ARUPS) has been shown to be related to the Fourier transform of the molecular orbital real space distribution [16–20]. By recording the full two-dimensional momentum distribution of the emitted photoelectrons over the binding energy range of interest and by comparing this to the Fourier transform of the appropriate molecular orbitals as given by density functional theory (DFT), both the molecular states within this energy window can be identified and the molecular orientation is determined. This method has become known as orbital tomography [18–21]. While orbital tomography has been used to obtain molecular azimuthal orientation, it also can be used to obtain the molecular tilt angle with respect to the substrate (as shown in the supplementary material of [16]). Here, orbital tomography is applied to an ordered 6P monolayer on Cu(110) exposed to increasing amounts of Cs. This has allowed the determination of the orbital character of the gap states that appear upon doping and its influence on the molecular conformation and orientation.
2. Experimental and computational details
Laboratory based UPS and workfunction investigations were performed with an angle resolving Scienta SES 200 spectrometer (acceptance angle of ±8°, energy resolution of 100 meV). The spectra were taken at room temperature in the principal azimuthal directions with unpolarized He radiation (HeI = 21.218 eV). ARUPS measurements of the full hemisphere of emitted electrons were performed in the toroidal electron energy analyzer [22] attached to the synchrotron beamlines (U125-2 SGM and TGM-4) of Helmholtz–Zentrum Berlin. The toroidal electron spectrometer was used to collect electron emissions in two different modes: (a) band maps (energy versus momentum k), where the incident plane contains a principal azimuth of the substrate and the electrons are analyzed as a function of energy and electron takeoff angle (± 80°) and (b) momentum maps (kx versus ky), where emissions from the whole k-space at constant electron energy are detected while rotating the sample azimuthally. At the synchrotron, the sample was probed with a photon energy of 35 eV at 40° incidence angle at room temperature with a total energy resolution of 150 meV. Low energy electron diffraction (LEED) investigations were performed with a multi-channel plate LEED from Omicron. All experiments were performed in situ under UHV conditions at base pressures in the 10−10 mbar region. The Cu(110) crystal was cleaned by initial flashing (> 500 K), followed by several cycles of Ar+-ion sputtering and subsequent annealing at 800 K. The clean surface was checked with LEED, UPS and workfunction measurements. With a home-made molecular beam evaporator the 6P thin films were grown with a thickness of 3 Å (1 monolayer) at room temperature. This produces an excellent c(2 × 22) LEED pattern [23]. Note, however, that Cs exposure destroys the pattern and results in films with no long range order. The constant deposition rate of around 1.5–3.5 Å min−1 was monitored with a quartz microbalance. For doping, Cs was deposited using alkali-metal getter sources from SAES Getters. After initially heating the getter source for 45 s, a constant temperature was reached and the sample was moved to evaporation position for a defined amount of time, depending on the desired doping level. The utilized Cs dosing unit (DU) corresponds to the amount of Cs deposited during a time interval of 1 min at a ac current of 4.5 A rms. Calibration of the rate of the Cs source indicated 1 DU yielded ≈0.1 Cs per Cu surface atom.
Electronic structure calculations are performed within DFT for both the free and undoped 6P molecule utilizing the ABINIT code [24]. The all-electron potentials are replaced by extended norm-conserving, highly transferable Troullier–Martins pseudo-potentials [25] using a plane wave cut-off of 40 Ryd. We employ a super cell approach with a box size of 120 × 30 × 30 Bohr3 and Γ point sampling of the Brillouin zone. Calculations for both planar and twisted molecular geometry (torsional angle of 30°) were made with all other internal structural degrees of freedom relaxed by using a generalized gradient approximation (GGA) [26] for exchange–correlation effects. Photoemission momentum maps are simulated for a free 6P molecule, either planar or twisted, assuming a plane-wave final state as described in a previous publication [16]. For taking into account the molecular tilt angle τ with respect to the substrate surface, momentum maps rotated +τ and −τ around the long molecular axis are superimposed owing to the two-fold symmetry of the substrate surface [16]. We have also performed calculations for quadruply Cs-doped 6P. To this end we have adopted a geometry suggested by experiment and constructed a freestanding layer of planar 6P molecules tilted by 75° around their molecular axes and interjacent Cs atoms uniformly spread along the 6P molecule (see insets of figure 5). The spacing between two adjacent molecules was 6.5 Å and sufficient vacuum was added in the other two directions, and 16k points have been used to sample the Brillouin zone perpendicular to the molecules. The VASP code with projector augmented plane wave basis set has been used for these calculations [27–29] and, as for the isolated molecule, exchange–correlation effects are treated within the GGA [26].
3. Evolution upon Cs doping
A HeI UPS Cs dosing series of a 6P monolayer in normal emission geometry is displayed in figure 1. The bottom spectrum of figure 1(a) shows the emissions from the undoped 6P monolayer on Cu(110). The dominant features between 2 and 4 eV arise from the Cu d-band. At a binding energy of around 4.5 eV the most prominent emissions from the 6P molecules are the six degenerate non-bonding π-orbitals (πnb). This feature will guide us as a so-called spectator orbital through the doping series as, unlike the frontier orbitals (highest occupied molecular orbital (HOMO) and lowest unoccupied molecular orbital (LUMO)), it is not expected to be greatly affected on alkali doping and any observed energy changes will principally arise from changes in the workfunction and polarizability on forming the charge transfer complex. A first Cs deposition of 2 DU shifts all molecular features by about 1.2 eV to higher binding energy, which is similar to the workfunction change displayed in figure 1(c). By 4 DU of Cs a very strong new emission appears just below the Fermi level. The spectator orbitals show a splitting which can be attributed to the presence of doped (π−2nb) and undoped molecules (π0nb) at lower and higher binding energies, respectively. The emissions from undoped molecules are shifted to higher binding energy by the small decrease in workfunction. The shift of the doped molecular features (e.g. π−2nb) to lower binding energy is attributed to better screening of the photohole [30] in the negatively charged molecules. At a dose of 5 DU the band gap emission reaches its maximum and the undoped non-bonding orbitals disappear. Thus the filling of the first doping state, also observed in [31], is completed. Above 5 DU, a second state appears below the Fermi level, which grows upon further Cs dosing and is fully developed at around 9 DU. The filling of the second doping state leads to shifts in both the spectator orbitals (π−4nb) and the initial doping state of 0.5 eV to higher binding energy, which is less than the workfunction change of 0.8 eV. This 0.3 eV difference is probably due to better screening upon further charge being given to the molecules.

Figure 1. (a) HeI UPS spectra of a sexiphenyl monolayer on Cu(110) at increasing Cs deposition. Molecular spectator emissions (πnb) and emerging doping states in the molecular band gap are indicated. The spectra were taken in ![$[1\bar 10]$](https://content.cld.iop.org/journals/1367-2630/16/2/023011/revision1/nj482777ieqn2.gif) direction at normal emission and are displayed w.r.t. the Fermi level. (b) Spectra taken at 50° electron takeoff angle have been referenced to the vacuum level (i.e. shifted by the respective workfunctions) to emphasize that the ionization potential of the doping states stays nearly constant upon increasing doping. (c) Workfunction development at increasing Cs deposition showing a drop prior to the appearance of each doping state. Different doping levels are distinguished by gray shading.
direction at normal emission and are displayed w.r.t. the Fermi level. (b) Spectra taken at 50° electron takeoff angle have been referenced to the vacuum level (i.e. shifted by the respective workfunctions) to emphasize that the ionization potential of the doping states stays nearly constant upon increasing doping. (c) Workfunction development at increasing Cs deposition showing a drop prior to the appearance of each doping state. Different doping levels are distinguished by gray shading.
Download figure:
Standard image High-resolution imageThe two doping regimes observed in the normal emission spectra in figure 1(a) are similar to what has been reported for disordered thick films [13, 32]. However, our results are distinct in that they are from a film of aligned molecules bound to a substrate where strong angular emission effects and hybridization with the substrate occur. In particular, in the undoped stage, hybridization with substrate states leads to filling of the LUMO. This ex-LUMO state of the monolayer is, however, not observed in normal emission spectra [23, 33]. Therefore, the spectra of figure 1(b) are taken at 50° emission angle where both the hybridized LUMO state of the monolayer and the states that appear on doping can be observed. It is evident that at 2 DU, before the doping states are filled by charge transfer from Cs, the hybridized substrate/ex-LUMO state is first emptied by the initial Cs exposure.
Generally, a monotonic decrease in the workfunction on Cs deposition on metal substrates at room temperature is characteristic and commonly understood as the formation of a dipole layer [34]. As seen in figure 1(c), the workfunction does not decrease monotonically, but clearly two plateaus are displayed, which can be assigned to the two doping regimes, as in the case of doping of thicker disordered 6P films [13, 32]. The highest doping regime has a very low workfunction of 1.4 ± 0.1 eV, which is lower than that for metallic Cs (condensed below RT) of 2.0 eV. This value is in reasonable agreement with the value calculated for a free standing layer with four Cs atoms per 6P molecule of 1.75 eV.
We now shift our focus to how doping is manifest in ARUPS band maps, E(k), where a range of electron emission angles (k) is seen simultaneously. ARUPS-derived band maps of the four observed doping levels of a 6P monolayer on Cu(110) are collected in figure 2. These band maps were detected in ![$[1\bar 1 0]$](https://content.cld.iop.org/journals/1367-2630/16/2/023011/revision1/nj482777ieqn3.gif) azimuthal direction, where both the HOMO and LUMO can be seen. In the uppermost part (0) of figure 2 we observe the HOMO and LUMO emissions of undoped 6P, as well as the Cu s-, p- and d-bands. The LUMO below the Fermi edge at k = ± 1.5 Å−1 is visible due to charge transfer on hybridization with substrate states as discussed in [23]. After an initial Cs deposition one would naively expect a shift of the molecular emissions to around 1 eV higher binding energy, as seen in the spectator orbitals and concomitant workfunction change. But in fact we no longer see any emission from the LUMO, and the band map between d-band and Fermi edge, as plotted in figure 2 (I), resembles the clean substrate albeit with reduced intensity. This can be understood as a decoupling of the molecules from the substrate, which will be explained in more detail in the following section. The absence of the HOMO emission in this scan is understandable by taking into account the Cs induced workfunction drop and a concomitant shift of the molecular features into the Cu d-band. On further Cs exposure (II), features of the first doping state appear in the molecular band gap region at around 0.6 eV below the Fermi edge. They are noticeable around the former LUMO position at k = 1.5 Å−1, but also around the Γ point at k = 0 Å−1 with even higher intensity. The band map at the highest doping level is shown in figure 2 (III). Features of the first doping state are shifted to higher binding energy and additional emissions from the second doping state appear at lower binding energy. The momentum and energy spacing of the highest doping level can be regarded in more detail in the inset. Here, the momentum structure has been resolved with the higher energy resolution Scienta spectrometer at liquid nitrogen temperature. The two doping levels are separated in energy by around 0.6 eV and in momentum space by ±0.15 Å−1. The schematics in the right part of figure 2 summarizes the observed stages in the development of the 6P monolayer during increasing Cs deposition.
azimuthal direction, where both the HOMO and LUMO can be seen. In the uppermost part (0) of figure 2 we observe the HOMO and LUMO emissions of undoped 6P, as well as the Cu s-, p- and d-bands. The LUMO below the Fermi edge at k = ± 1.5 Å−1 is visible due to charge transfer on hybridization with substrate states as discussed in [23]. After an initial Cs deposition one would naively expect a shift of the molecular emissions to around 1 eV higher binding energy, as seen in the spectator orbitals and concomitant workfunction change. But in fact we no longer see any emission from the LUMO, and the band map between d-band and Fermi edge, as plotted in figure 2 (I), resembles the clean substrate albeit with reduced intensity. This can be understood as a decoupling of the molecules from the substrate, which will be explained in more detail in the following section. The absence of the HOMO emission in this scan is understandable by taking into account the Cs induced workfunction drop and a concomitant shift of the molecular features into the Cu d-band. On further Cs exposure (II), features of the first doping state appear in the molecular band gap region at around 0.6 eV below the Fermi edge. They are noticeable around the former LUMO position at k = 1.5 Å−1, but also around the Γ point at k = 0 Å−1 with even higher intensity. The band map at the highest doping level is shown in figure 2 (III). Features of the first doping state are shifted to higher binding energy and additional emissions from the second doping state appear at lower binding energy. The momentum and energy spacing of the highest doping level can be regarded in more detail in the inset. Here, the momentum structure has been resolved with the higher energy resolution Scienta spectrometer at liquid nitrogen temperature. The two doping levels are separated in energy by around 0.6 eV and in momentum space by ±0.15 Å−1. The schematics in the right part of figure 2 summarizes the observed stages in the development of the 6P monolayer during increasing Cs deposition.
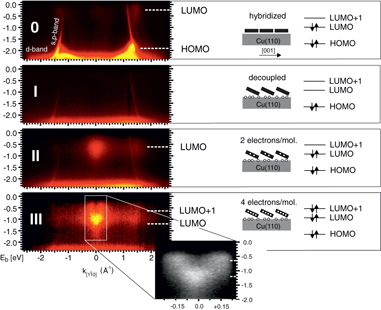
Figure 2. ARUPS band maps referenced to the Fermi level of the four observed dosing stages measured with the toroidal analyzer. All spectra were taken with emission in the [1–10] azimuthal plane along the long molecular axis. The insert scan, scanned with better energy resolution (Scienta) with HeI excitation at liquid nitrogen temperature, clarifies the distinct structure of the two doping states at maximum doping. On the right are schematics of the observed doping regimes illustrating both the molecular geometry and the occupation of the frontier valence band orbitals.
Download figure:
Standard image High-resolution image4. Doping state characterization from momentum maps
The character of the doping states can be investigated in more detail by analyzing their momentum space distribution. This also allows the orientation of the molecules to be inferred. In order to check which momentum space patterns might be expected, we have simulated momentum maps of the 6P LUMO and LUMO + 1 for two molecular conformations—planar and with an interring twist angle of the gas phase 6P of 30°—and for various adsorption geometries in figure 3. Note that these momentum maps are based on Fourier transforms of the 6P LUMO and LUMO + 1 orbitals for the isolated 6P molecule as depicted in panels (a), (b) and (c) for the twisted and planar molecule, respectively. In particular, we have varied the molecular tilt angle τ from 0° (corresponding to a flat adsorption geometry) to 90° (corresponding to edge-on molecules) in steps of 10° rotating the molecule around its long molecular axis thereby inferring that the orientation of the long molecular axis along the Cu rows is maintained. Note that due to the twofold symmetry of the substrate, all simulated maps in figure 3 are superpositions of tilts in +τ and −τ directions [16]. The comparison between 6P LUMO for the interring twisted molecule in row (d) and the same orbital for the planar molecule in row (e) reveals that these two molecular conformations can be clearly distinguished, based on the π/a feature for the twisted 6P as observed in a thick film of 6P [33], but absent for planar 6P [16, 23]. Also, the LUMO + 1 depicted in row (f) exhibits a clear signature that allows its distinction from the LUMO, namely the splitting of the central stripes at kx = 0 into two features at roughly ±2π/L, where L denotes the length of the molecule. Moreover, the dependence on the tilt shows a characteristic dependence that may allow for a determination of the molecular tilt angle as has been demonstrated for a thick crystalline film of pentacene [16]. Overall, from these simulations we can expect that not only the character of doping state but also the underlaying molecular conformation and adsorption geometry may be deduced.

Figure 3. Simulated momentum maps of the 6P LUMO and LUMO + 1. Panel (a) shows the LUMO DFT of an isolated, undoped 6P molecule with an interring torsion angle of 30°, while (b) and (c) show the LUMO and LUMO + 1 of a planar 6P molecule. Panels (d)–(f) display simulated momentum maps for these three orbitals for increasing tilt angle τ, that is rotations of the molecular backbone about the long molecular axis, from 0° (flat laying) to 90° (edge on) in steps of 10°. Note that for each tilt angle, the simulated momentum maps show in fact a superposition of two tilts for +τ and −τ, respectively.
Download figure:
Standard image High-resolution imageIn figure 4, experimental momentum maps at various doping stages are displayed. Figure 4 (a) shows the LUMO emissions from the undoped molecules which hybridize with the substrate, (b) from doping level II with the first doping state being filled and (c) and (d) doping state emissions from doping level III with filling of both doping states. The k-map of the undoped 6P LUMO (a) clearly has the character of the LUMO modified slightly due to hybridization with the Cu substrate [23]. Comparison with the calculated (DFT) momentum map of the 6P LUMO in figure 4(e) indicates that the molecules are planar on the substrate and oriented with the molecular axes parallel to the Cu rows in ![$[1\bar 1 0] $](https://content.cld.iop.org/journals/1367-2630/16/2/023011/revision1/nj482777ieqn4.gif) direction. This is also verified by scanning tunnelling microscopy (STM) [35] and UPS studies [33]. Doping level I is omitted in this figure as there are no molecular emissions between the Fermi edge and the top of the d-band due to decoupling. The k-map of the first doping state (figure 4(b)), measured around an energy of 0.6 eV, is reminiscent of the hybridized LUMO with the maxima at
direction. This is also verified by scanning tunnelling microscopy (STM) [35] and UPS studies [33]. Doping level I is omitted in this figure as there are no molecular emissions between the Fermi edge and the top of the d-band due to decoupling. The k-map of the first doping state (figure 4(b)), measured around an energy of 0.6 eV, is reminiscent of the hybridized LUMO with the maxima at ![$k_{[1\bar 10]}$](https://content.cld.iop.org/journals/1367-2630/16/2/023011/revision1/nj482777ieqn5.gif) = 0 and ±1.5 Å−1. The emission intensities are, however, elongated along the [001] direction. This indicates that the molecules have maintained their orientation along the
= 0 and ±1.5 Å−1. The emission intensities are, however, elongated along the [001] direction. This indicates that the molecules have maintained their orientation along the ![$[1\bar 10]$](https://content.cld.iop.org/journals/1367-2630/16/2/023011/revision1/nj482777ieqn6.gif) direction but now have their aromatic planes tilted around the long molecular axis w.r.t. the surface [16]. Tilted molecules were also observed in complementary x-ray absorption studies of a 6P monolayer on a Cu(110)-(1 × 2)Cs reconstructed [36] substrate, where the 6P molecules also align along the surface corrugation in
direction but now have their aromatic planes tilted around the long molecular axis w.r.t. the surface [16]. Tilted molecules were also observed in complementary x-ray absorption studies of a 6P monolayer on a Cu(110)-(1 × 2)Cs reconstructed [36] substrate, where the 6P molecules also align along the surface corrugation in ![$[1 \bar 10]$](https://content.cld.iop.org/journals/1367-2630/16/2/023011/revision1/nj482777ieqn7.gif) azimuthal direction [37]. Simulations of the LUMO map for different tilt angles (see figure 4) show a best fit for a planar molecule with a tilt of ±22° as plotted in figure 3(f). The first doping state can thus be identified as the LUMO filled by charge transfer from the Cs.
azimuthal direction [37]. Simulations of the LUMO map for different tilt angles (see figure 4) show a best fit for a planar molecule with a tilt of ±22° as plotted in figure 3(f). The first doping state can thus be identified as the LUMO filled by charge transfer from the Cs.
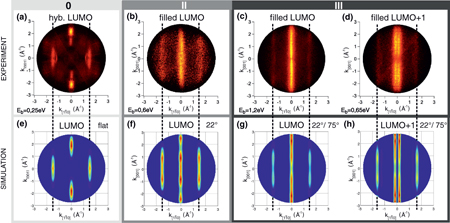
Figure 4. Experimental ARUPS momentum maps (a–d) are compared to simulations of the 6P LUMO (e–g) and LUMO + 1 (h) maps. (a) and (e) refer to the undoped 6P monolayer, (b) and (f) to the doping stage II and (c), (d), (g) and (h) refer to doping stage III. Simulations are for molecular tilt angles of 0° (a), ±22° (f) and a 1:1 mix of ±22° and ±75° (g–h).
Download figure:
Standard image High-resolution imageTwo distinct momentum maps are observed for the states of the second doping regime (III) at energies centred on 1.2 eV (figure 4(c)) and 0.65 eV (figure 4(d)). The 1.2 eV doping state is observed at the same k-values as the LUMO, but shifted to a higher binding energy by 0.6 eV and its ±1.5 Å−1 features are weak relative to the 0 Å−1 emission.
Comparison of the second doping state at 0.65 eV (d) to theoretical maps of a tilted LUMO + 1 (h) confirms its identity. The emissions of the LUMO + 1 appear at k = ± 0.15 and ±1.65 Å−1, which are 0.15 Å−1 further out than the LUMO features, in perfect agreement with the theoretical values.
In both momentum maps the orbital emissions are elongated in [001] azimuthal direction, indicating that the molecules are again tilted. As can be seen in figure 3, no single tilt of the molecules can explain the observed intensity distribution of the momentum maps for the LUMO and LUMO + 1. For instance, the angle of 22° inferred from the LUMO in the stage II result does not explain the relative weakness of the high k value features observed in doping stage III for the LUMO and LUMO + 1. This intensity distribution can be explained by a one to one mix of ±22° and ±75° tilted molecules as shown in figures 4(g) and (h).
Summarily, the results show complete filling of the LUMO first and then the LUMO + 1 in the intramolecular π band of 6P with increasing Cs dose, i.e. transferring two and four electrons from the alkali metal to a molecule. That the molecule can accept so much charge appears surprising. However, our interpretation of the experimental data is in accordance with DFT calculations for a freestanding film of 6P molecules doped with four Cs atoms per molecule. For these calculations we have assumed a tilt angle of 75° and placed four Cs atoms uniformly distributed over the length of one 6P molecule between two adjacent molecules as depicted in the insets of figure 5. When analyzing the pDOS as depicted in figure 5, we observe that both the former 6P LUMO and LUMO + 1 are located below the Fermi level. The pDOS reveals that no significant hybridization occurs between the molecular and Cs states, rather there is a mere charge transfer from the Cs 6s states to the 6P LUMO and LUMO + 1 states. This is also manifested by the fact that the partial charge densities of the molecular features denoted by H − 1, HOMO, LUMO and L + 1 closely resemble the respective charge densities of the undoped 6P HOMO − 1, HOMO, LUMO and LUMO + 1. Regarding the work function, the DFT calculation for this freestanding layer of quadruply doped 6P predicts a value of 1.75 eV, which is in reasonable agreement with the experimental one for the fully doped film. It is also evident from the figure that the calculations yield fully occupied LUMO and LUMO + 1 states noting that an artificial broadening of 25 meV has been included in obtaining the DOS curves. As a side note, the apparent energy splitting of the LUMO and LUMO + 1 by 0.15 and 0.10 eV, respectively, is in fact a result of the intermolecular band dispersion of the LUMO and LUMO + 1, which leads to such characteristic van-Hove-like peaks at the band edges of such a quasi one-dimensional dispersion perpendicular to the long molecular axis. Given that the molecules remain oriented on doping, this suggests that intermolecular dispersion [33, 38] may exist in the doped film. Such dispersion would appear as changes in the momentum maps of particular orbitals over their binding energy width. However, momentum maps were taken in the region from the Fermi edge to the top of the d-band but no dispersion was observed. This may be due to a lack of long range order of the molecules in the doped film.

Figure 5. Computed partial density of states (pDOS) of Cs-doped 6P. DOS of a free-standing layer of 6P doped with four Cs atoms per molecule (black line). The pDOS of carbon and Cs atoms are shown as blue and red lines, respectively. The insets show the partial charge densities corresponding to the energy ranges corresponding to the LUMO + 1, LUMO, HOMO and HOMO-1 of 6P. The energy axis is with respect to the vacuum level, the Fermi level is indicated by the vertical dashed line.
Download figure:
Standard image High-resolution image
The finding of fully occupied LUMO and LUMO + 1 doping states is in agreement with the UPS spectra shown in figure 1, which reveal roughly equal weights of the LUMO and LUMO + 1 peaks and both are located below the measured Fermi edge. Thus, we did not observe any evidence for doping with one or three electrons in our photoemission experiments. Such two- and four-electron doping states have previously been assigned to bipolarons and interacting bipolarons due to calculated bond length changes [13, 39–42]. This identification is not in contradiction to the assignment here of filling first the LUMO and then the LUMO + 1 when their orbital structure, shown in figure 3, is considered. This electron distribution and associated bond length changes on filling the LUMO would lead to bond length alternation with the major effect in the middle of the molecule, whereas on filling the LUMO + 1 the greatest change would be expected around ring two and five in the molecule.
5. Conclusion
In this work the Cs induced effects on a 6P monolayer on Cu(110) have been investigated with ARUPS. The molecular orientation and the character of the doping states have been determined using momentum maps obtained by ARUPS. Three distrinct regimes of Cs doping have been observed: initially, the Cs goes to the interface and decouples the molecules from the substrate. In doing so the lowest unoccupied molecular orbital, which had been filled by hybridization with the Cu substrate, is emptied. In subsequent dosing steps the LUMO and then the LUMO + 1 are filled by charge transfer from the alkali. In all these steps the molecules remain parallel to each other aligned along the ![$[1 \bar 10]$](https://content.cld.iop.org/journals/1367-2630/16/2/023011/revision1/nj482777ieqn8.gif) azimuth. However, the momentum maps of the doping states clearly indicate that the aromatic planes are tilted with respect to the substrate. This work examplifies the strength of orbital tomography as it allows identification of the orbital character of molecular emissions and yields the molecular orientation even for systems with no long range order.
azimuth. However, the momentum maps of the doping states clearly indicate that the aromatic planes are tilted with respect to the substrate. This work examplifies the strength of orbital tomography as it allows identification of the orbital character of molecular emissions and yields the molecular orientation even for systems with no long range order.
Acknowledgments
We acknowledge Helmholtz–Zentrum Berlin for allocation of synchrotron radiation beamtime and would like to thank Dr Christian Schüßler-Langeheine and Mike Sperling for assistance. This work has been financially supported by the Austrian Science Fund (FWF), projects P21330-N20 and P23190-N16. The research leading to these results has received funding from the European Community's Seventh Framework Programme (FP7/2007-2013) under grant agreement number 226716.